| Param | Original file | Final file |
|---|---|---|
| Filename | modeM0/AS1A10_071T07_9000004322_30065cztM0_level2.evt | modeM0/AS1A10_071T07_9000004322_30065cztM0_level2_quad_clean.evt |
| Size (bytes) | 581,232,960 | 62,870,400 |
| Size | 554.3 MB | 60.0 MB |
| Events in quadrant A | 3,362,520 | 404,957 |
| Events in quadrant B | 4,990,487 | 406,015 |
| Events in quadrant C | 3,815,624 | 363,744 |
| Events in quadrant D | 5,015,692 | 297,227 |
| Mode M0 | |||
|---|---|---|---|
| Quadrant | BADHDUFLAG | Total packets | Discarded packets |
| A | 0 | 13383 | 2 |
| B | 0 | 18913 | 2 |
| C | 0 | 15098 | 2 |
| D | 0 | 18617 | 2 |
| Mode SS | |||
|---|---|---|---|
| Quadrant | BADHDUFLAG | Total packets | Discarded packets |
| A | 0 | 126 | 0 |
| B | 0 | 126 | 0 |
| C | 0 | 126 | 0 |
| D | 0 | 126 | 0 |
| Mode M9 | |||
|---|---|---|---|
| Quadrant | BADHDUFLAG | Total packets | Discarded packets |
| A | 0 | 16 | 0 |
| B | 0 | 17 | 0 |
| C | 0 | 17 | 0 |
| D | 0 | 17 | 0 |
| Quadrant | Total seconds | Saturated seconds | Saturation percentage |
|---|---|---|---|
| A | 6171 | 34 | 0.550964% |
| B | 6171 | 81 | 1.312591% |
| C | 6171 | 834 | 13.514827% |
| D | 6171 | 930 | 15.070491% |
Noise dominated data is calculated using 1-second bins in cleaned event files. If a bin has >2000 counts, and if more than 50% of those come from <1% of pixels, then it is considered to be noise-dominated and hence unusable.
| Quadrant | # 1 sec bins | Bins with >0 counts | Bins with >2000 counts | High rate bins dominated by noise | Noise dominated (total time) | Noise dominated (detector-on time) | Marked lightcurve |
|---|---|---|---|---|---|---|---|
| A | 7526 | 6172 | 5 | 5 | 0.07% | 0.08% | 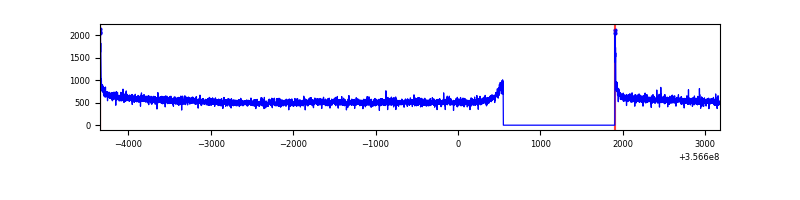 |
| B | 7526 | 6172 | 2 | 2 | 0.03% | 0.03% | 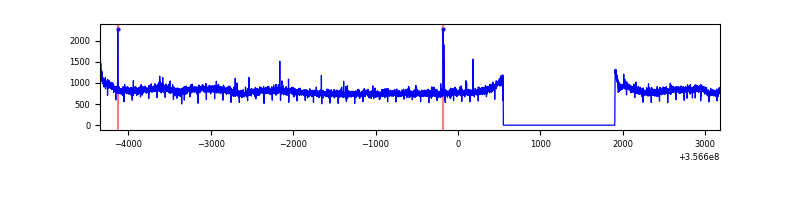 |
| C | 7526 | 6172 | 0 | 0 | 0.00% | 0.00% | 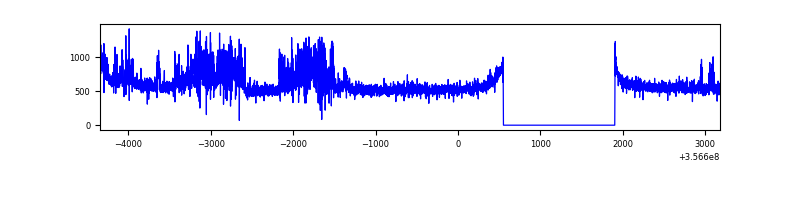 |
| D | 7526 | 6172 | 590 | 590 | 7.84% | 9.56% | 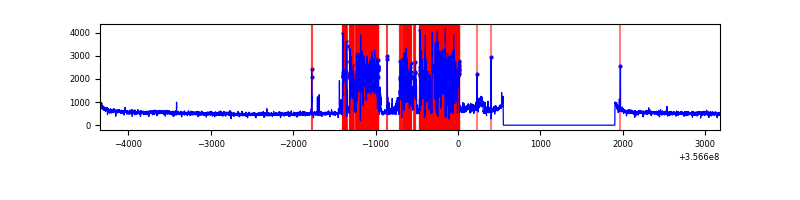 |
Top three noisy pixels from each quadrant. If the there are fewer than three noisy pixels in the level2.evt file, extra rows are filled as -1
| Pixel properties | Quadrant properties | ||||||
|---|---|---|---|---|---|---|---|
| Quadrant | DetID | PixID | Counts | Sigma | Mean | Median | Sigma |
| A | 8 | 192 | 24684 | 139.11 | 866 | 854 | 171.3 |
| A | 13 | 254 | 10304 | 55.16 | 866 | 854 | 171.3 |
| A | 3 | 137 | 7923 | 41.27 | 866 | 854 | 171.3 |
| B | 6 | 159 | 1608886 | 10033.03 | 856 | 840 | 160.3 |
| B | 12 | 111 | 19446 | 116.09 | 856 | 840 | 160.3 |
| B | 11 | 111 | 17726 | 105.36 | 856 | 840 | 160.3 |
| C | 14 | 238 | 374775 | 2107.61 | 776 | 786 | 177.4 |
| C | 14 | 254 | 337072 | 1895.13 | 776 | 786 | 177.4 |
| C | 3 | 233 | 49388 | 273.89 | 776 | 786 | 177.4 |
| D | 13 | 104 | 1923784 | 10918.45 | 748 | 734 | 176.1 |
| D | 8 | 195 | 101897 | 574.37 | 748 | 734 | 176.1 |
| D | 7 | 223 | 63818 | 358.17 | 748 | 734 | 176.1 |
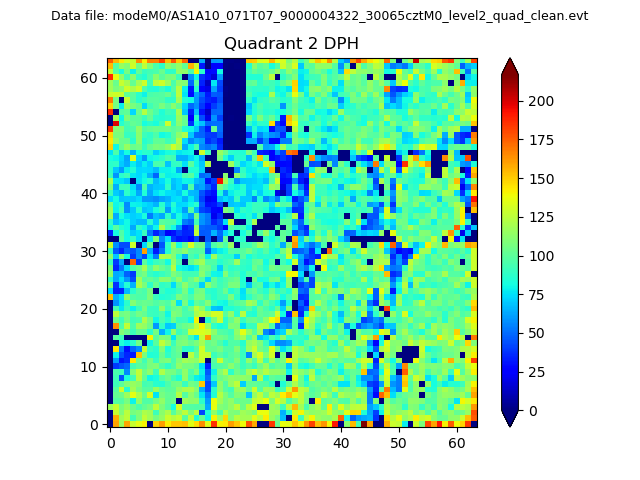
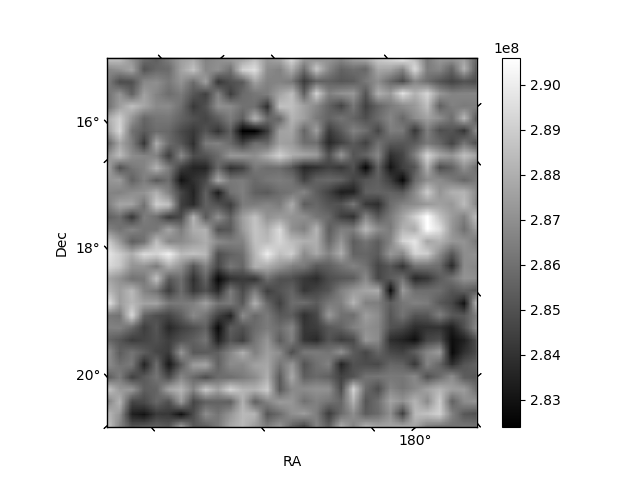
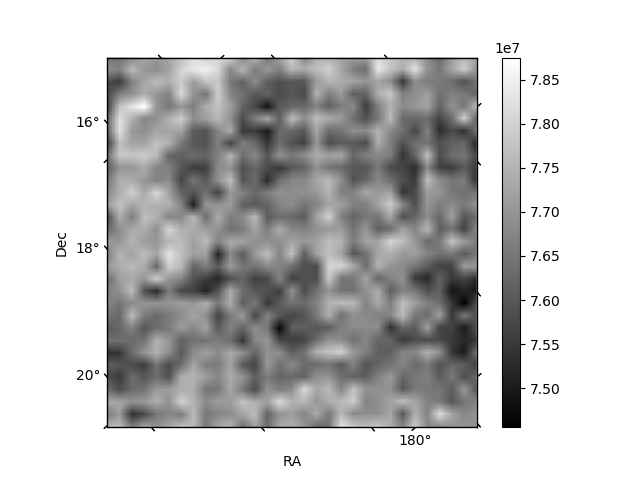
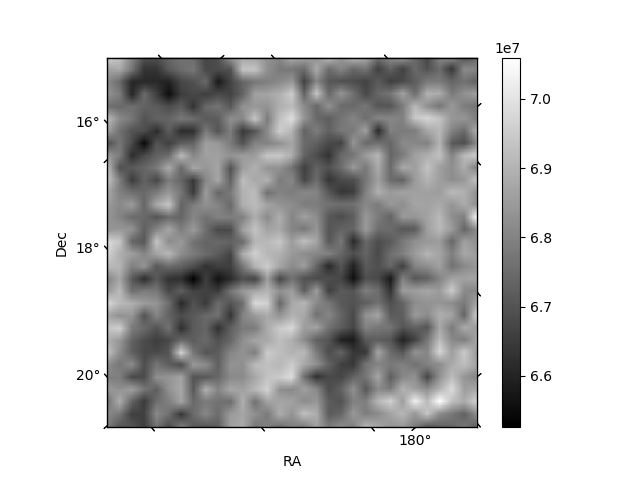
Histogram calculated using DETX and DETY for each event in the final _common_clean file
| Quadrant A | 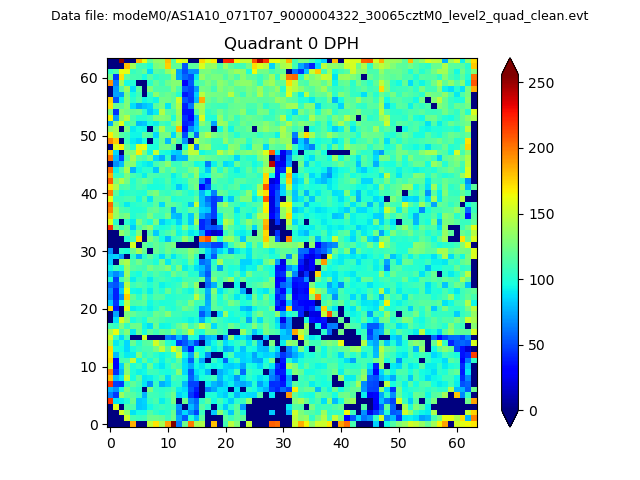 |
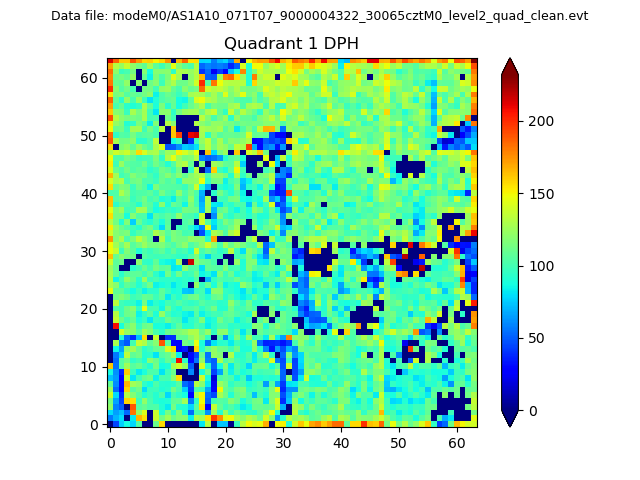 |
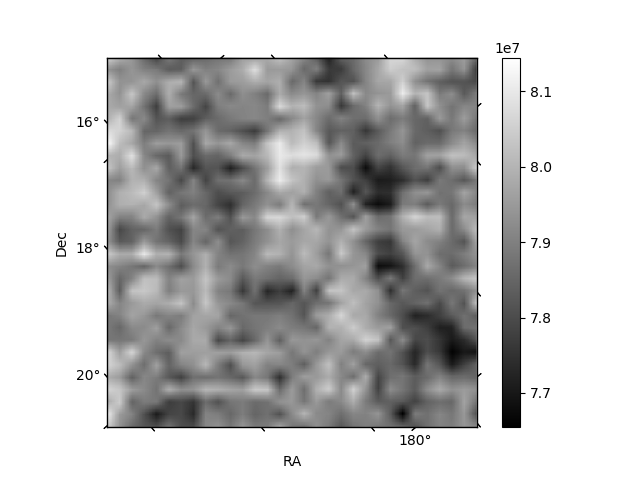
Quadrant B |
|---|---|---|---|
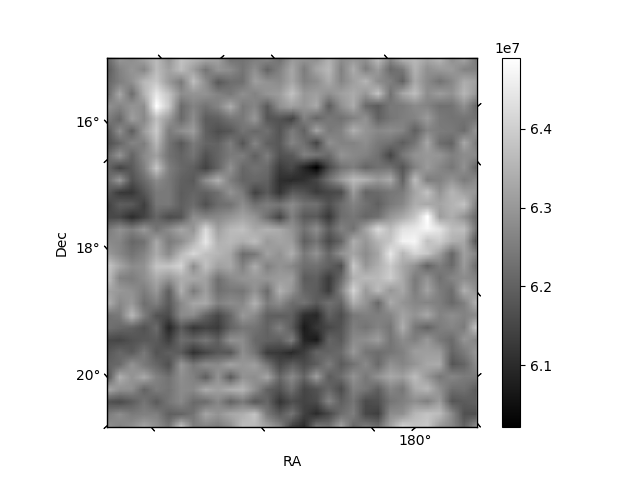
| Quadrant D | 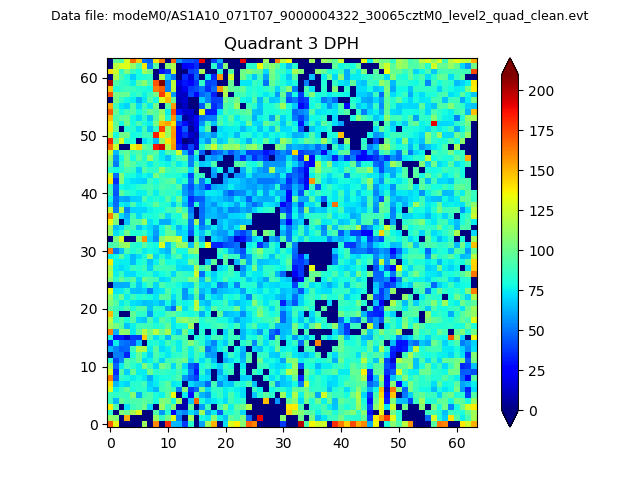 |
 |
Quadrant C |
| Plot type | Count rate plots | Images |
|---|---|---|
| Comparison with Poisson distribution Blue bars denote a histogram of data divided into 1 sec bins. Red curve is a Poisson curve with rate = median count rate of data. |
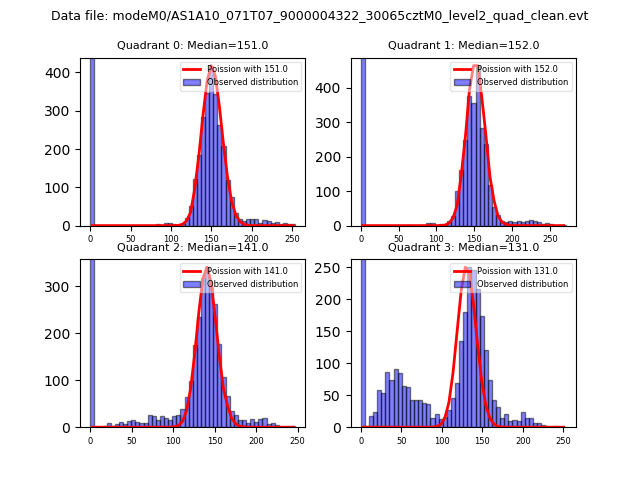 |
 |
| Quadrant-wise count rates Data is divided into 100 sec bins |
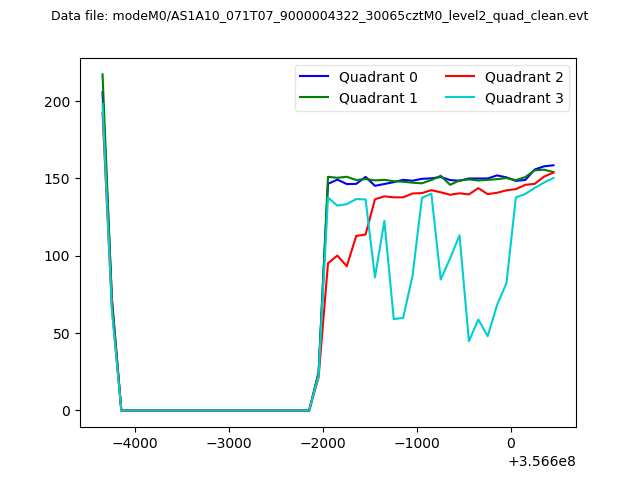 |
|
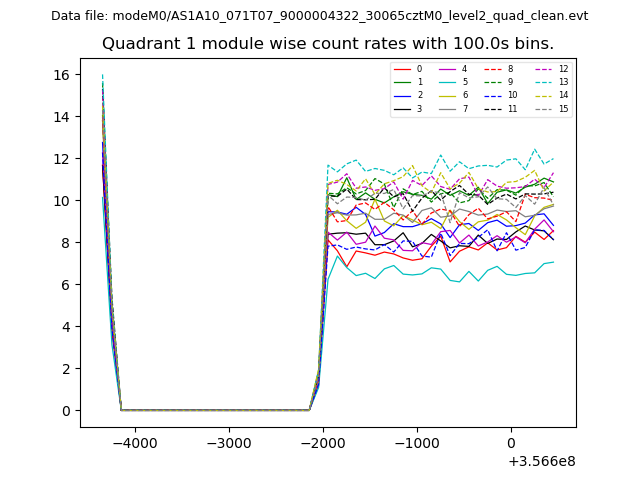
| Module-wise count rates for Quadrant A Data is divided into 100 sec bins |
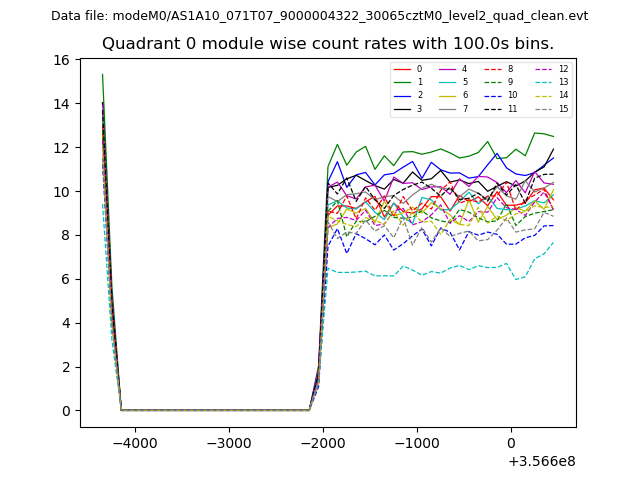 |
 |
| Module-wise count rates for Quadrant B Data is divided into 100 sec bins |
 |
 |
| Module-wise count rates for Quadrant C Data is divided into 100 sec bins |
 |
 |
| Module-wise count rates for Quadrant D Data is divided into 100 sec bins |
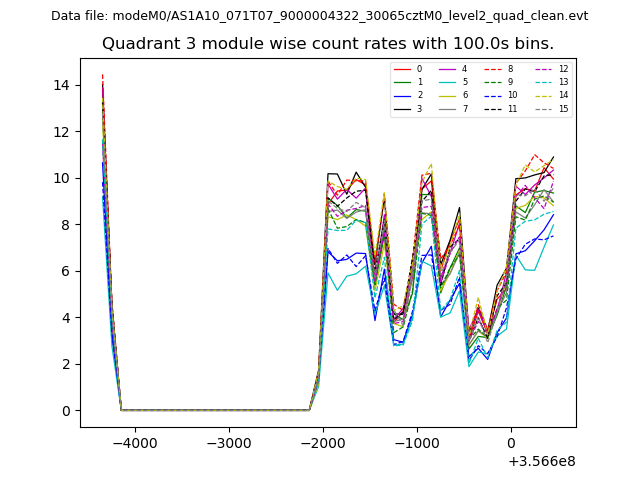 |
 |
| Parameter | Plot |
|---|---|
| CZT HV Monitor |  |
| D_VDD | 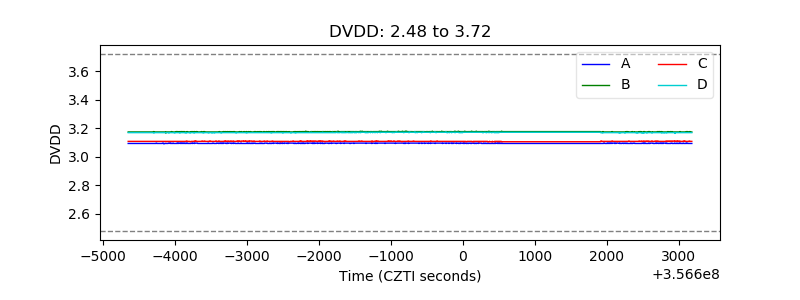 |
| Temperature 1 | 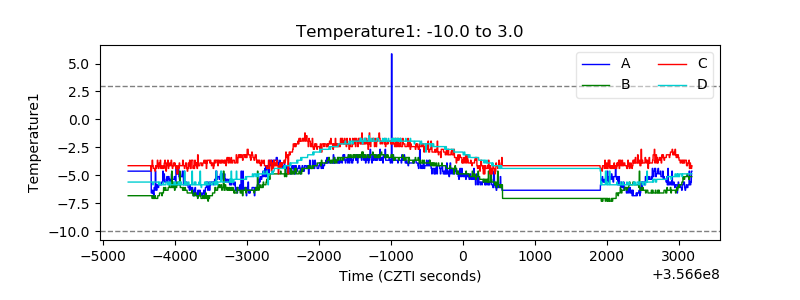 |
| Veto HV Monitor | 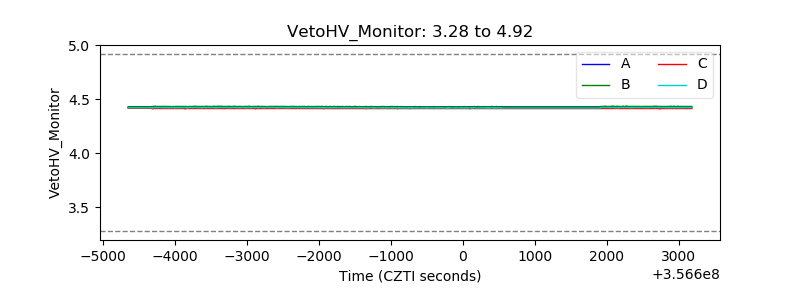 |
| Veto LLD | 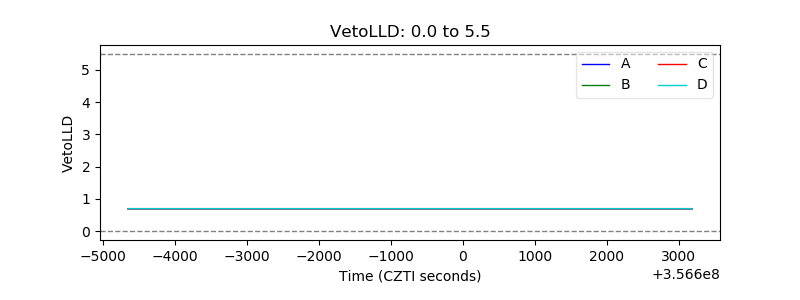 |
| Alpha Counter | 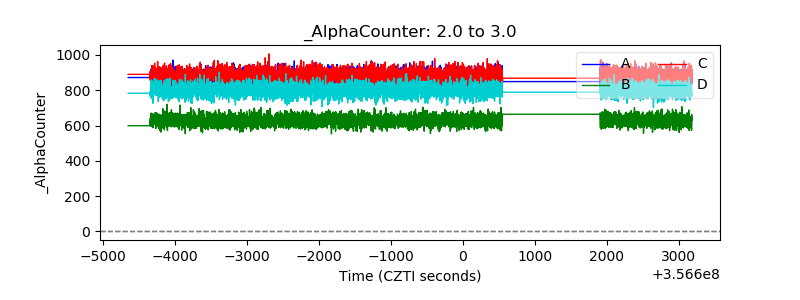 |
| _CPM_Rate | 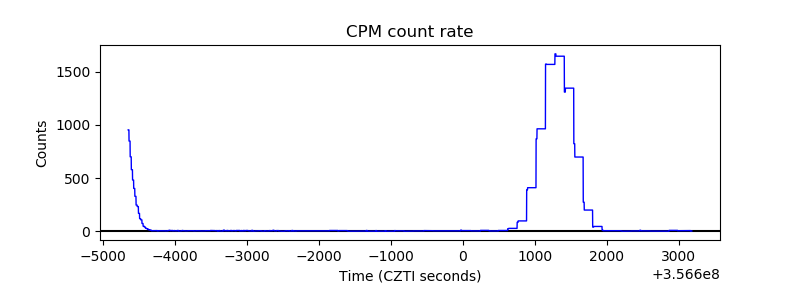 |
| CZT Counter | 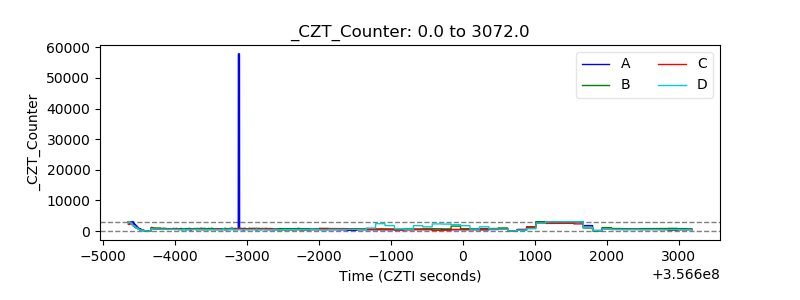 |
| +2.5 Volts monitor | 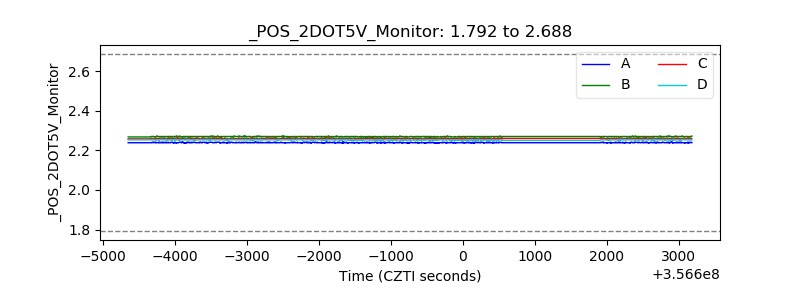 |
| +5 Volts monitor | 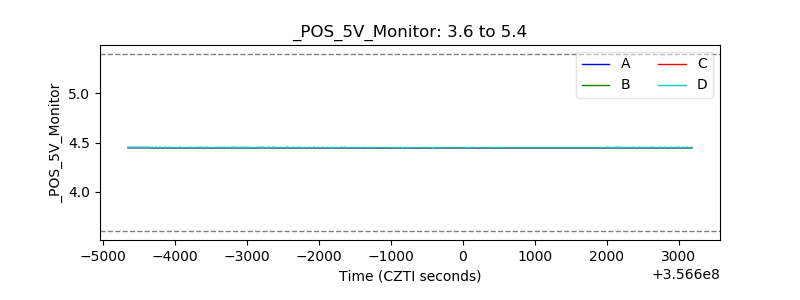 |
| _ROLL_ROT | 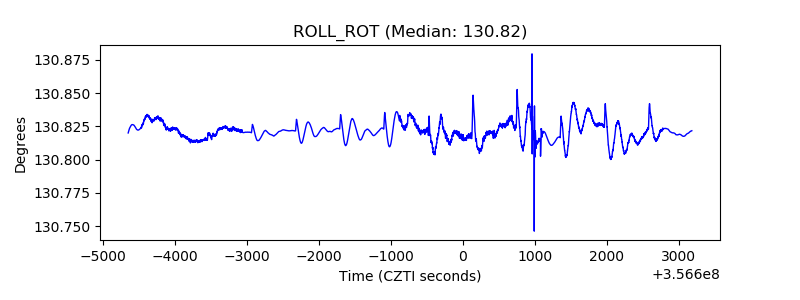 |
| _Roll_DEC | 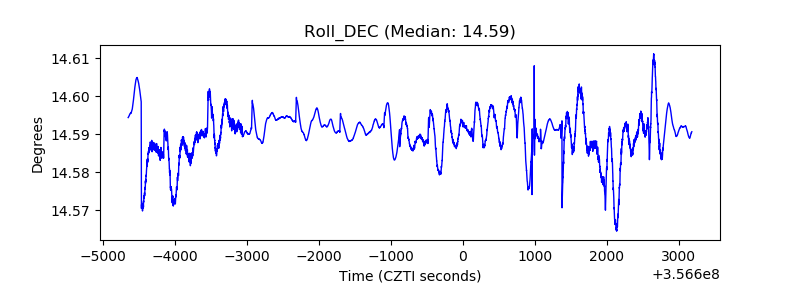 |
| _Roll_RA | 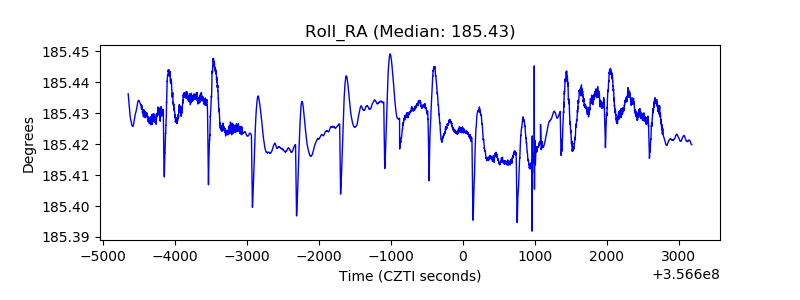 |
| Veto Counter |  |