| Param | Original file | Final file |
|---|---|---|
| Filename | modeM0/AS1A10_071T07_9000004322_30066cztM0_level2.evt | modeM0/AS1A10_071T07_9000004322_30066cztM0_level2_quad_clean.evt |
| Size (bytes) | 529,398,720 | 73,051,200 |
| Size | 504.9 MB | 69.7 MB |
| Events in quadrant A | 3,422,781 | 456,961 |
| Events in quadrant B | 5,103,959 | 454,775 |
| Events in quadrant C | 3,466,423 | 429,738 |
| Events in quadrant D | 3,607,326 | 425,302 |
| Mode M0 | |||
|---|---|---|---|
| Quadrant | BADHDUFLAG | Total packets | Discarded packets |
| A | 0 | 13703 | 2 |
| B | 0 | 19538 | 2 |
| C | 0 | 13900 | 2 |
| D | 0 | 14370 | 2 |
| Mode SS | |||
|---|---|---|---|
| Quadrant | BADHDUFLAG | Total packets | Discarded packets |
| A | 0 | 130 | 0 |
| B | 0 | 130 | 0 |
| C | 0 | 130 | 0 |
| D | 0 | 130 | 0 |
| Mode M9 | |||
|---|---|---|---|
| Quadrant | BADHDUFLAG | Total packets | Discarded packets |
| A | 0 | 14 | 0 |
| B | 0 | 15 | 0 |
| C | 0 | 15 | 0 |
| D | 0 | 15 | 0 |
| Quadrant | Total seconds | Saturated seconds | Saturation percentage |
|---|---|---|---|
| A | 6377 | 124 | 1.944488% |
| B | 6377 | 199 | 3.120590% |
| C | 6377 | 186 | 2.916732% |
| D | 6377 | 139 | 2.179708% |
Noise dominated data is calculated using 1-second bins in cleaned event files. If a bin has >2000 counts, and if more than 50% of those come from <1% of pixels, then it is considered to be noise-dominated and hence unusable.
| Quadrant | # 1 sec bins | Bins with >0 counts | Bins with >2000 counts | High rate bins dominated by noise | Noise dominated (total time) | Noise dominated (detector-on time) | Marked lightcurve |
|---|---|---|---|---|---|---|---|
| A | 7517 | 6378 | 2 | 2 | 0.03% | 0.03% | 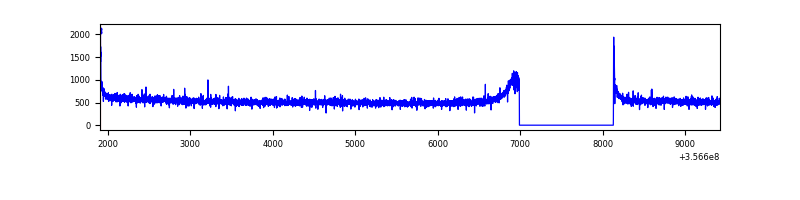 |
| B | 7517 | 6378 | 0 | 0 | 0.00% | 0.00% | 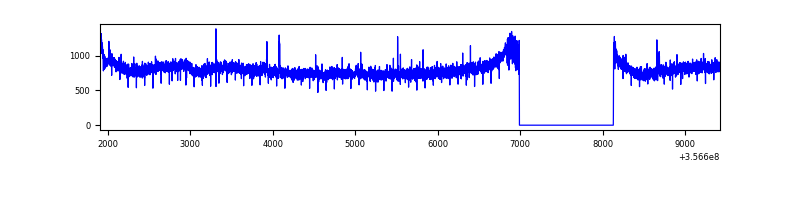 |
| C | 7517 | 6378 | 0 | 0 | 0.00% | 0.00% | 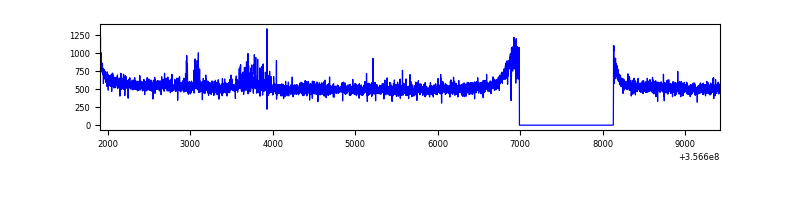 |
| D | 7517 | 6378 | 53 | 53 | 0.71% | 0.83% | 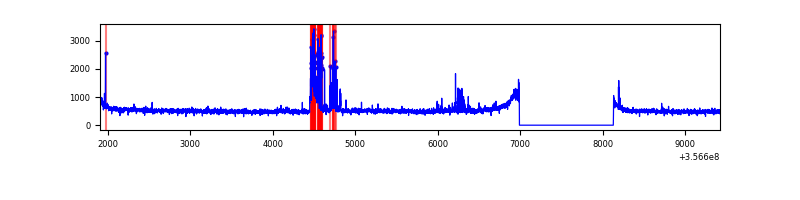 |
Top three noisy pixels from each quadrant. If the there are fewer than three noisy pixels in the level2.evt file, extra rows are filled as -1
| Pixel properties | Quadrant properties | ||||||
|---|---|---|---|---|---|---|---|
| Quadrant | DetID | PixID | Counts | Sigma | Mean | Median | Sigma |
| A | 8 | 192 | 24266 | 134.56 | 882 | 868 | 173.9 |
| A | 13 | 254 | 10774 | 56.97 | 882 | 868 | 173.9 |
| A | 3 | 137 | 8446 | 43.58 | 882 | 868 | 173.9 |
| B | 6 | 159 | 1694214 | 10257.25 | 863 | 842 | 165.1 |
| B | 12 | 111 | 20193 | 117.21 | 863 | 842 | 165.1 |
| B | 11 | 111 | 18649 | 107.86 | 863 | 842 | 165.1 |
| C | 14 | 238 | 164233 | 851.71 | 825 | 832 | 191.8 |
| C | 14 | 254 | 40668 | 207.64 | 825 | 832 | 191.8 |
| C | 3 | 233 | 18960 | 94.49 | 825 | 832 | 191.8 |
| D | 2 | 250 | 157288 | 786.15 | 833 | 815 | 199.0 |
| D | 13 | 104 | 115723 | 577.32 | 833 | 815 | 199.0 |
| D | 8 | 195 | 103307 | 514.94 | 833 | 815 | 199.0 |
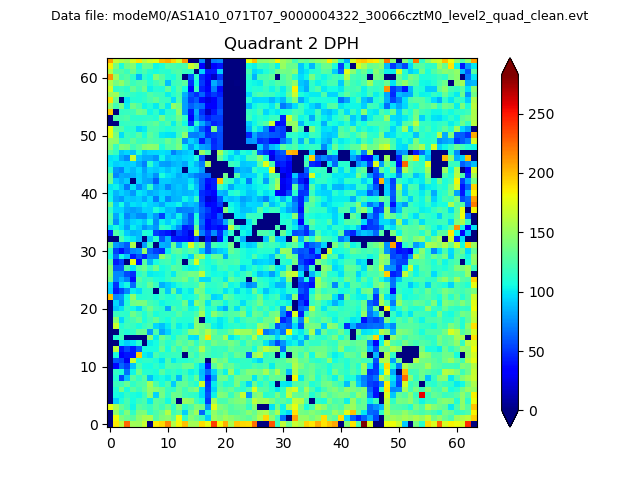
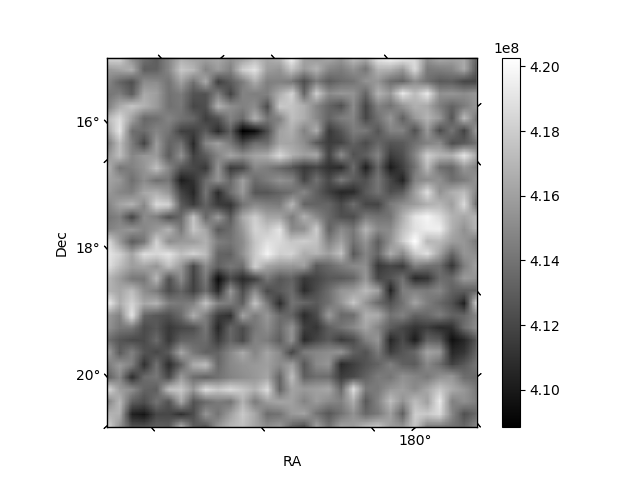
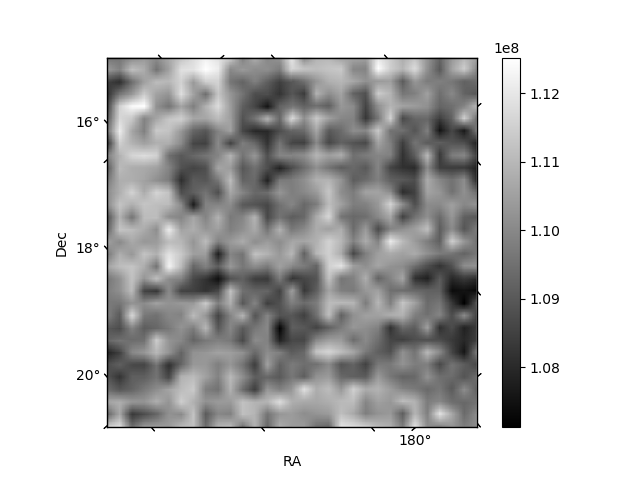
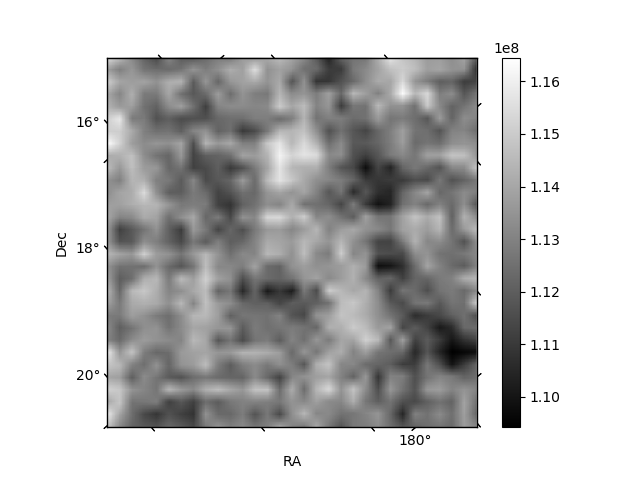
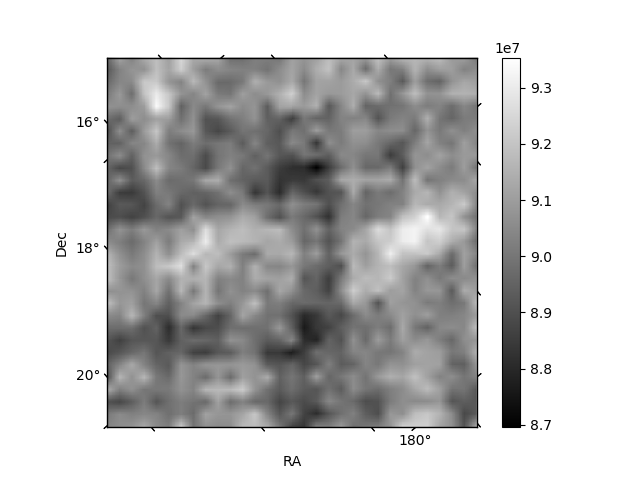
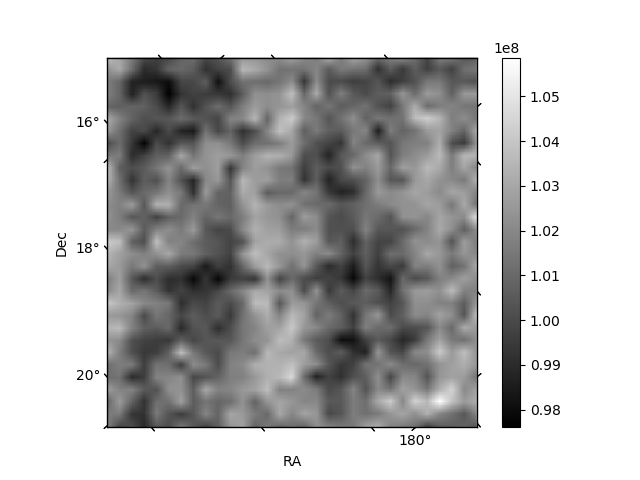
Histogram calculated using DETX and DETY for each event in the final _common_clean file
| Quadrant A | 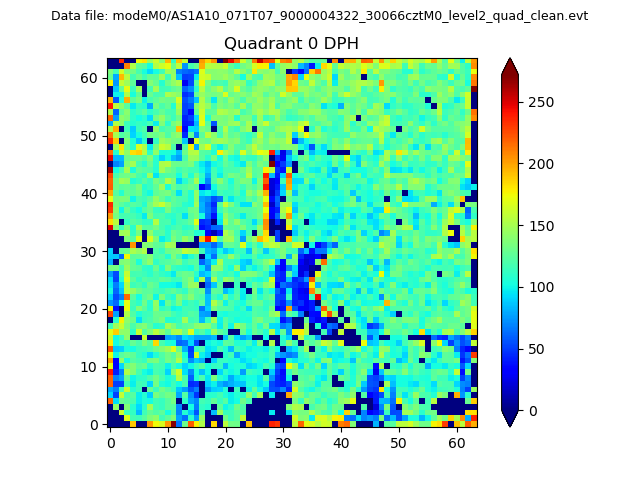 |
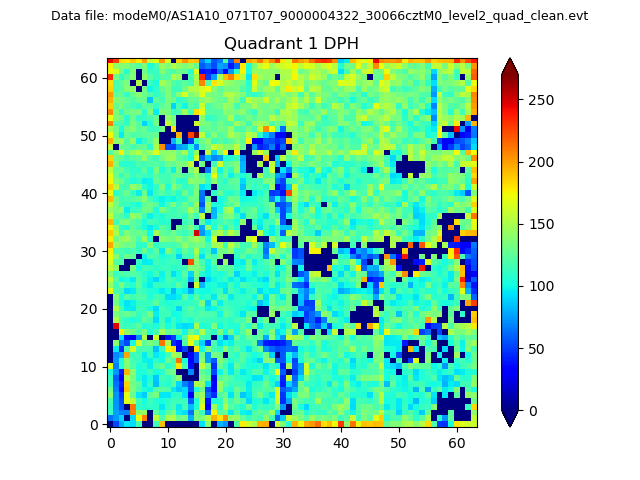 |
Quadrant B |
|---|---|---|---|
| Quadrant D | 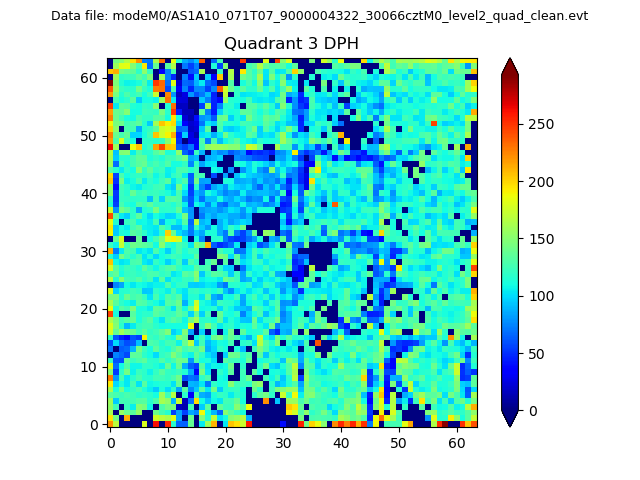 |
 |
Quadrant C |
| Plot type | Count rate plots | Images |
|---|---|---|
| Comparison with Poisson distribution Blue bars denote a histogram of data divided into 1 sec bins. Red curve is a Poisson curve with rate = median count rate of data. |
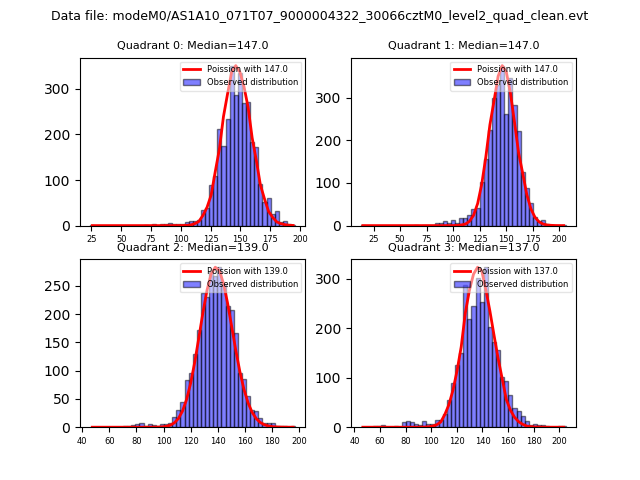 |
 |
| Quadrant-wise count rates Data is divided into 100 sec bins |
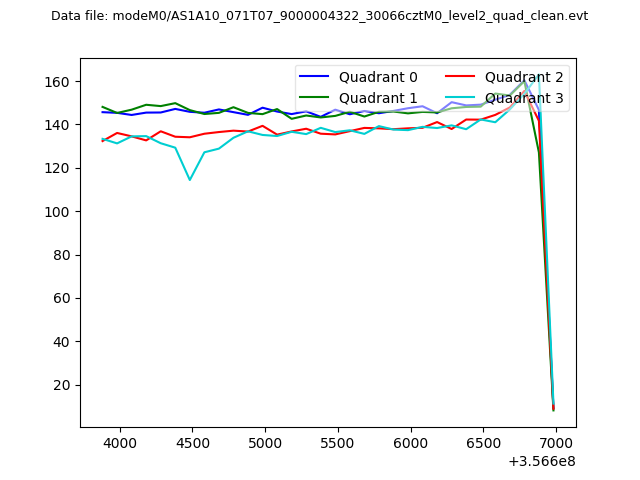 |
|
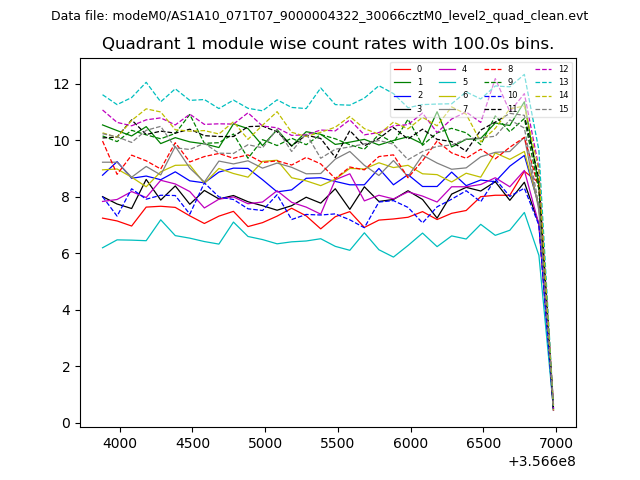
| Module-wise count rates for Quadrant A Data is divided into 100 sec bins |
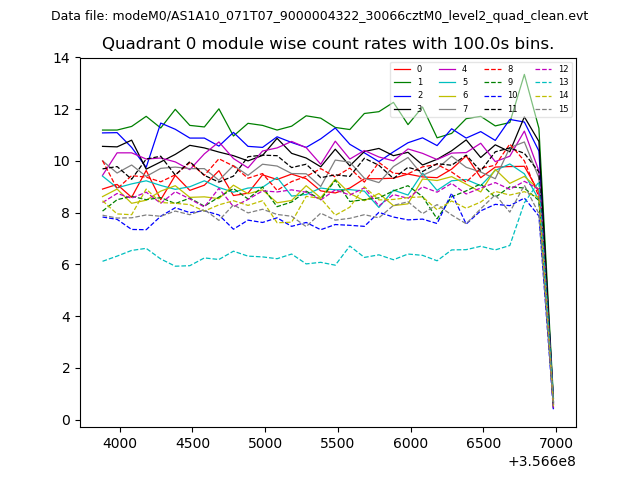 |
 |
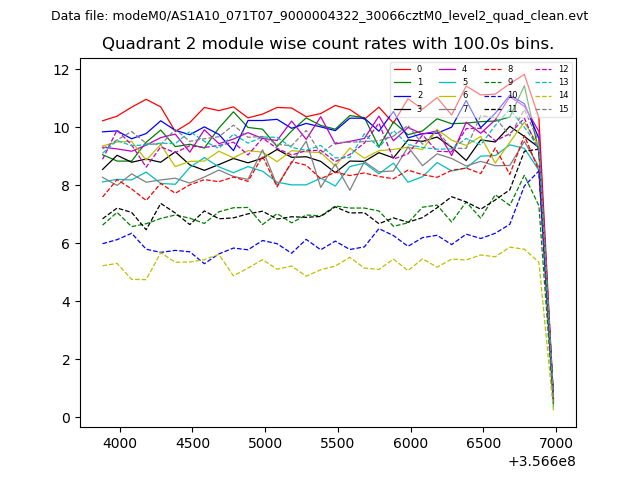
| Module-wise count rates for Quadrant B Data is divided into 100 sec bins |
 |
 |
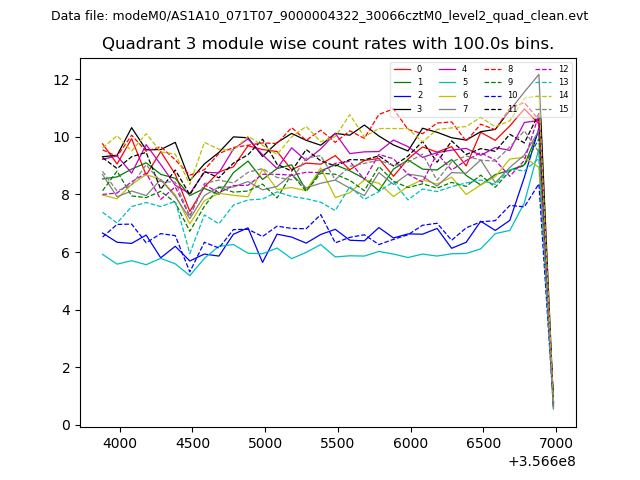
| Module-wise count rates for Quadrant C Data is divided into 100 sec bins |
 |
 |
| Module-wise count rates for Quadrant D Data is divided into 100 sec bins |
 |
 |
| Parameter | Plot |
|---|---|
| CZT HV Monitor | 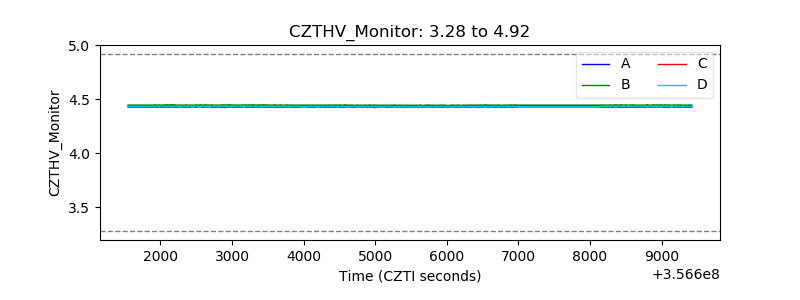 |
| D_VDD | 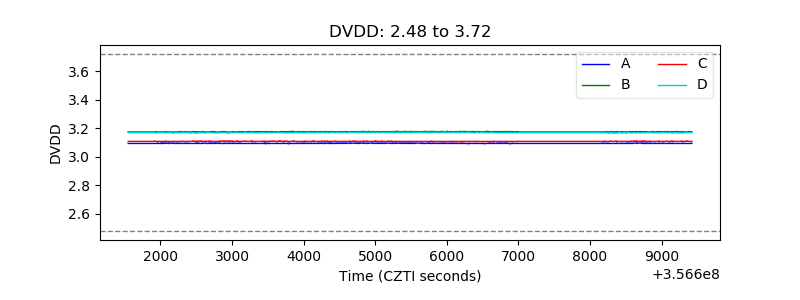 |
| Temperature 1 | 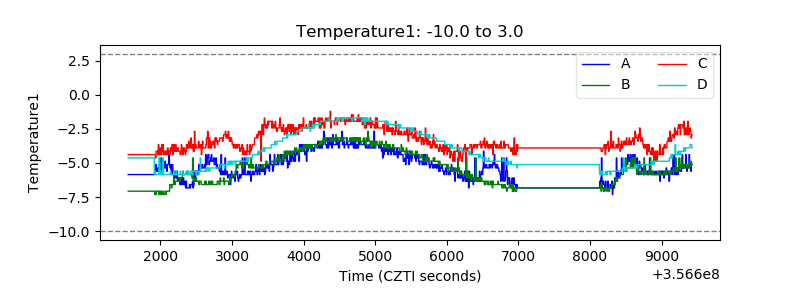 |
| Veto HV Monitor | 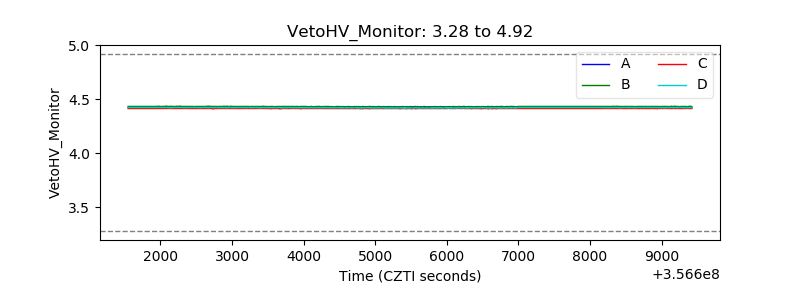 |
| Veto LLD | 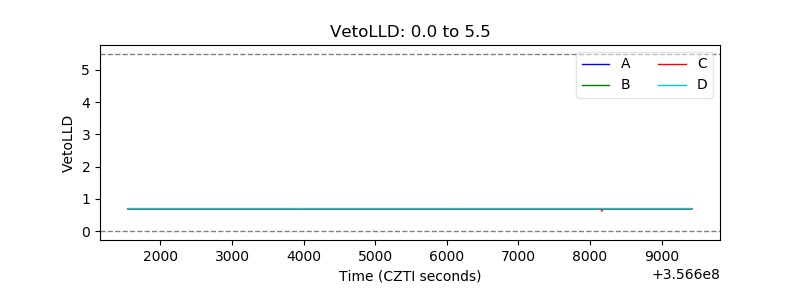 |
| Alpha Counter | 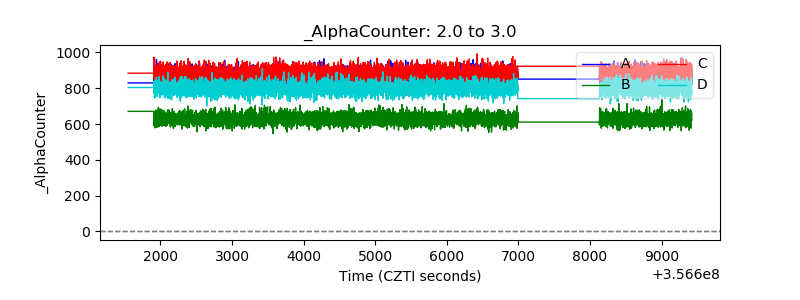 |
| _CPM_Rate | 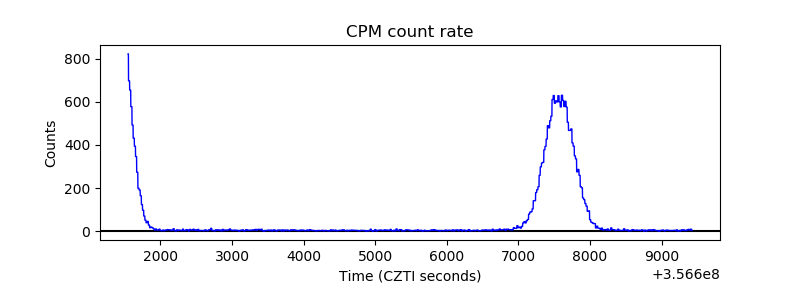 |
| CZT Counter | 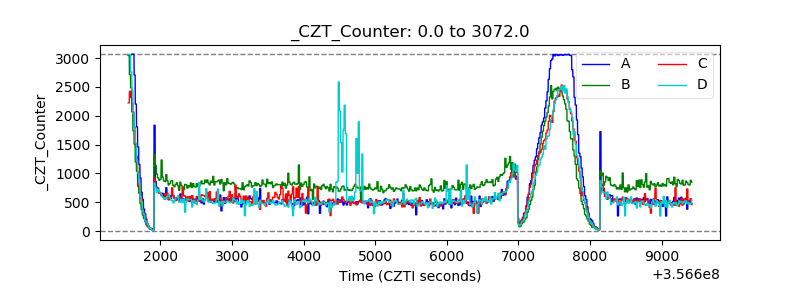 |
| +2.5 Volts monitor |  |
| +5 Volts monitor |  |
| _ROLL_ROT | 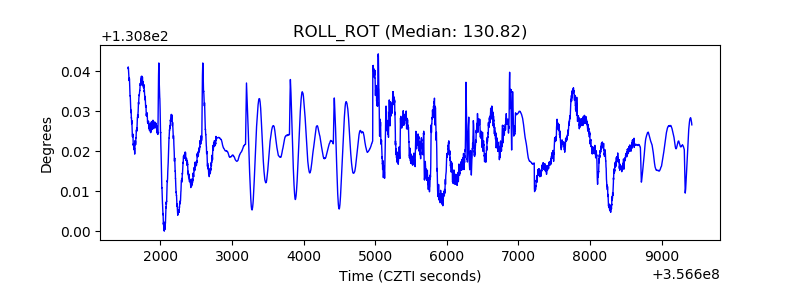 |
| _Roll_DEC | 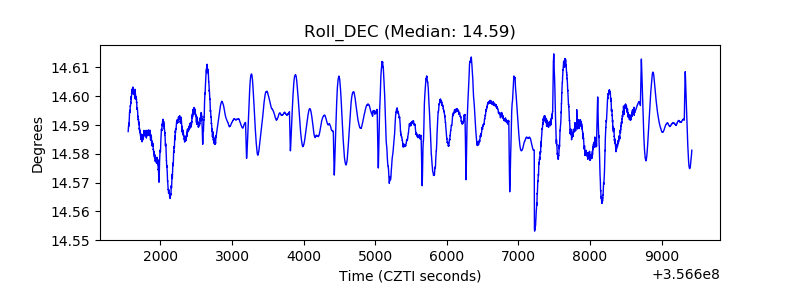 |
| _Roll_RA | 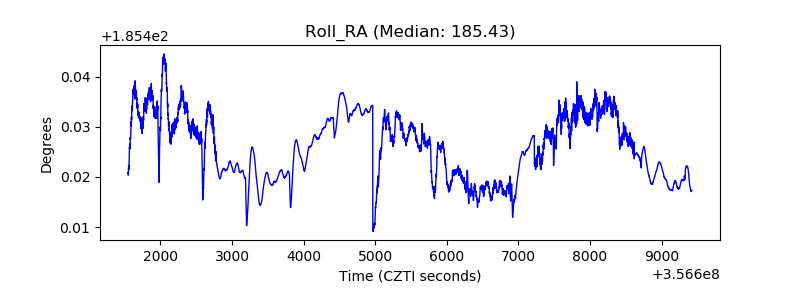 |
| Veto Counter | 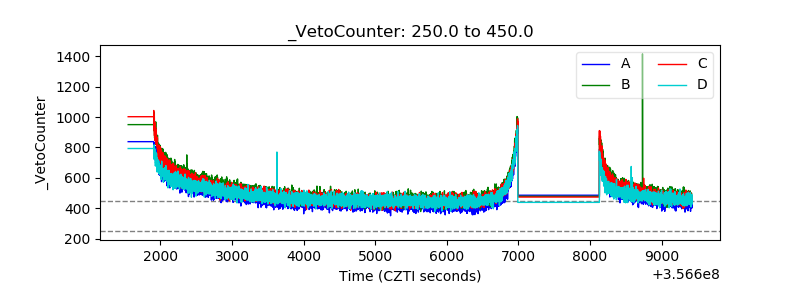 |