| Param | Original file | Final file |
|---|---|---|
| Filename | modeM0/AS1A10_071T07_9000004322_30067cztM0_level2.evt | modeM0/AS1A10_071T07_9000004322_30067cztM0_level2_quad_clean.evt |
| Size (bytes) | 306,532,800 | 47,761,920 |
| Size | 292.3 MB | 45.5 MB |
| Events in quadrant A | 1,981,916 | 303,973 |
| Events in quadrant B | 2,967,904 | 302,372 |
| Events in quadrant C | 1,971,714 | 287,550 |
| Events in quadrant D | 2,105,009 | 285,890 |
| Mode M0 | |||
|---|---|---|---|
| Quadrant | BADHDUFLAG | Total packets | Discarded packets |
| A | 0 | 8096 | 1 |
| B | 0 | 11607 | 1 |
| C | 0 | 8043 | 1 |
| D | 0 | 8551 | 1 |
| Mode SS | |||
|---|---|---|---|
| Quadrant | BADHDUFLAG | Total packets | Discarded packets |
| A | 0 | 78 | 0 |
| B | 0 | 78 | 0 |
| C | 0 | 78 | 0 |
| D | 0 | 78 | 0 |
| Mode M9 | |||
|---|---|---|---|
| Quadrant | BADHDUFLAG | Total packets | Discarded packets |
| A | 0 | 11 | 0 |
| B | 0 | 11 | 0 |
| C | 0 | 11 | 0 |
| D | 0 | 11 | 0 |
| Quadrant | Total seconds | Saturated seconds | Saturation percentage |
|---|---|---|---|
| A | 3763 | 110 | 2.923200% |
| B | 3763 | 171 | 4.544247% |
| C | 3763 | 124 | 3.295243% |
| D | 3764 | 84 | 2.231668% |
Noise dominated data is calculated using 1-second bins in cleaned event files. If a bin has >2000 counts, and if more than 50% of those come from <1% of pixels, then it is considered to be noise-dominated and hence unusable.
| Quadrant | # 1 sec bins | Bins with >0 counts | Bins with >2000 counts | High rate bins dominated by noise | Noise dominated (total time) | Noise dominated (detector-on time) | Marked lightcurve |
|---|---|---|---|---|---|---|---|
| A | 4903 | 3764 | 0 | 0 | 0.00% | 0.00% | 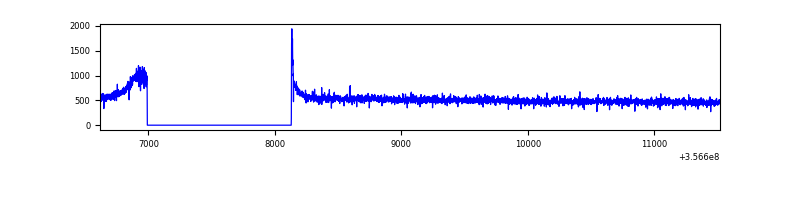 |
| B | 4903 | 3764 | 1 | 1 | 0.02% | 0.03% | 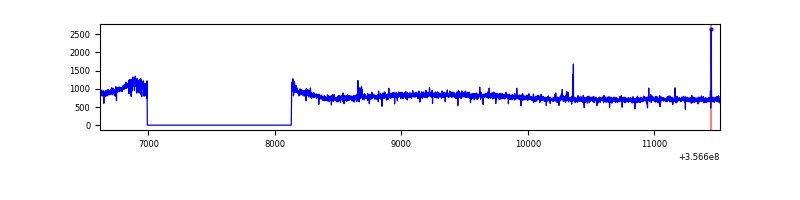 |
| C | 4903 | 3764 | 0 | 0 | 0.00% | 0.00% | 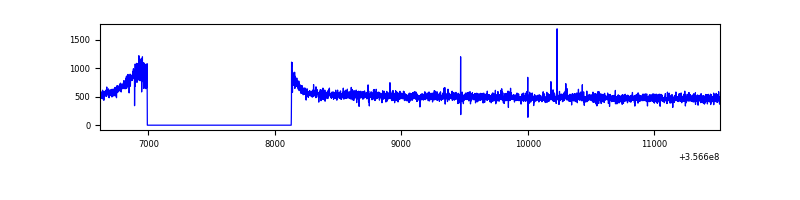 |
| D | 4904 | 3765 | 15 | 15 | 0.31% | 0.40% | 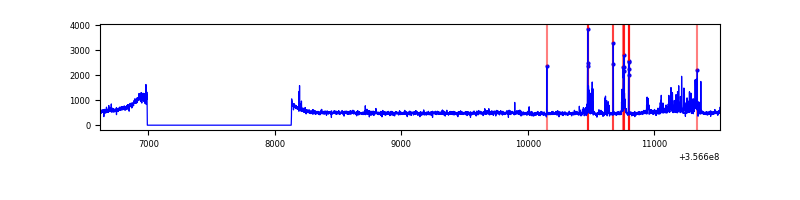 |
Top three noisy pixels from each quadrant. If the there are fewer than three noisy pixels in the level2.evt file, extra rows are filled as -1
| Pixel properties | Quadrant properties | ||||||
|---|---|---|---|---|---|---|---|
| Quadrant | DetID | PixID | Counts | Sigma | Mean | Median | Sigma |
| A | 8 | 192 | 12783 | 118.95 | 511 | 502 | 103.2 |
| A | 13 | 254 | 5645 | 49.82 | 511 | 502 | 103.2 |
| A | 3 | 137 | 5234 | 45.83 | 511 | 502 | 103.2 |
| B | 6 | 159 | 996648 | 10216.15 | 497 | 485 | 97.5 |
| B | 12 | 111 | 11966 | 117.74 | 497 | 485 | 97.5 |
| B | 11 | 111 | 11019 | 108.03 | 497 | 485 | 97.5 |
| C | 14 | 238 | 77635 | 675.74 | 480 | 483 | 114.2 |
| C | 2 | 114 | 8887 | 73.61 | 480 | 483 | 114.2 |
| C | 3 | 233 | 8319 | 68.63 | 480 | 483 | 114.2 |
| D | 13 | 104 | 106060 | 896.62 | 489 | 478 | 117.8 |
| D | 8 | 195 | 67310 | 567.55 | 489 | 478 | 117.8 |
| D | 2 | 250 | 48490 | 407.72 | 489 | 478 | 117.8 |
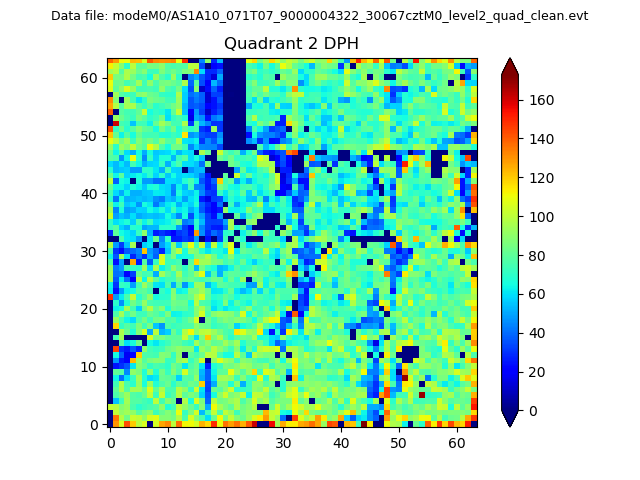
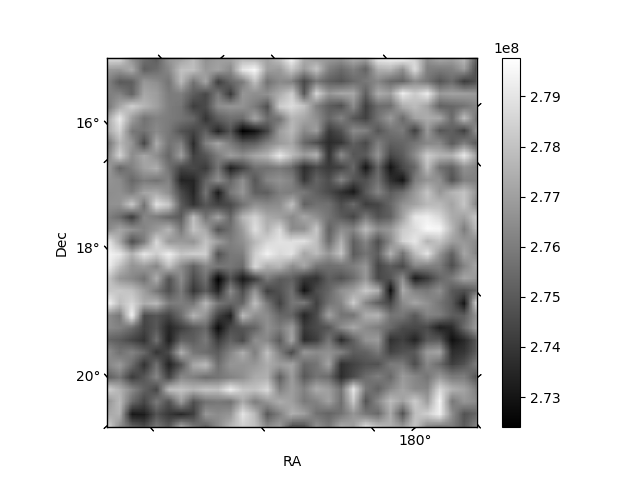
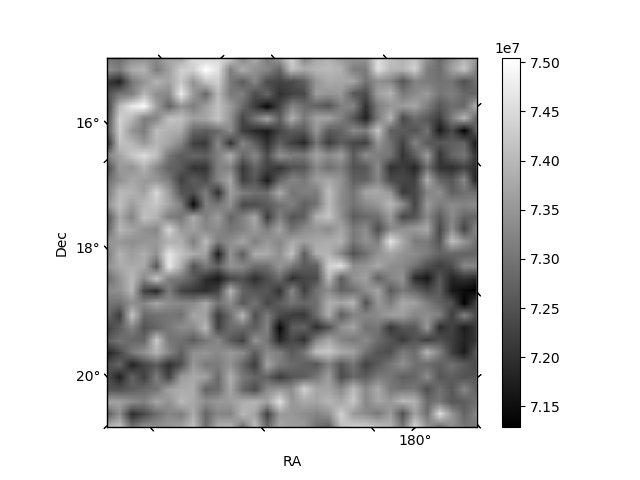
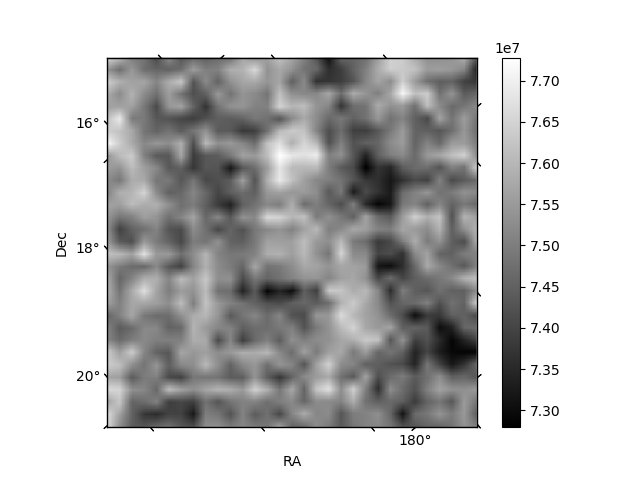
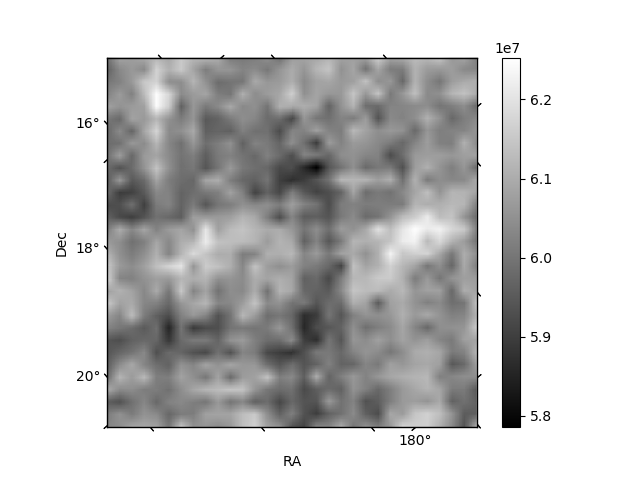
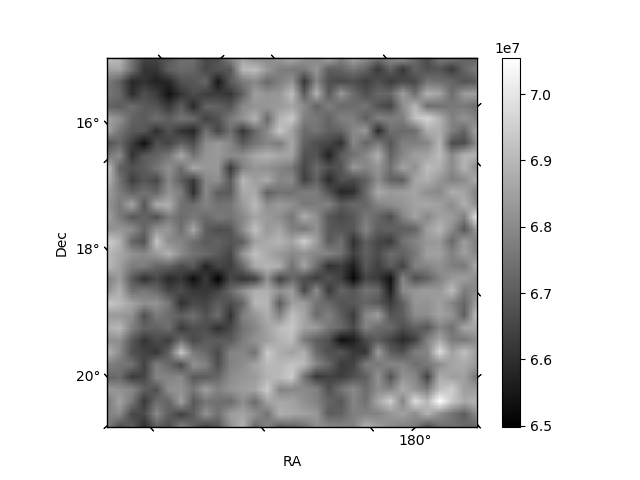
Histogram calculated using DETX and DETY for each event in the final _common_clean file
| Quadrant A | 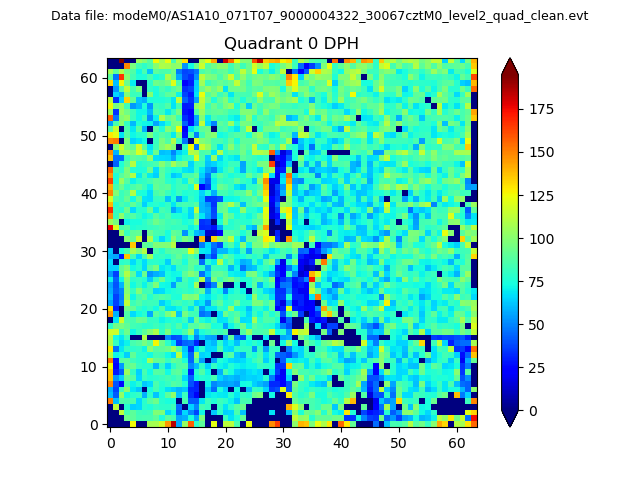 |
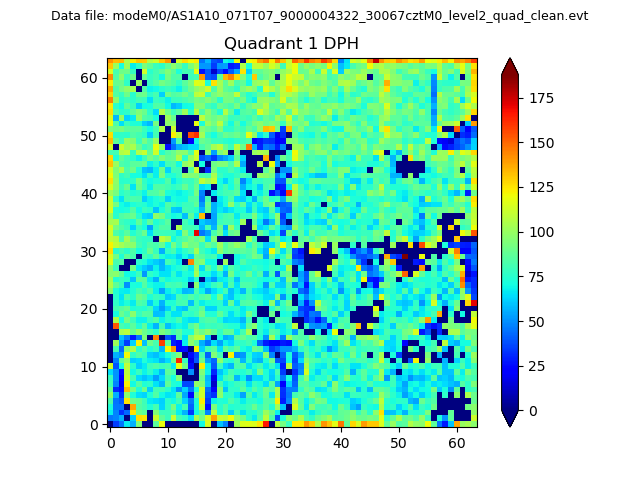 |
Quadrant B |
|---|---|---|---|
| Quadrant D | 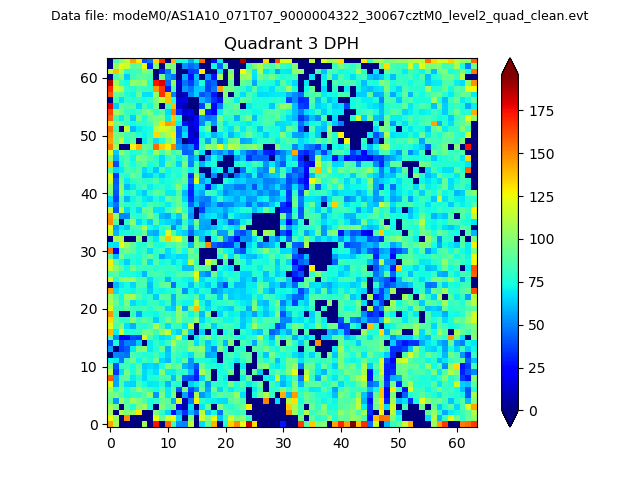 |
 |
Quadrant C |
| Plot type | Count rate plots | Images |
|---|---|---|
| Comparison with Poisson distribution Blue bars denote a histogram of data divided into 1 sec bins. Red curve is a Poisson curve with rate = median count rate of data. |
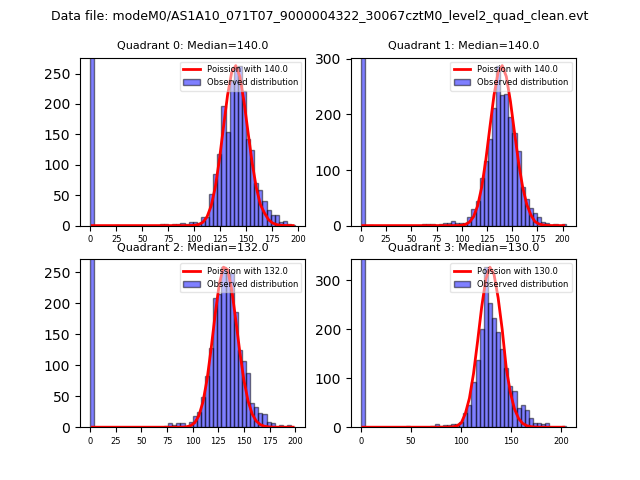 |
 |
| Quadrant-wise count rates Data is divided into 100 sec bins |
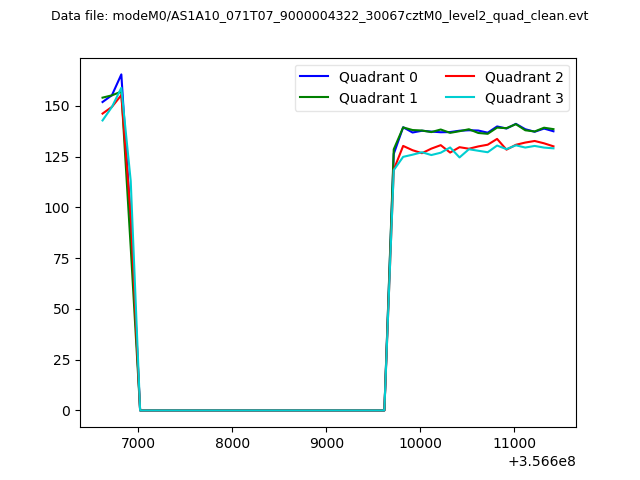 |
|
| Module-wise count rates for Quadrant A Data is divided into 100 sec bins |
 |
 |
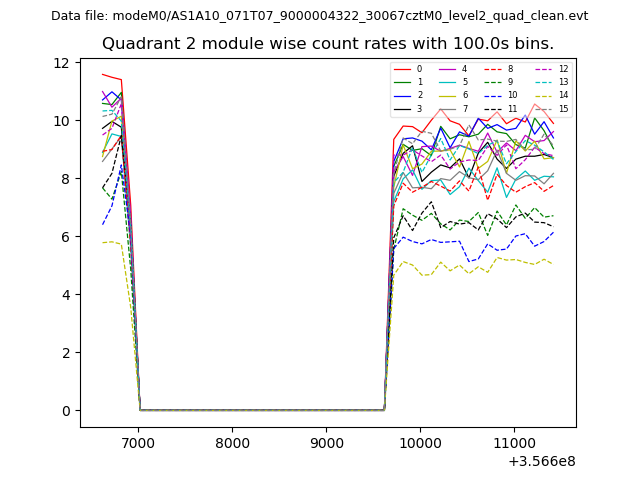
| Module-wise count rates for Quadrant B Data is divided into 100 sec bins |
 |
 |
| Module-wise count rates for Quadrant C Data is divided into 100 sec bins |
 |
 |
| Module-wise count rates for Quadrant D Data is divided into 100 sec bins |
 |
 |
| Parameter | Plot |
|---|---|
| CZT HV Monitor | 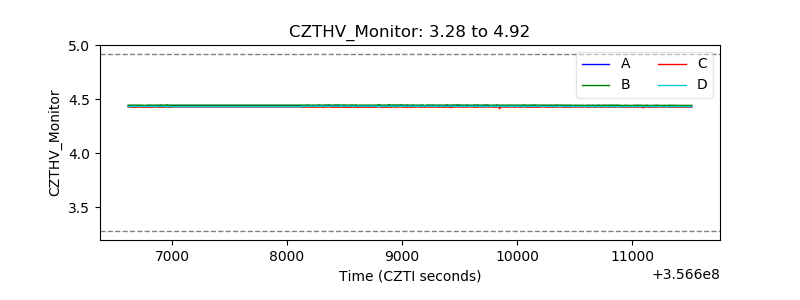 |
| D_VDD | 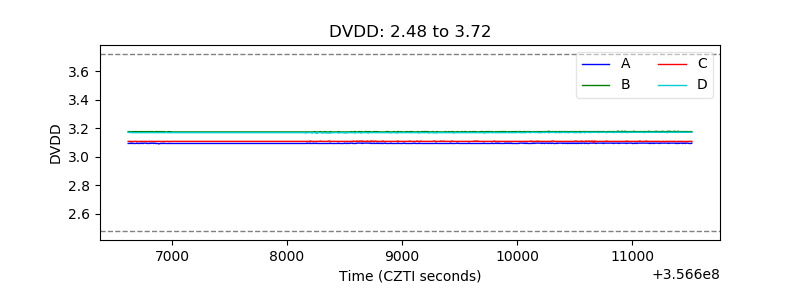 |
| Temperature 1 | 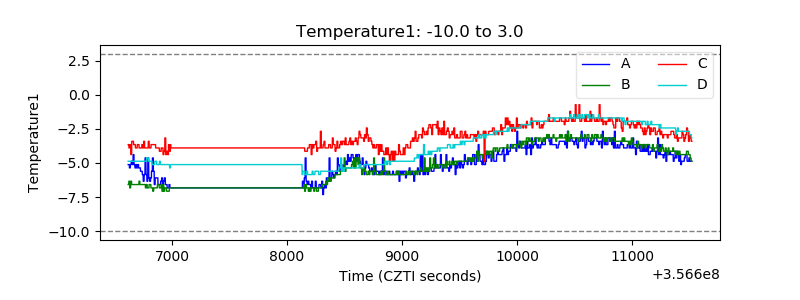 |
| Veto HV Monitor | 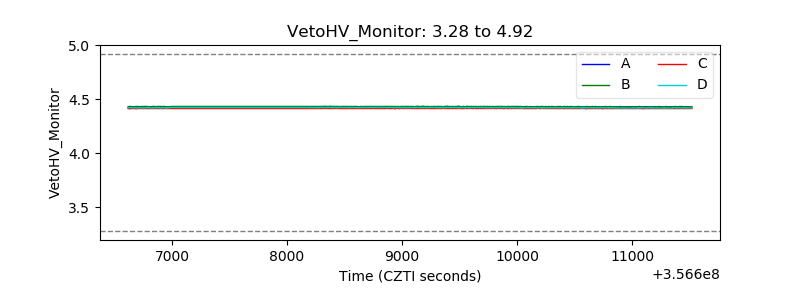 |
| Veto LLD | 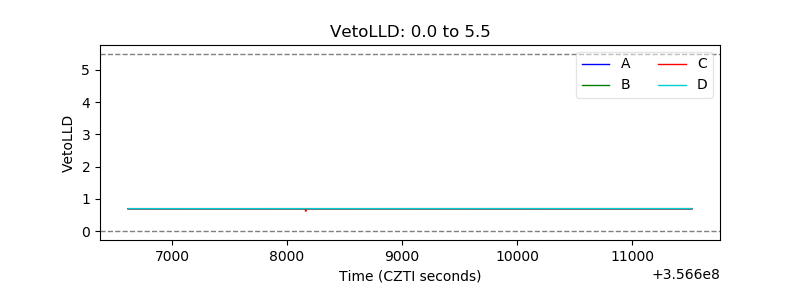 |
| Alpha Counter | 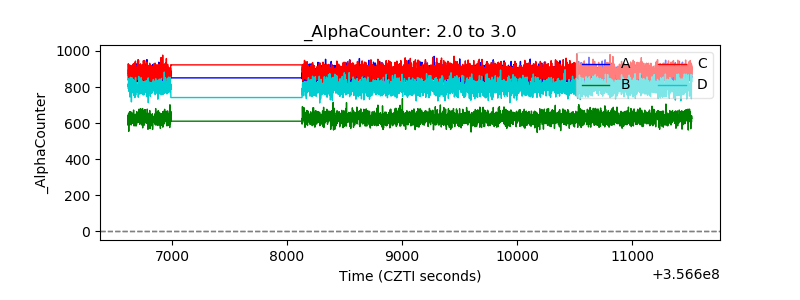 |
| _CPM_Rate | 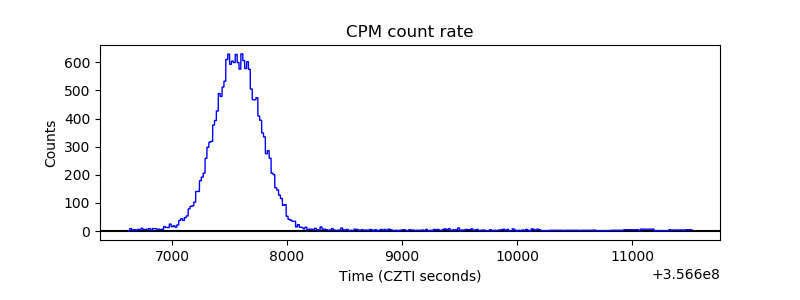 |
| CZT Counter | 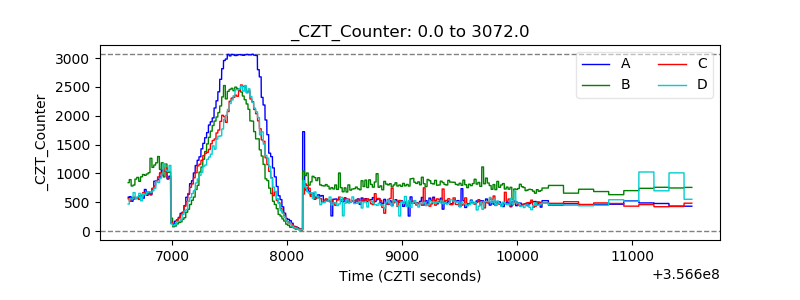 |
| +2.5 Volts monitor | 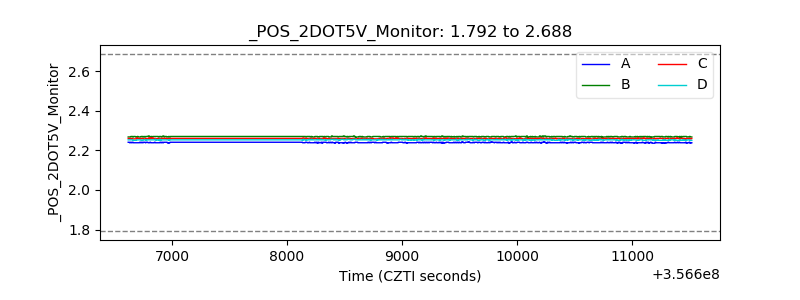 |
| +5 Volts monitor |  |
| _ROLL_ROT |  |
| _Roll_DEC |  |
| _Roll_RA | 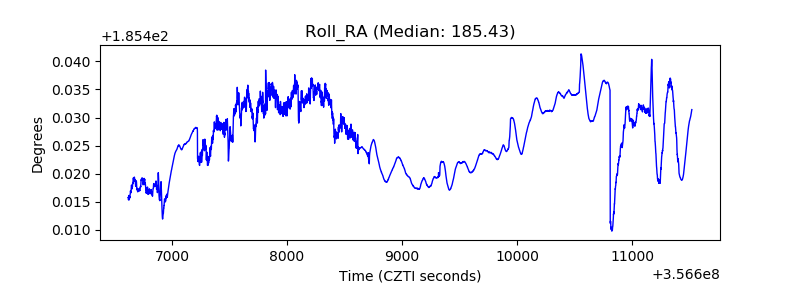 |
| Veto Counter | 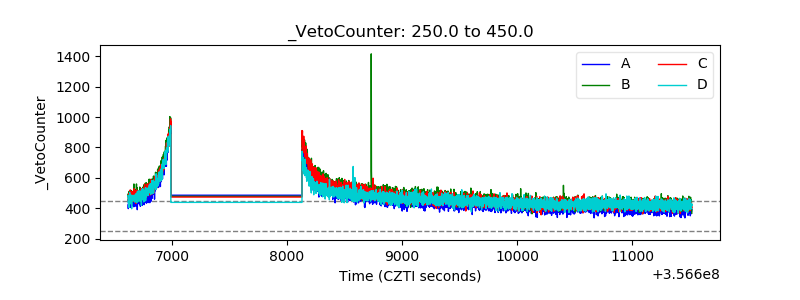 |