| Param | Original file | Final file |
|---|---|---|
| Filename | modeM0/AS1A10_071T06_9000004324cztM0_level2.fits | modeM0/AS1A10_071T06_9000004324cztM0_level2_quad_clean.evt |
| Size (bytes) | 363,456,000 | 352,569,600 |
| Size | 346.6 MB | 336.2 MB |
| Events in quadrant A | 2,257,984 | 2,181,352 |
| Events in quadrant B | 2,120,198 | 2,140,407 |
| Events in quadrant C | 2,164,524 | 2,029,040 |
| Events in quadrant D | 1,855,474 | 1,719,204 |
| Mode SS | |||
|---|---|---|---|
| Quadrant | BADHDUFLAG | Total packets | Discarded packets |
| A | 0 | 772 | 0 |
| B | 0 | 772 | 0 |
| C | 0 | 772 | 0 |
| D | 0 | 772 | 0 |
| Mode M0 | |||
|---|---|---|---|
| Quadrant | BADHDUFLAG | Total packets | Discarded packets |
| A | 0 | 78986 | 0 |
| B | 0 | 115156 | 0 |
| C | 0 | 79716 | 0 |
| D | 0 | 98115 | 0 |
| Mode M9 | |||
|---|---|---|---|
| Quadrant | BADHDUFLAG | Total packets | Discarded packets |
| A | 0 | 36 | 0 |
| B | 0 | 36 | 0 |
| C | 0 | 36 | 0 |
| D | 0 | 36 | 0 |
| Quadrant | Total seconds | Saturated seconds | Saturation percentage |
|---|---|---|---|
| A | 37971 | 774 | 2.038398% |
| B | 37971 | 1279 | 3.368360% |
| C | 37971 | 1099 | 2.894314% |
| D | 37971 | 2799 | 7.371415% |
Noise dominated data is calculated using 1-second bins in cleaned event files. If a bin has >2000 counts, and if more than 50% of those come from <1% of pixels, then it is considered to be noise-dominated and hence unusable.
| Quadrant | # 1 sec bins | Bins with >0 counts | Bins with >2000 counts | High rate bins dominated by noise | Noise dominated (total time) | Noise dominated (detector-on time) | Marked lightcurve |
|---|---|---|---|---|---|---|---|
| A | 41531 | 37972 | 0 | 0 | 0.00% | 0.00% | 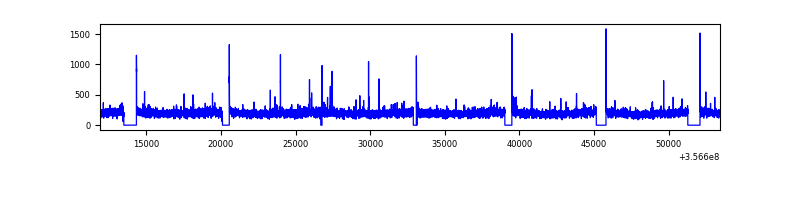 |
| B | 41531 | 37971 | 0 | 0 | 0.00% | 0.00% | 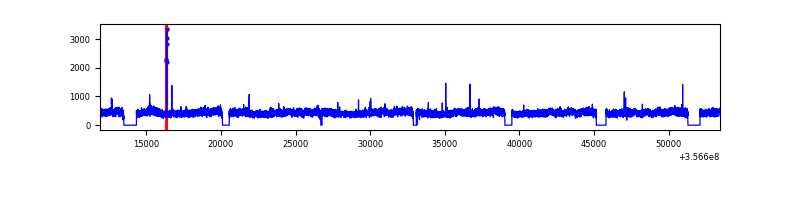 |
| C | 41531 | 37971 | 0 | 0 | 0.00% | 0.00% |  |
| D | 41531 | 37758 | 0 | 0 | 0.00% | 0.00% |  |
Top three noisy pixels from each quadrant. If the there are fewer than three noisy pixels in the level2.evt file, extra rows are filled as -1
| Pixel properties | Quadrant properties | ||||||
|---|---|---|---|---|---|---|---|
| Quadrant | DetID | PixID | Counts | Sigma | Mean | Median | Sigma |
| A | 0 | 29 | 2178 | 11.06 | 588 | 549 | 147.3 |
| A | 7 | 110 | 1764 | 8.25 | 588 | 549 | 147.3 |
| A | 0 | 30 | 1700 | 7.81 | 588 | 549 | 147.3 |
| B | 2 | 9 | 1682 | 9.91 | 559 | 531 | 116.1 |
| B | 5 | 232 | 1453 | 7.94 | 559 | 531 | 116.1 |
| B | 3 | 17 | 1442 | 7.85 | 559 | 531 | 116.1 |
| C | 9 | 233 | 1489 | 6.5 | 572 | 532 | 147.1 |
| C | 12 | 241 | 1466 | 6.35 | 572 | 532 | 147.1 |
| C | 9 | 209 | 1443 | 6.19 | 572 | 532 | 147.1 |
| D | 15 | 46 | 1396 | 6.4 | 529 | 480 | 143.2 |
| D | 10 | 189 | 1298 | 5.71 | 529 | 480 | 143.2 |
| D | 6 | 67 | 1284 | 5.61 | 529 | 480 | 143.2 |
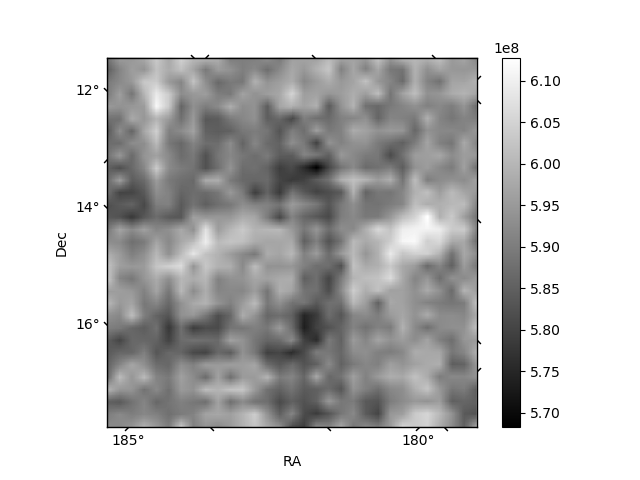
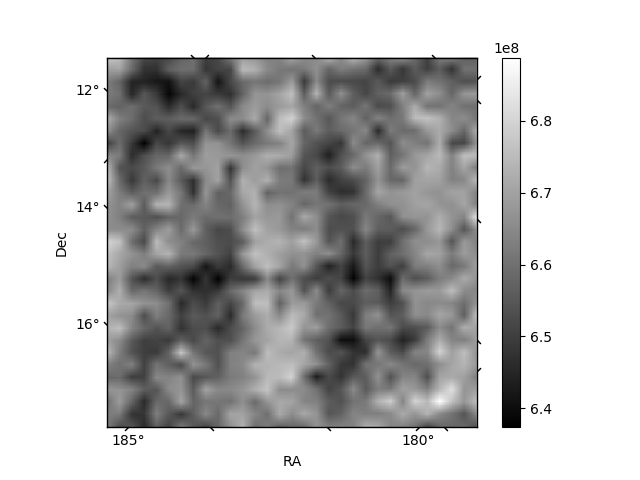
Histogram calculated using DETX and DETY for each event in the final _common_clean file
| Quadrant A | 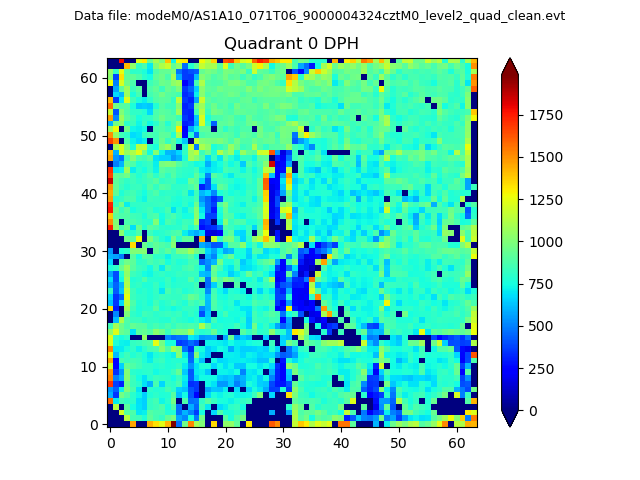 |
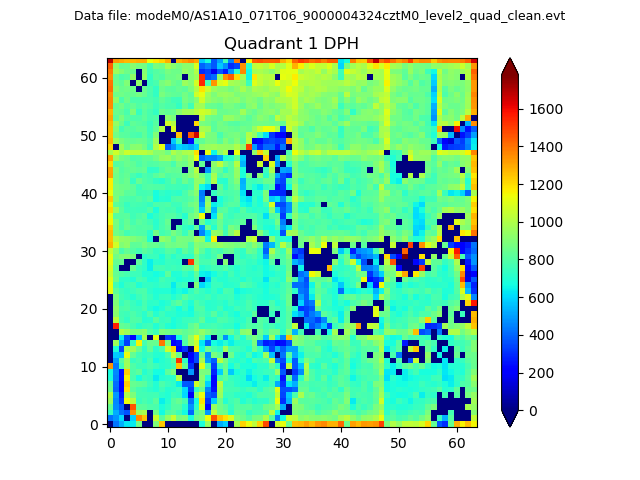 |
Quadrant B |
|---|---|---|---|
| Quadrant D |  |
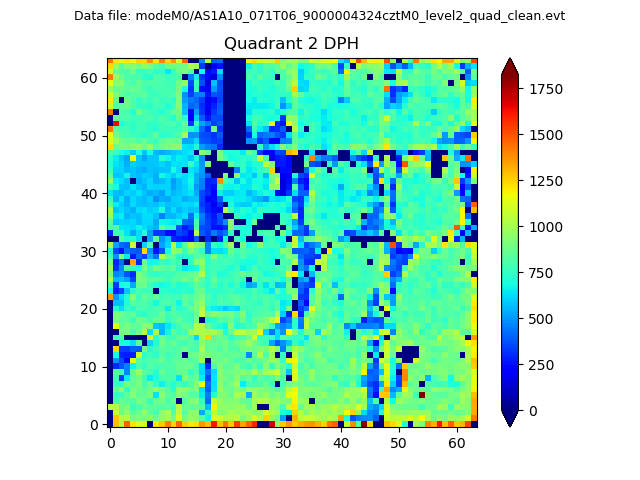 |
Quadrant C |
| Plot type | Count rate plots | Images |
|---|---|---|
| Comparison with Poisson distribution Blue bars denote a histogram of data divided into 1 sec bins. Red curve is a Poisson curve with rate = median count rate of data. |
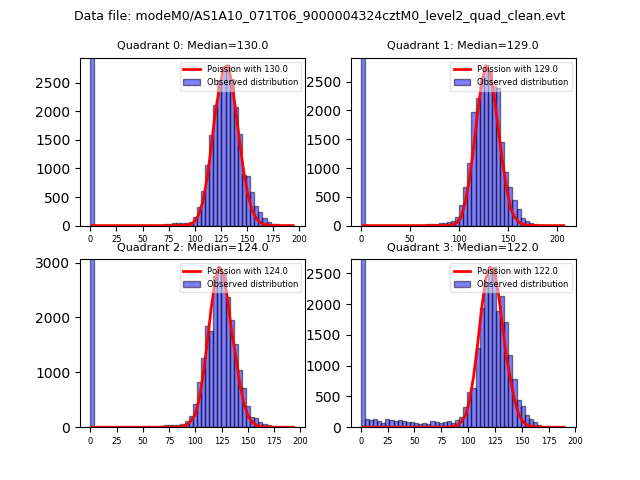 |
 |
| Quadrant-wise count rates Data is divided into 100 sec bins |
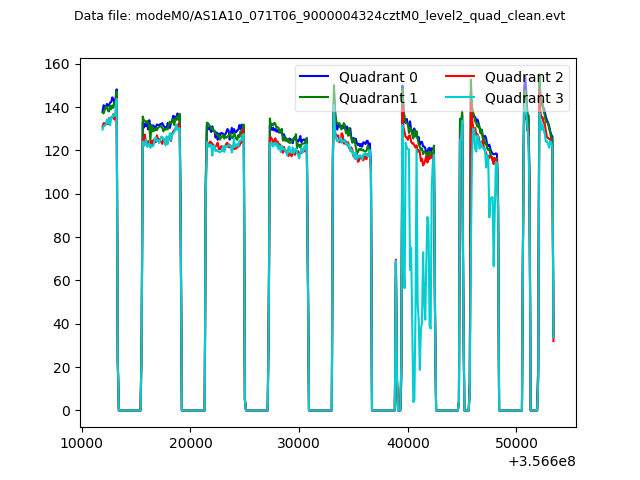 |
|
| Module-wise count rates for Quadrant A Data is divided into 100 sec bins |
 |
 |
| Module-wise count rates for Quadrant B Data is divided into 100 sec bins |
 |
 |
| Module-wise count rates for Quadrant C Data is divided into 100 sec bins |
 |
 |
| Module-wise count rates for Quadrant D Data is divided into 100 sec bins |
 |
 |
| Parameter | Plot |
|---|---|
| CZT HV Monitor |  |
| D_VDD | 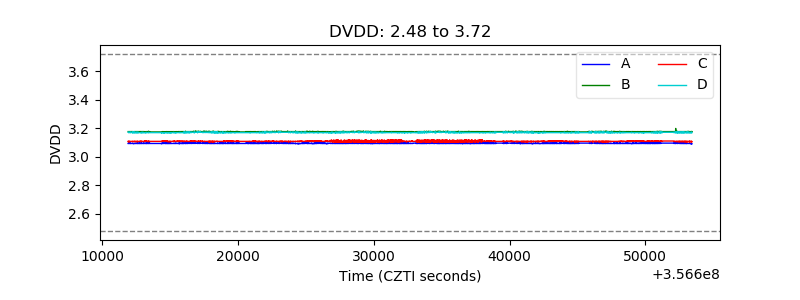 |
| Temperature 1 |  |
| Veto HV Monitor |  |
| Veto LLD |  |
| Alpha Counter |  |
| _CPM_Rate |  |
| CZT Counter |  |
| +2.5 Volts monitor |  |
| +5 Volts monitor |  |
| _ROLL_ROT | 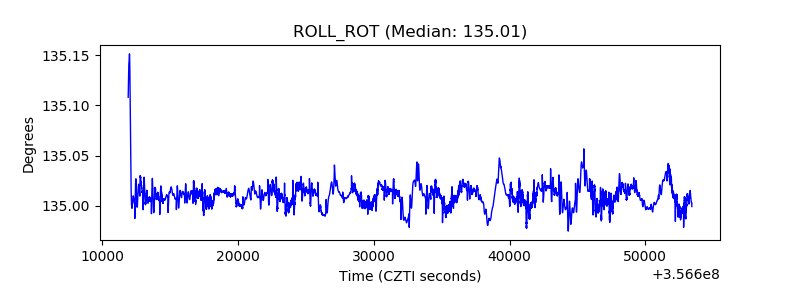 |
| _Roll_DEC | 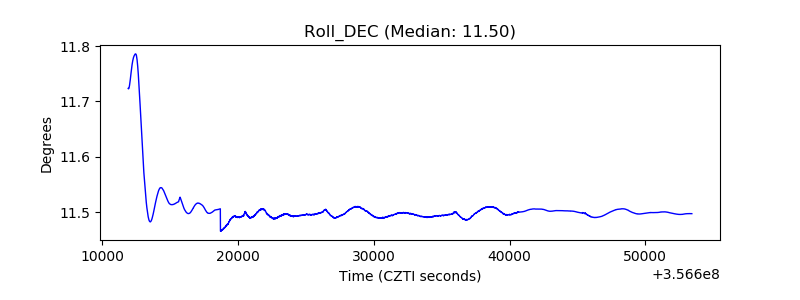 |
| _Roll_RA |  |
| Veto Counter |  |