| Param | Original file | Final file |
|---|---|---|
| Filename | modeM0/AS1A10_071T06_9000004324_30067cztM0_level2.evt | modeM0/AS1A10_071T06_9000004324_30067cztM0_level2_quad_clean.evt |
| Size (bytes) | 259,295,040 | 39,490,560 |
| Size | 247.3 MB | 37.7 MB |
| Events in quadrant A | 1,668,037 | 249,341 |
| Events in quadrant B | 2,602,597 | 247,216 |
| Events in quadrant C | 1,677,257 | 236,094 |
| Events in quadrant D | 1,686,415 | 235,641 |
| Mode SS | |||
|---|---|---|---|
| Quadrant | BADHDUFLAG | Total packets | Discarded packets |
| A | 0 | 66 | 0 |
| B | 0 | 66 | 0 |
| C | 0 | 66 | 0 |
| D | 0 | 66 | 0 |
| Mode M0 | |||
|---|---|---|---|
| Quadrant | BADHDUFLAG | Total packets | Discarded packets |
| A | 0 | 6824 | 1 |
| B | 0 | 9819 | 1 |
| C | 0 | 6819 | 1 |
| D | 0 | 6943 | 1 |
| Mode M9 | |||
|---|---|---|---|
| Quadrant | BADHDUFLAG | Total packets | Discarded packets |
| A | 0 | 8 | 0 |
| B | 0 | 8 | 0 |
| C | 0 | 8 | 0 |
| D | 0 | 8 | 0 |
| Quadrant | Total seconds | Saturated seconds | Saturation percentage |
|---|---|---|---|
| A | 3193 | 130 | 4.071406% |
| B | 3193 | 188 | 5.887880% |
| C | 3193 | 152 | 4.760413% |
| D | 3193 | 94 | 2.943940% |
Noise dominated data is calculated using 1-second bins in cleaned event files. If a bin has >2000 counts, and if more than 50% of those come from <1% of pixels, then it is considered to be noise-dominated and hence unusable.
| Quadrant | # 1 sec bins | Bins with >0 counts | Bins with >2000 counts | High rate bins dominated by noise | Noise dominated (total time) | Noise dominated (detector-on time) | Marked lightcurve |
|---|---|---|---|---|---|---|---|
| A | 4038 | 3194 | 0 | 0 | 0.00% | 0.00% | 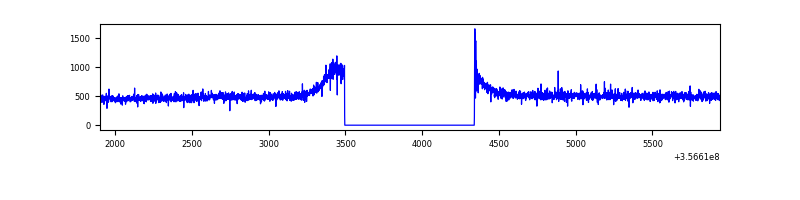 |
| B | 4038 | 3194 | 0 | 0 | 0.00% | 0.00% | 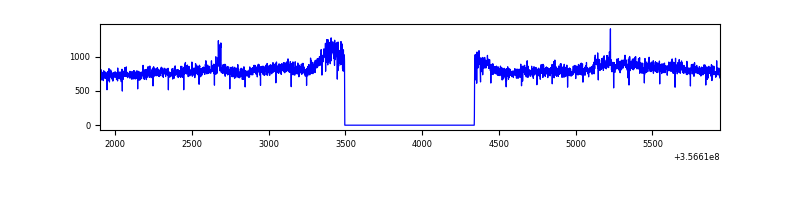 |
| C | 4038 | 3194 | 0 | 0 | 0.00% | 0.00% | 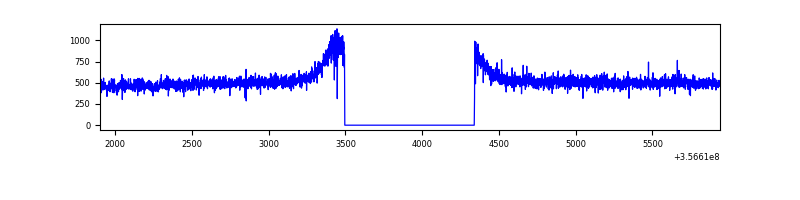 |
| D | 4038 | 3194 | 4 | 4 | 0.10% | 0.13% |  |
Top three noisy pixels from each quadrant. If the there are fewer than three noisy pixels in the level2.evt file, extra rows are filled as -1
| Pixel properties | Quadrant properties | ||||||
|---|---|---|---|---|---|---|---|
| Quadrant | DetID | PixID | Counts | Sigma | Mean | Median | Sigma |
| A | 8 | 192 | 9145 | 98.42 | 430 | 421 | 88.6 |
| A | 13 | 254 | 5050 | 52.22 | 430 | 421 | 88.6 |
| A | 3 | 137 | 4594 | 47.08 | 430 | 421 | 88.6 |
| B | 6 | 159 | 914900 | 10866.31 | 420 | 409 | 84.2 |
| B | 0 | 229 | 36474 | 428.54 | 420 | 409 | 84.2 |
| B | 12 | 111 | 10454 | 119.36 | 420 | 409 | 84.2 |
| C | 14 | 238 | 65285 | 660.14 | 408 | 410 | 98.3 |
| C | 3 | 233 | 7917 | 76.39 | 408 | 410 | 98.3 |
| C | 2 | 114 | 7729 | 74.48 | 408 | 410 | 98.3 |
| D | 8 | 195 | 68287 | 676.62 | 413 | 403 | 100.3 |
| D | 13 | 104 | 22080 | 216.06 | 413 | 403 | 100.3 |
| D | 2 | 250 | 16466 | 160.1 | 413 | 403 | 100.3 |
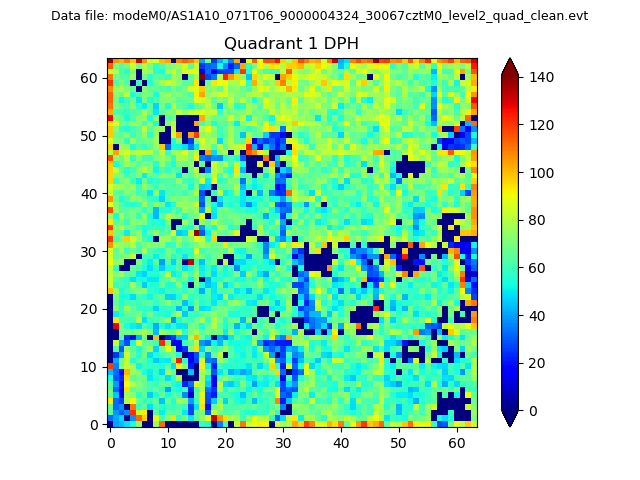
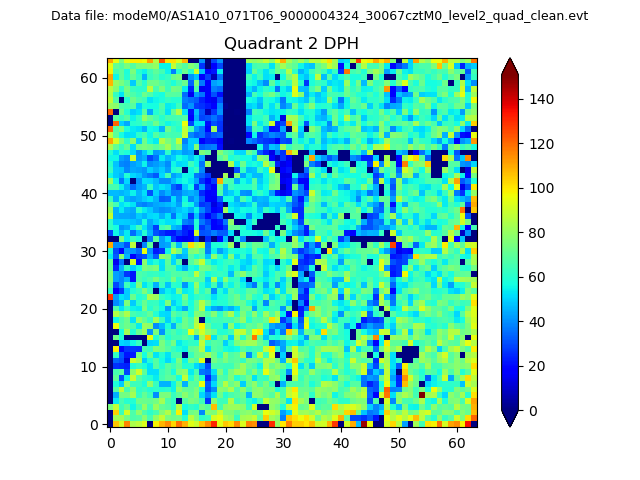
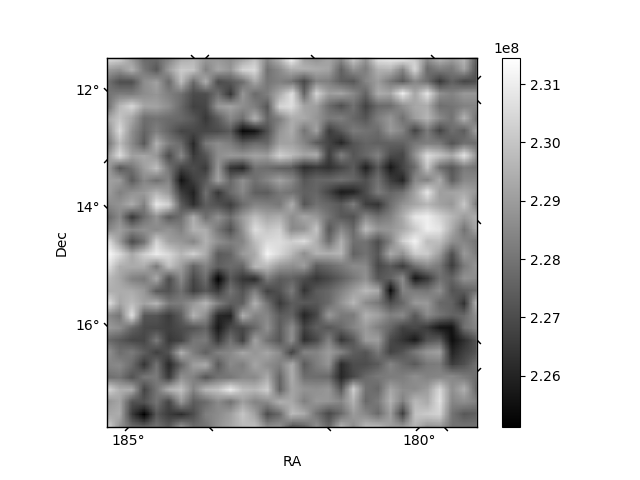
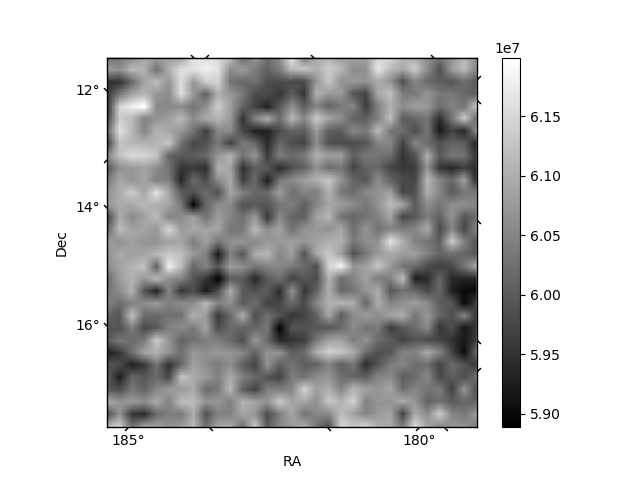
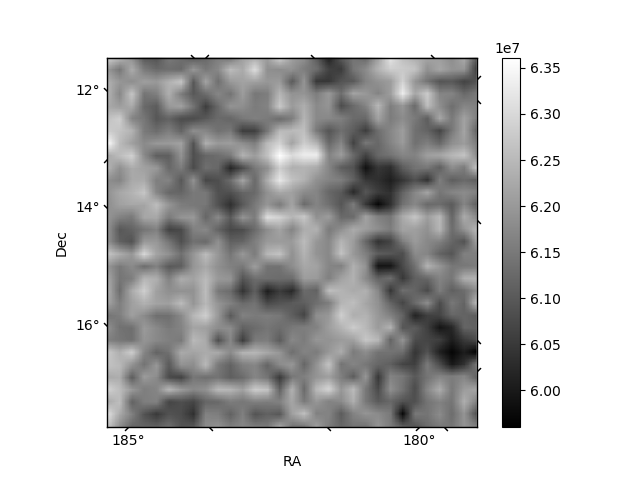
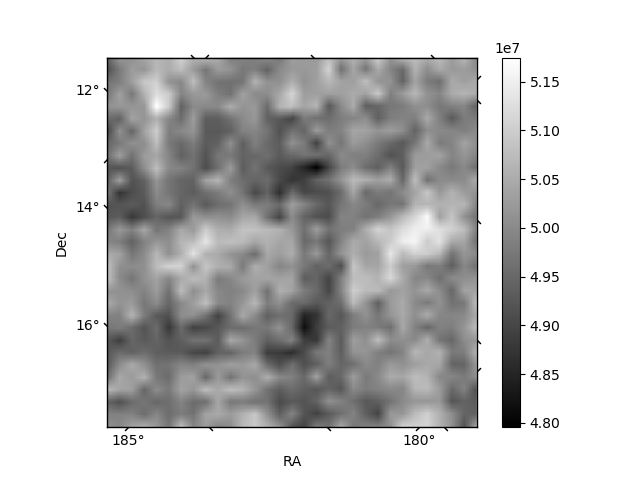
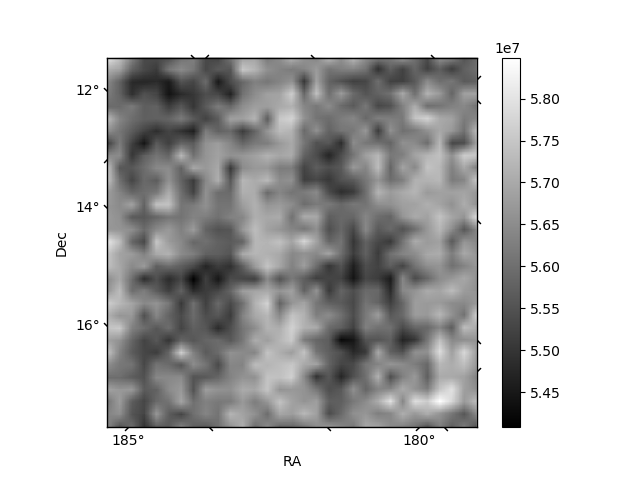
Histogram calculated using DETX and DETY for each event in the final _common_clean file
| Quadrant A | 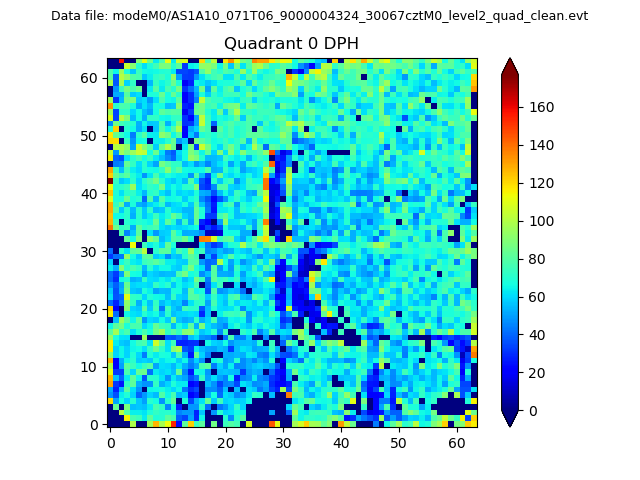 |
 |
Quadrant B |
|---|---|---|---|
| Quadrant D | 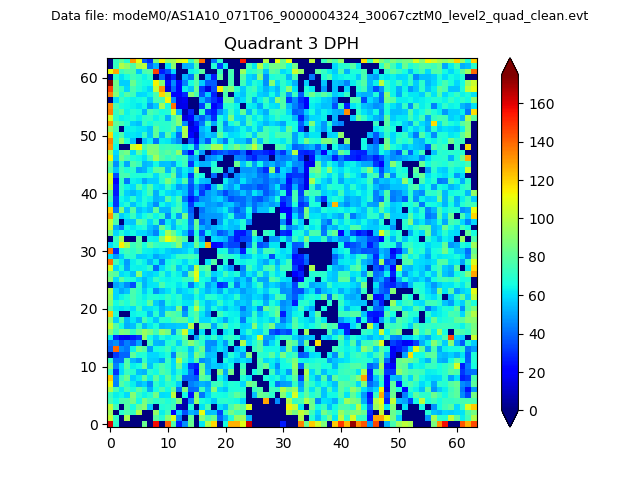 |
 |
Quadrant C |
| Plot type | Count rate plots | Images |
|---|---|---|
| Comparison with Poisson distribution Blue bars denote a histogram of data divided into 1 sec bins. Red curve is a Poisson curve with rate = median count rate of data. |
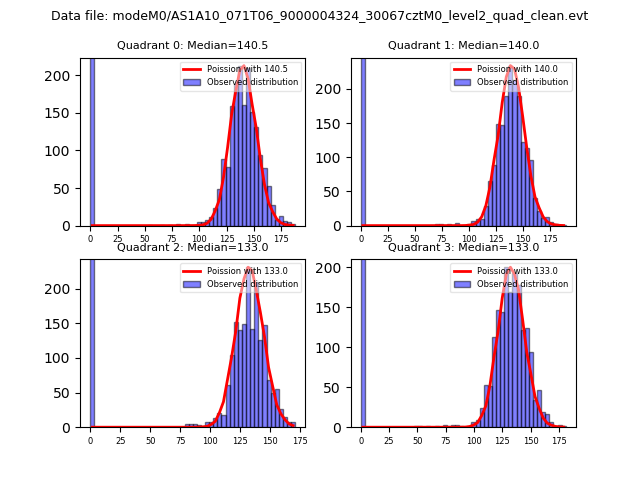 |
 |
| Quadrant-wise count rates Data is divided into 100 sec bins |
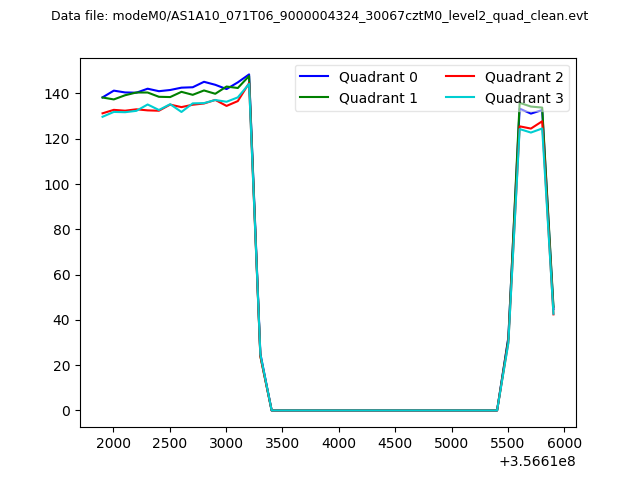 |
|
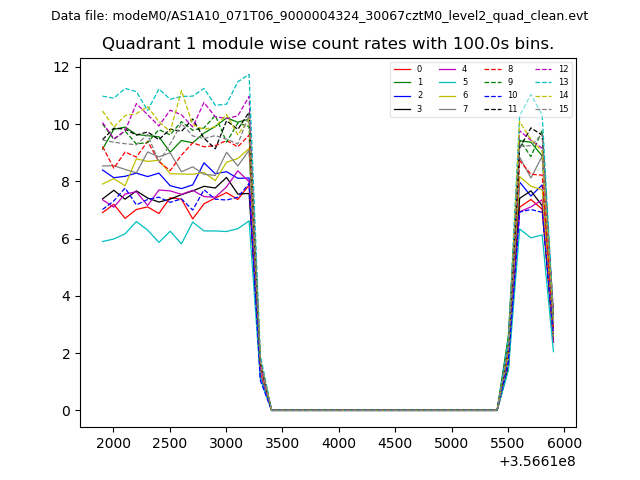
| Module-wise count rates for Quadrant A Data is divided into 100 sec bins |
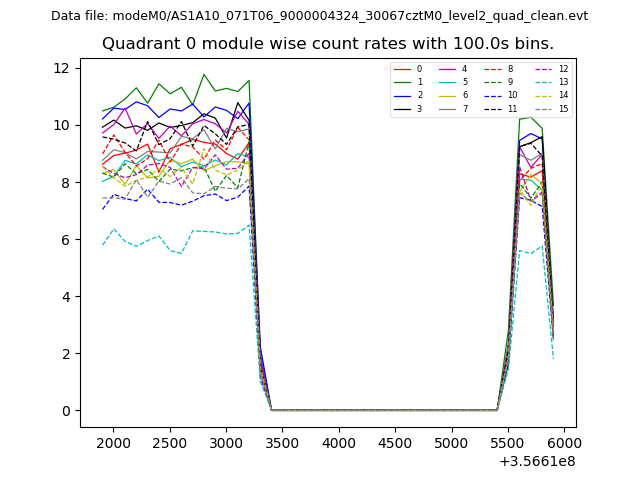 |
 |
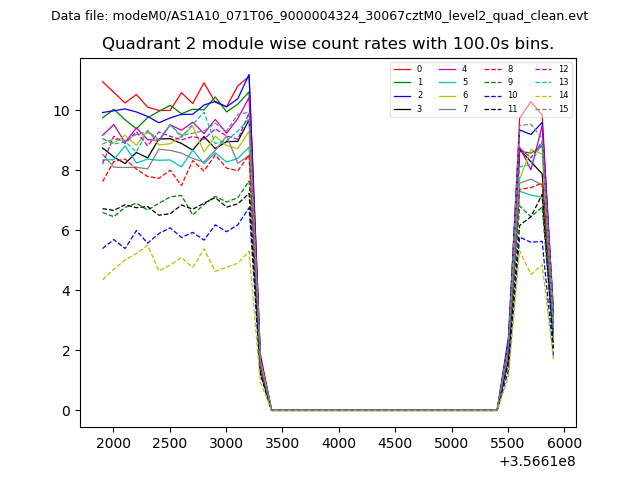
| Module-wise count rates for Quadrant B Data is divided into 100 sec bins |
 |
 |
| Module-wise count rates for Quadrant C Data is divided into 100 sec bins |
 |
 |
| Module-wise count rates for Quadrant D Data is divided into 100 sec bins |
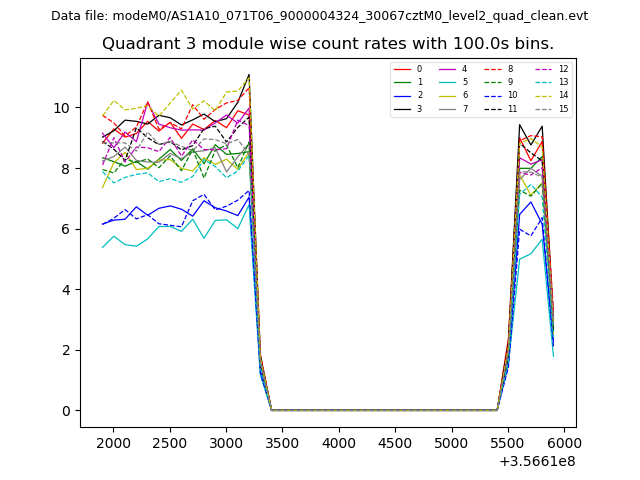 |
 |
| Parameter | Plot |
|---|---|
| CZT HV Monitor | 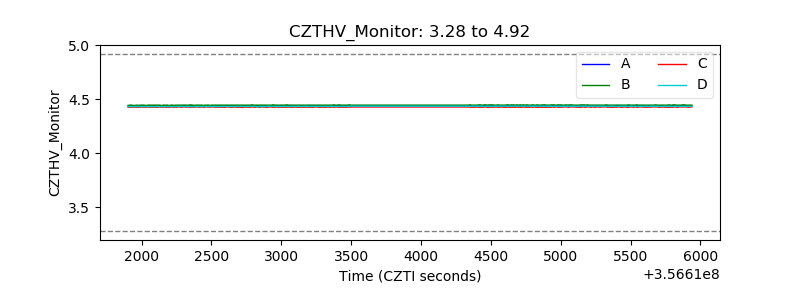 |
| D_VDD | 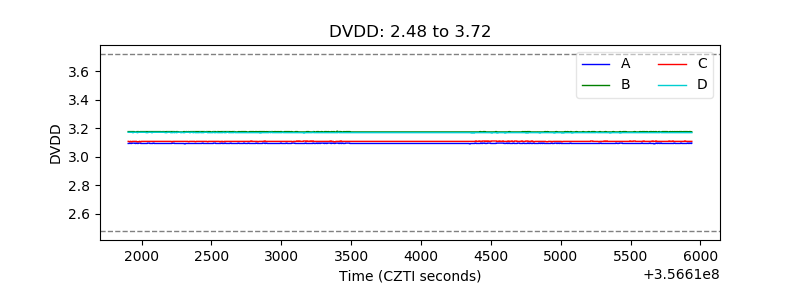 |
| Temperature 1 | 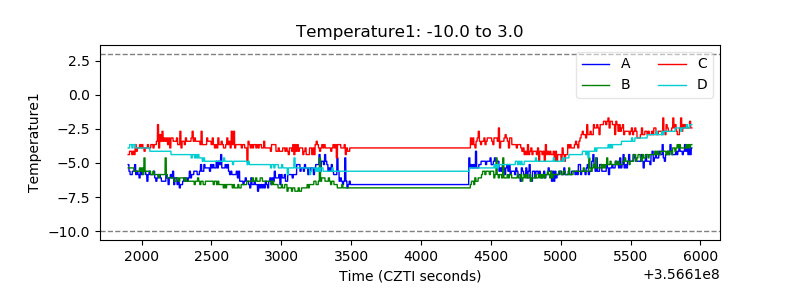 |
| Veto HV Monitor | 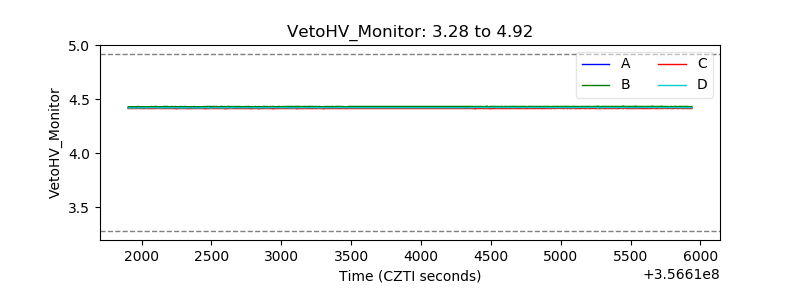 |
| Veto LLD | 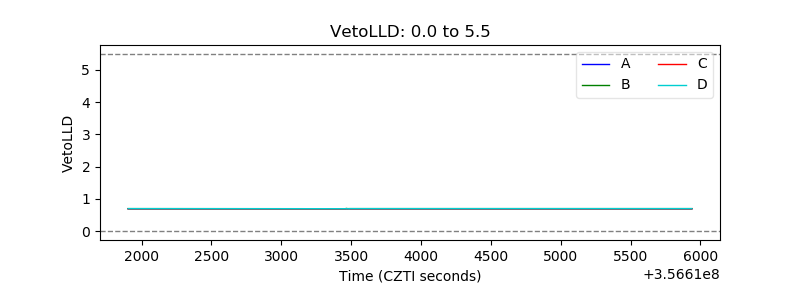 |
| Alpha Counter | 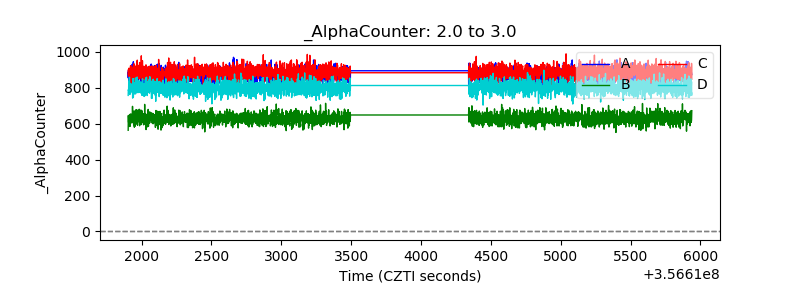 |
| _CPM_Rate | 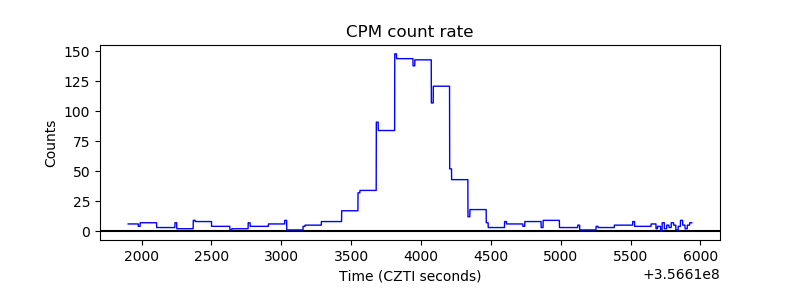 |
| CZT Counter |  |
| +2.5 Volts monitor |  |
| +5 Volts monitor |  |
| _ROLL_ROT | 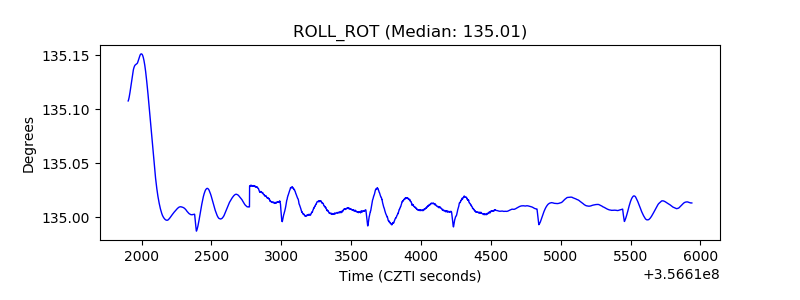 |
| _Roll_DEC | 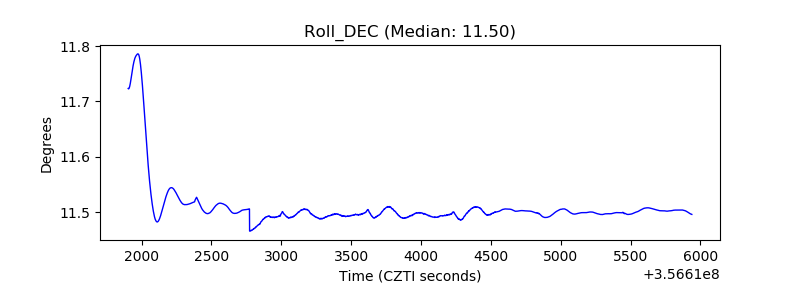 |
| _Roll_RA | 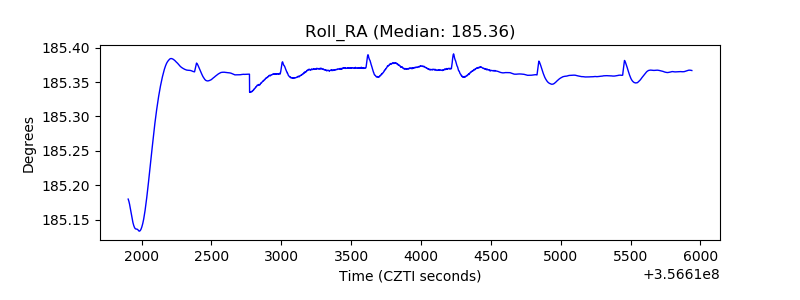 |
| Veto Counter | 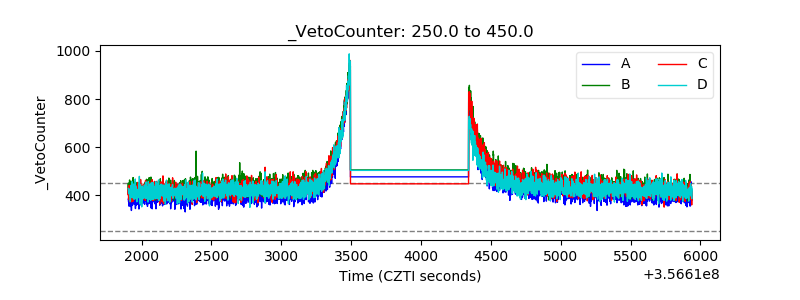 |