| Param | Original file | Final file |
|---|---|---|
| Filename | modeM0/AS1A10_071T06_9000004324_30068cztM0_level2.evt | modeM0/AS1A10_071T06_9000004324_30068cztM0_level2_quad_clean.evt |
| Size (bytes) | 576,095,040 | 90,722,880 |
| Size | 549.4 MB | 86.5 MB |
| Events in quadrant A | 3,652,671 | 574,083 |
| Events in quadrant B | 5,760,412 | 570,815 |
| Events in quadrant C | 3,718,763 | 544,415 |
| Events in quadrant D | 3,813,311 | 542,717 |
| Mode SS | |||
|---|---|---|---|
| Quadrant | BADHDUFLAG | Total packets | Discarded packets |
| A | 0 | 152 | 0 |
| B | 0 | 152 | 0 |
| C | 0 | 152 | 0 |
| D | 0 | 152 | 0 |
| Mode M0 | |||
|---|---|---|---|
| Quadrant | BADHDUFLAG | Total packets | Discarded packets |
| A | 0 | 15382 | 2 |
| B | 0 | 22513 | 2 |
| C | 0 | 15437 | 2 |
| D | 0 | 15779 | 2 |
| Mode M9 | |||
|---|---|---|---|
| Quadrant | BADHDUFLAG | Total packets | Discarded packets |
| A | 0 | 13 | 0 |
| B | 0 | 13 | 0 |
| C | 0 | 13 | 0 |
| D | 0 | 13 | 0 |
| Quadrant | Total seconds | Saturated seconds | Saturation percentage |
|---|---|---|---|
| A | 7403 | 174 | 2.350398% |
| B | 7403 | 319 | 4.309064% |
| C | 7403 | 230 | 3.106849% |
| D | 7403 | 128 | 1.729029% |
Noise dominated data is calculated using 1-second bins in cleaned event files. If a bin has >2000 counts, and if more than 50% of those come from <1% of pixels, then it is considered to be noise-dominated and hence unusable.
| Quadrant | # 1 sec bins | Bins with >0 counts | Bins with >2000 counts | High rate bins dominated by noise | Noise dominated (total time) | Noise dominated (detector-on time) | Marked lightcurve |
|---|---|---|---|---|---|---|---|
| A | 8708 | 7405 | 0 | 0 | 0.00% | 0.00% | 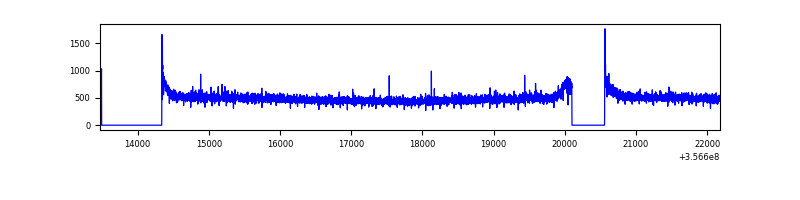 |
| B | 8708 | 7405 | 11 | 11 | 0.13% | 0.15% | 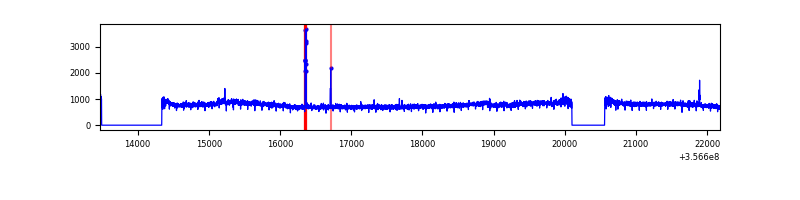 |
| C | 8708 | 7405 | 0 | 0 | 0.00% | 0.00% | 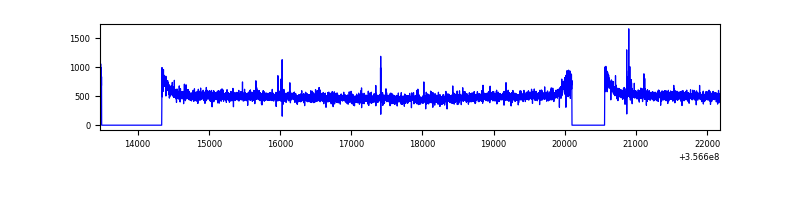 |
| D | 8708 | 7405 | 11 | 11 | 0.13% | 0.15% | 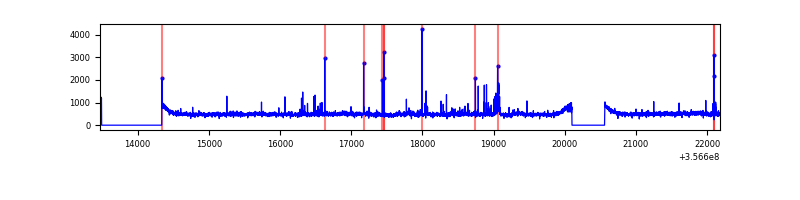 |
Top three noisy pixels from each quadrant. If the there are fewer than three noisy pixels in the level2.evt file, extra rows are filled as -1
| Pixel properties | Quadrant properties | ||||||
|---|---|---|---|---|---|---|---|
| Quadrant | DetID | PixID | Counts | Sigma | Mean | Median | Sigma |
| A | 8 | 192 | 19350 | 97.04 | 942 | 922 | 189.9 |
| A | 13 | 254 | 11438 | 55.37 | 942 | 922 | 189.9 |
| A | 3 | 137 | 9761 | 46.54 | 942 | 922 | 189.9 |
| B | 6 | 159 | 2043356 | 11456.42 | 922 | 895 | 178.3 |
| B | 0 | 229 | 51107 | 281.65 | 922 | 895 | 178.3 |
| B | 4 | 171 | 29048 | 157.91 | 922 | 895 | 178.3 |
| C | 14 | 238 | 149183 | 706.68 | 895 | 900 | 209.8 |
| C | 3 | 233 | 46525 | 217.44 | 895 | 900 | 209.8 |
| C | 2 | 114 | 17501 | 79.12 | 895 | 900 | 209.8 |
| D | 8 | 195 | 156455 | 713.65 | 906 | 880 | 218.0 |
| D | 13 | 104 | 79076 | 358.7 | 906 | 880 | 218.0 |
| D | 2 | 250 | 40860 | 183.4 | 906 | 880 | 218.0 |
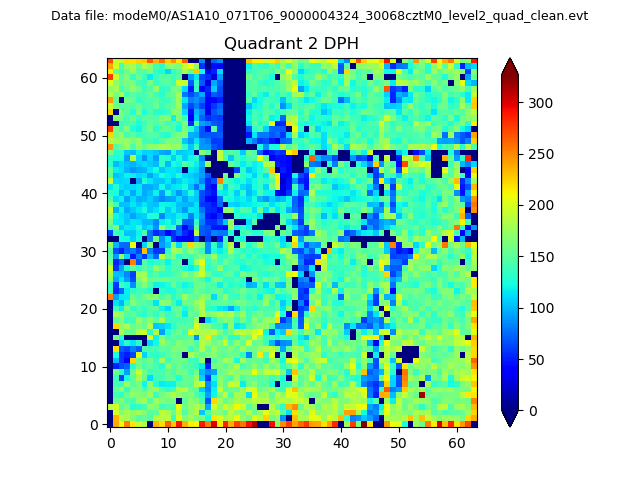
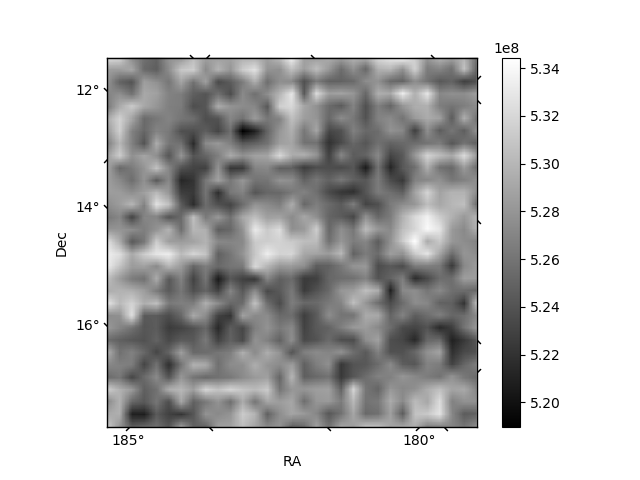
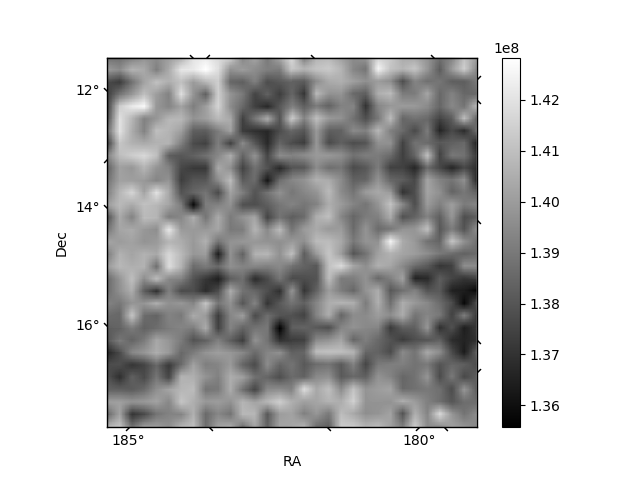
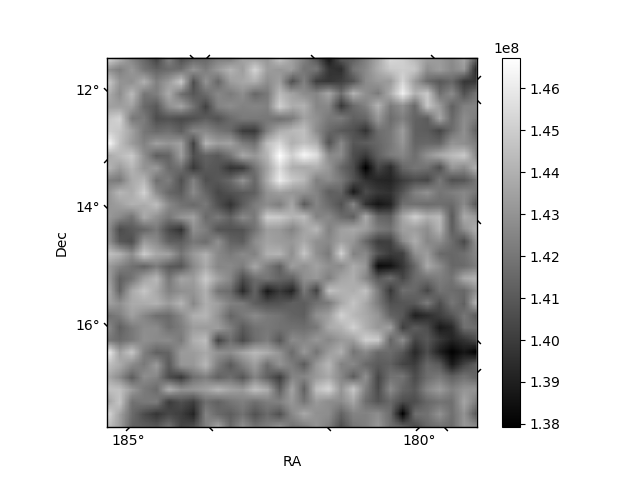
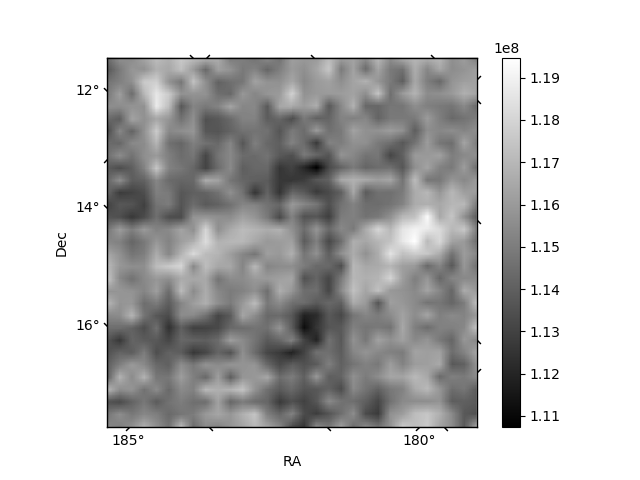
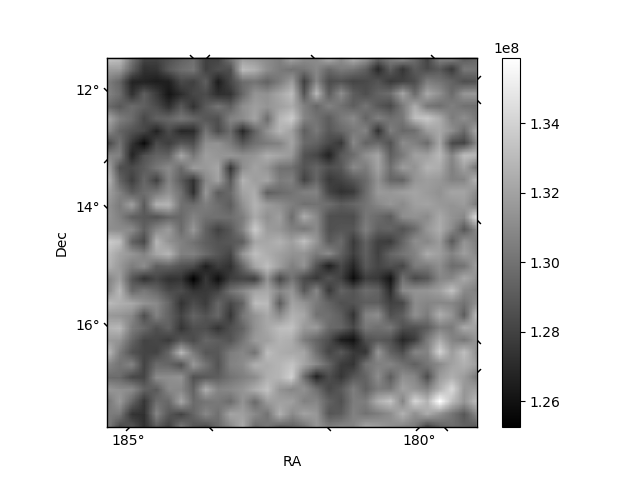
Histogram calculated using DETX and DETY for each event in the final _common_clean file
| Quadrant A | 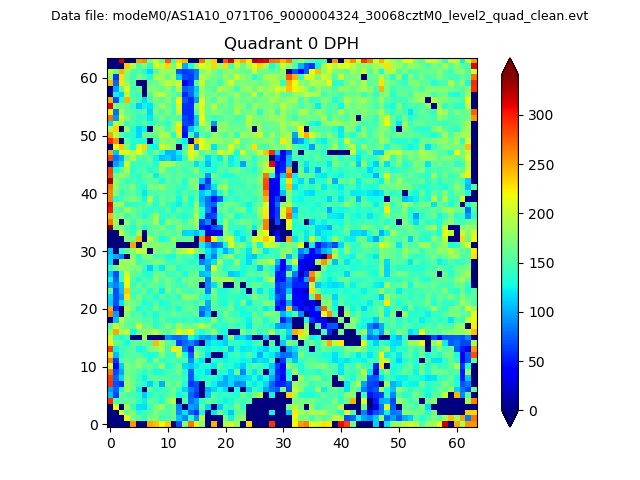 |
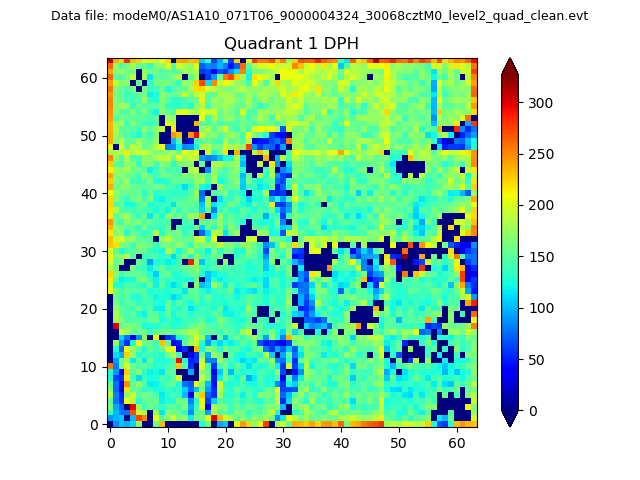 |
Quadrant B |
|---|---|---|---|
| Quadrant D | 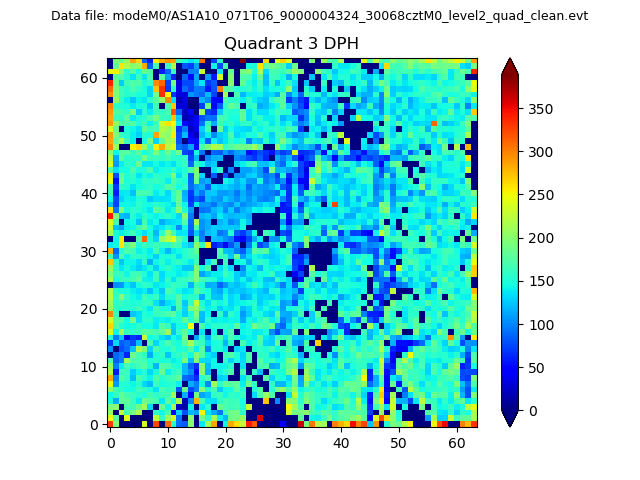 |
 |
Quadrant C |
| Plot type | Count rate plots | Images |
|---|---|---|
| Comparison with Poisson distribution Blue bars denote a histogram of data divided into 1 sec bins. Red curve is a Poisson curve with rate = median count rate of data. |
 |
 |
| Quadrant-wise count rates Data is divided into 100 sec bins |
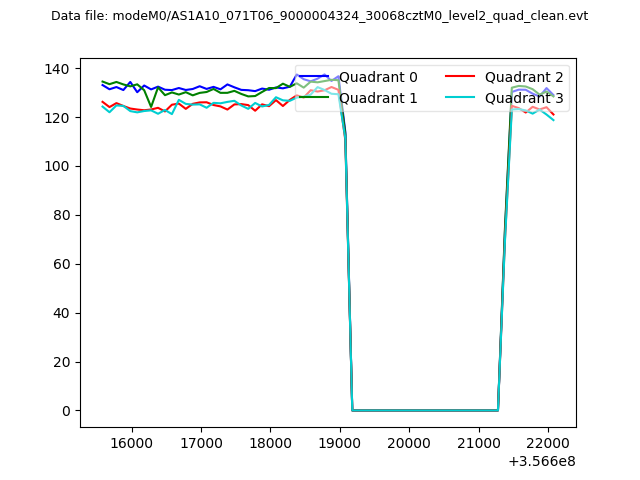 |
|
| Module-wise count rates for Quadrant A Data is divided into 100 sec bins |
 |
 |
| Module-wise count rates for Quadrant B Data is divided into 100 sec bins |
 |
 |
| Module-wise count rates for Quadrant C Data is divided into 100 sec bins |
 |
 |
| Module-wise count rates for Quadrant D Data is divided into 100 sec bins |
 |
 |
| Parameter | Plot |
|---|---|
| CZT HV Monitor | 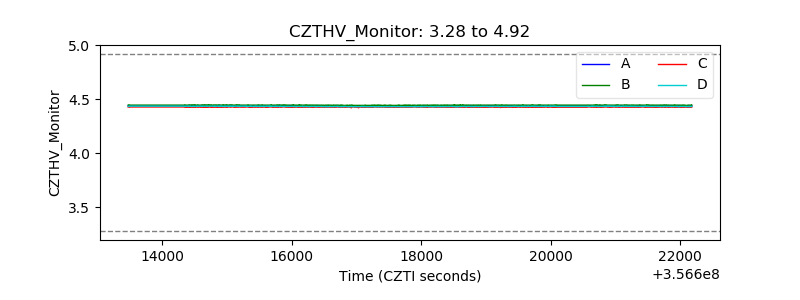 |
| D_VDD | 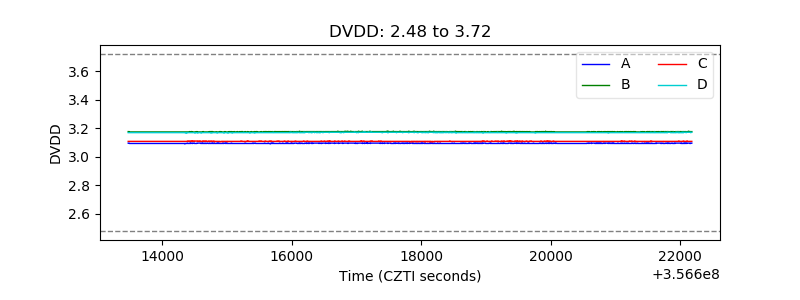 |
| Temperature 1 |  |
| Veto HV Monitor | 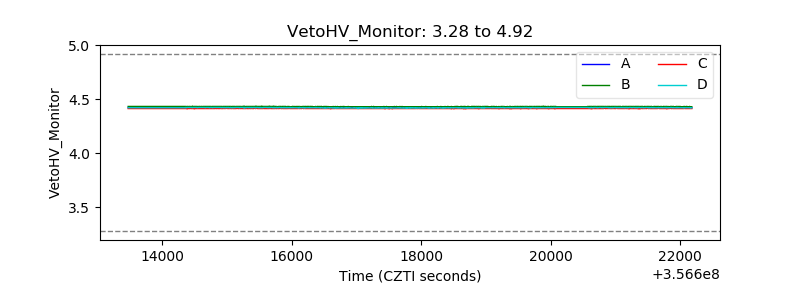 |
| Veto LLD | 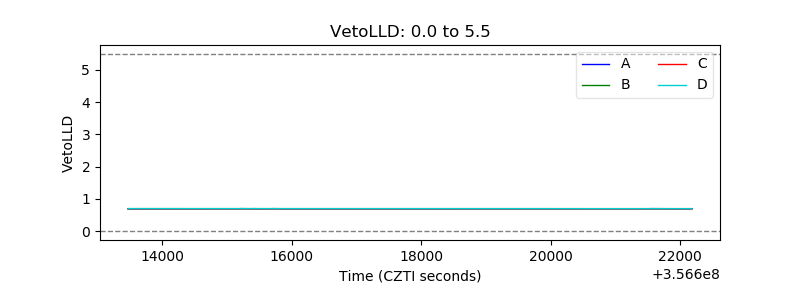 |
| Alpha Counter | 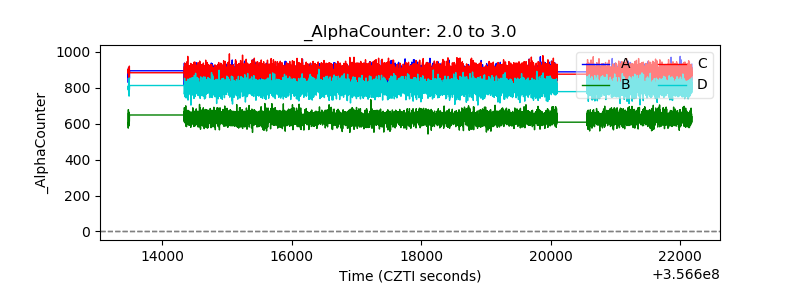 |
| _CPM_Rate | 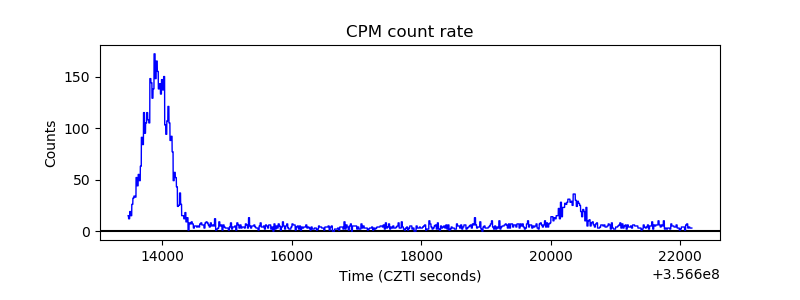 |
| CZT Counter | 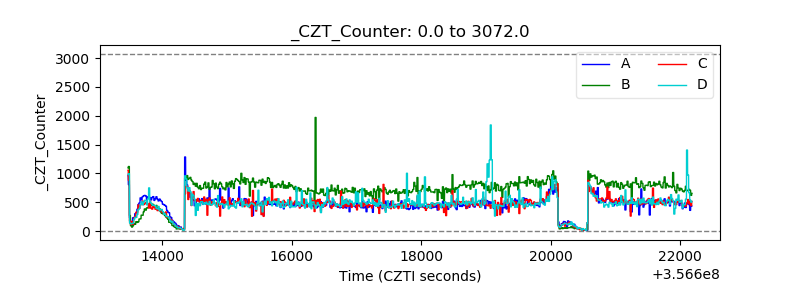 |
| +2.5 Volts monitor |  |
| +5 Volts monitor |  |
| _ROLL_ROT |  |
| _Roll_DEC |  |
| _Roll_RA | 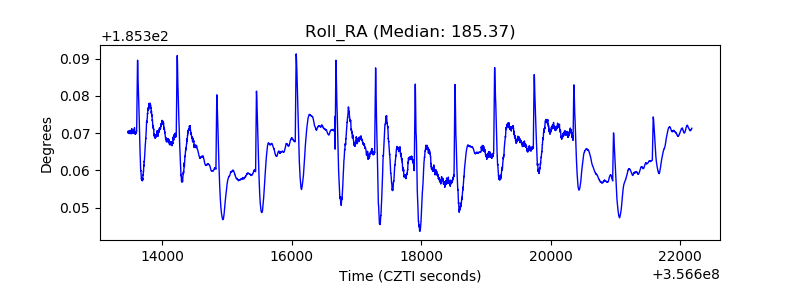 |
| Veto Counter |  |