| Param | Original file | Final file |
|---|---|---|
| Filename | modeM0/AS1A10_071T06_9000004324_30070cztM0_level2.evt | modeM0/AS1A10_071T06_9000004324_30070cztM0_level2_quad_clean.evt |
| Size (bytes) | 956,741,760 | 164,096,640 |
| Size | 912.4 MB | 156.5 MB |
| Events in quadrant A | 6,029,112 | 1,054,110 |
| Events in quadrant B | 9,374,262 | 1,049,945 |
| Events in quadrant C | 6,262,677 | 1,004,130 |
| Events in quadrant D | 6,469,484 | 1,003,713 |
| Mode SS | |||
|---|---|---|---|
| Quadrant | BADHDUFLAG | Total packets | Discarded packets |
| A | 0 | 252 | 0 |
| B | 0 | 252 | 0 |
| C | 0 | 252 | 0 |
| D | 0 | 252 | 0 |
| Mode M0 | |||
|---|---|---|---|
| Quadrant | BADHDUFLAG | Total packets | Discarded packets |
| A | 0 | 25968 | 2 |
| B | 0 | 37775 | 2 |
| C | 0 | 26297 | 2 |
| D | 0 | 27029 | 2 |
| Mode M9 | |||
|---|---|---|---|
| Quadrant | BADHDUFLAG | Total packets | Discarded packets |
| A | 0 | 3 | 0 |
| B | 0 | 3 | 0 |
| C | 0 | 3 | 0 |
| D | 0 | 3 | 0 |
| Quadrant | Total seconds | Saturated seconds | Saturation percentage |
|---|---|---|---|
| A | 12415 | 376 | 3.028594% |
| B | 12416 | 594 | 4.784149% |
| C | 12416 | 526 | 4.236469% |
| D | 12416 | 324 | 2.609536% |
Noise dominated data is calculated using 1-second bins in cleaned event files. If a bin has >2000 counts, and if more than 50% of those come from <1% of pixels, then it is considered to be noise-dominated and hence unusable.
| Quadrant | # 1 sec bins | Bins with >0 counts | Bins with >2000 counts | High rate bins dominated by noise | Noise dominated (total time) | Noise dominated (detector-on time) | Marked lightcurve |
|---|---|---|---|---|---|---|---|
| A | 12725 | 12418 | 0 | 0 | 0.00% | 0.00% | 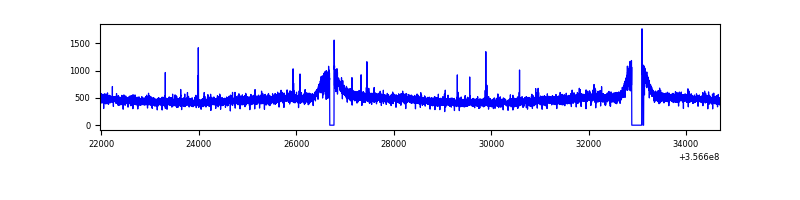 |
| B | 12726 | 12419 | 0 | 0 | 0.00% | 0.00% | 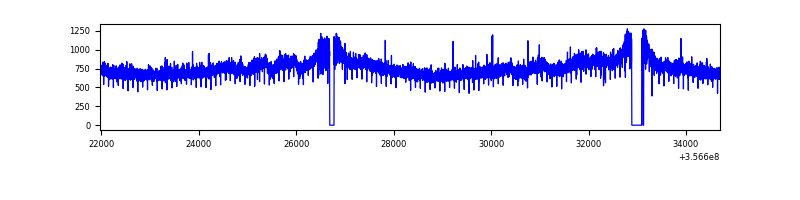 |
| C | 12726 | 12419 | 0 | 0 | 0.00% | 0.00% | 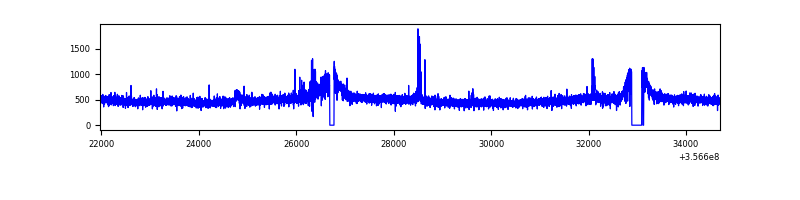 |
| D | 12726 | 12419 | 26 | 26 | 0.20% | 0.21% | 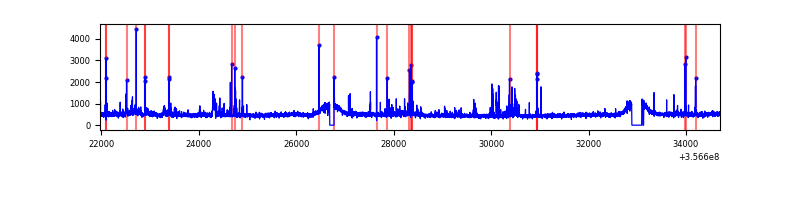 |
Top three noisy pixels from each quadrant. If the there are fewer than three noisy pixels in the level2.evt file, extra rows are filled as -1
| Pixel properties | Quadrant properties | ||||||
|---|---|---|---|---|---|---|---|
| Quadrant | DetID | PixID | Counts | Sigma | Mean | Median | Sigma |
| A | 13 | 254 | 20142 | 59.07 | 1555 | 1525 | 315.2 |
| A | 2 | 79 | 17863 | 51.84 | 1555 | 1525 | 315.2 |
| A | 8 | 192 | 16519 | 47.57 | 1555 | 1525 | 315.2 |
| B | 6 | 159 | 3373494 | 11528.46 | 1520 | 1479 | 292.5 |
| B | 12 | 111 | 38013 | 124.9 | 1520 | 1479 | 292.5 |
| B | 11 | 111 | 34869 | 114.16 | 1520 | 1479 | 292.5 |
| C | 14 | 238 | 249281 | 703.66 | 1483 | 1491 | 352.1 |
| C | 3 | 233 | 152646 | 429.24 | 1483 | 1491 | 352.1 |
| C | 2 | 114 | 29797 | 80.38 | 1483 | 1491 | 352.1 |
| D | 8 | 195 | 245899 | 677.82 | 1507 | 1475 | 360.6 |
| D | 12 | 33 | 155438 | 426.96 | 1507 | 1475 | 360.6 |
| D | 2 | 250 | 136807 | 375.29 | 1507 | 1475 | 360.6 |
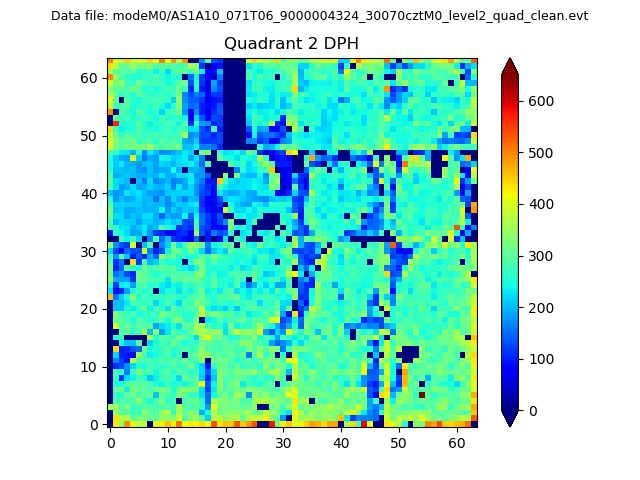
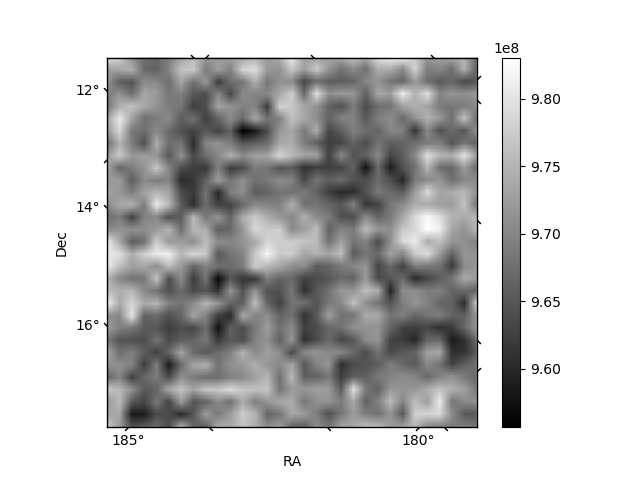
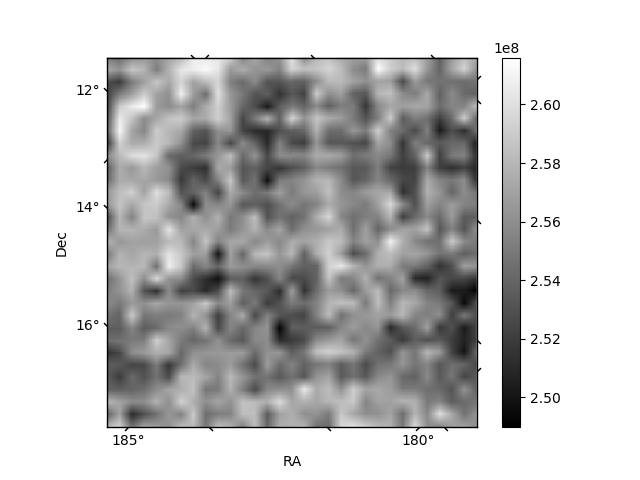
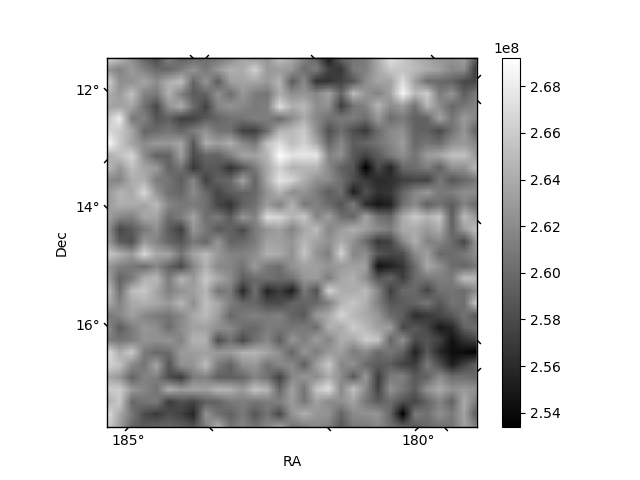
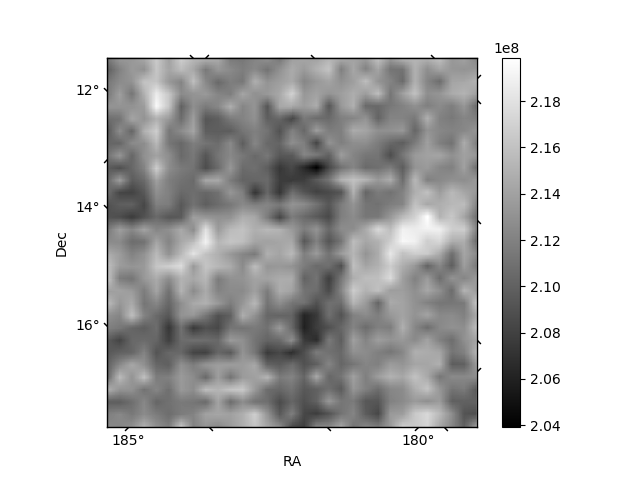
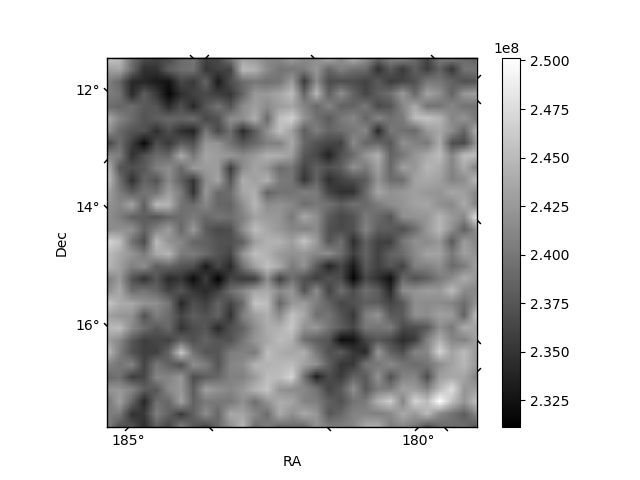
Histogram calculated using DETX and DETY for each event in the final _common_clean file
| Quadrant A | 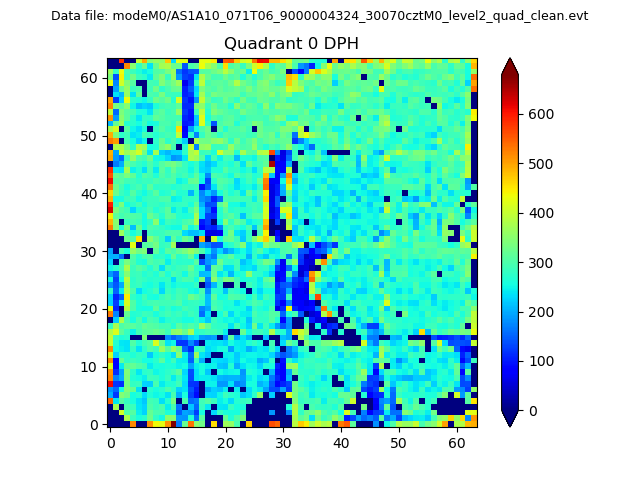 |
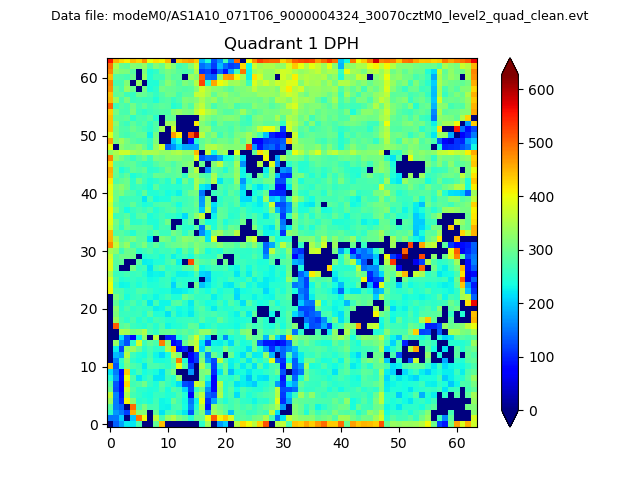 |
Quadrant B |
|---|---|---|---|
| Quadrant D | 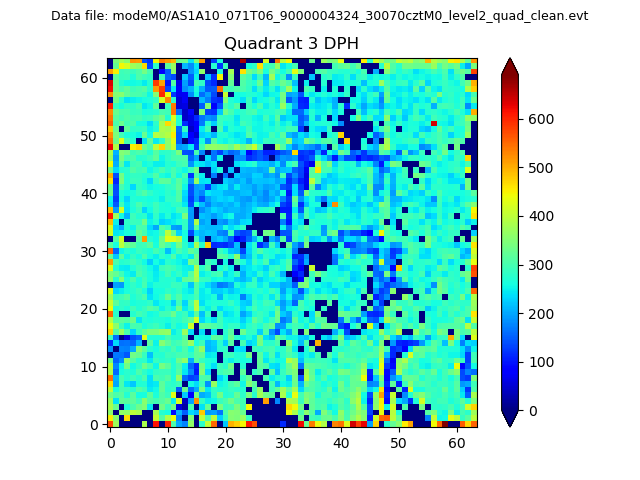 |
 |
Quadrant C |
| Plot type | Count rate plots | Images |
|---|---|---|
| Comparison with Poisson distribution Blue bars denote a histogram of data divided into 1 sec bins. Red curve is a Poisson curve with rate = median count rate of data. |
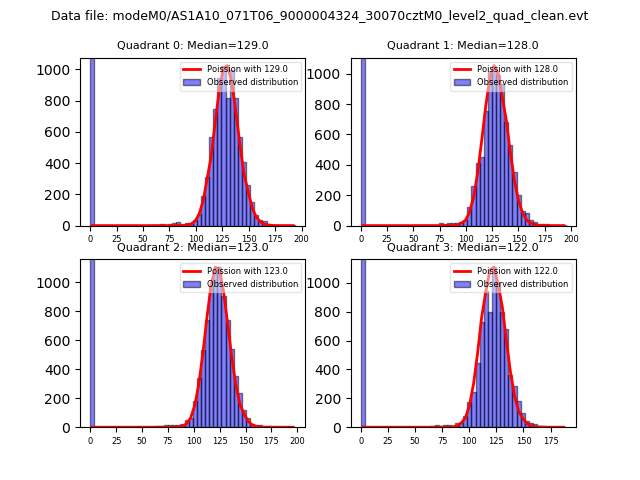 |
 |
| Quadrant-wise count rates Data is divided into 100 sec bins |
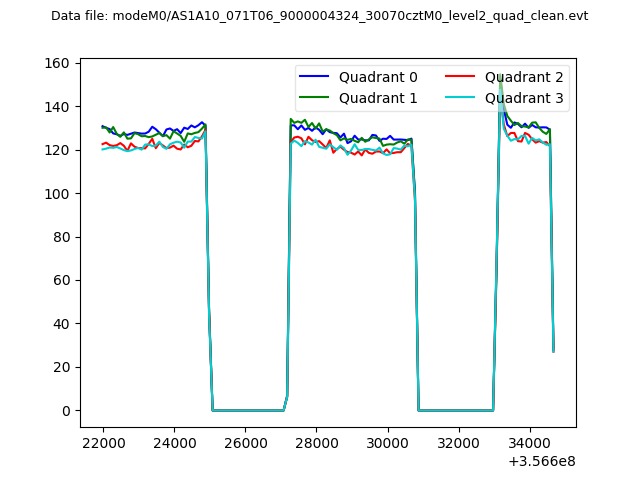 |
|
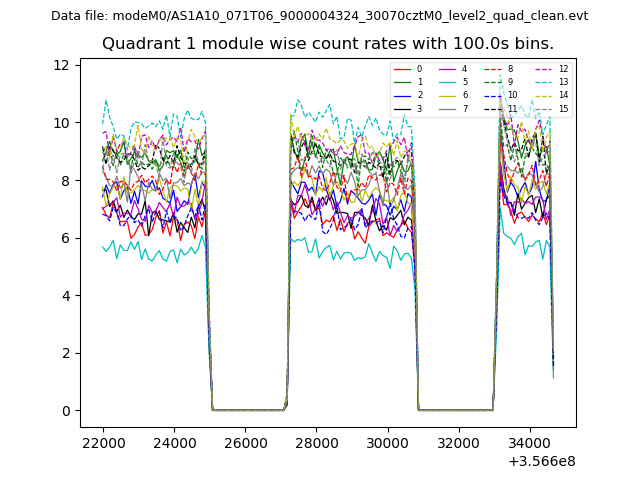
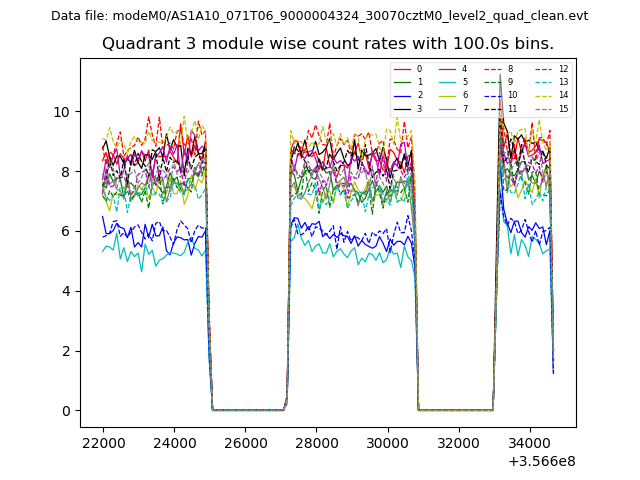
| Module-wise count rates for Quadrant A Data is divided into 100 sec bins |
 |
 |
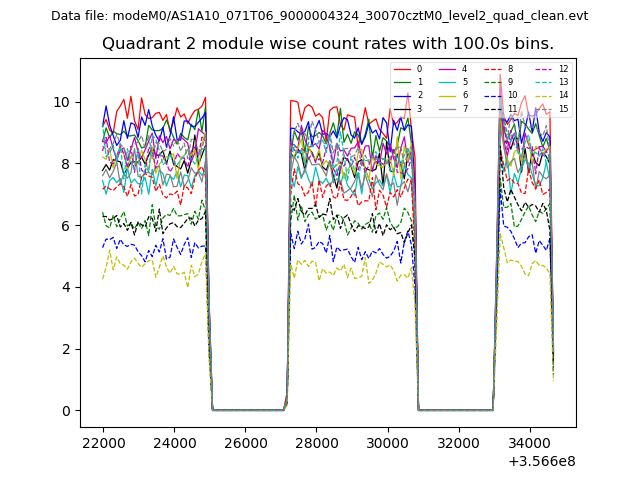
| Module-wise count rates for Quadrant B Data is divided into 100 sec bins |
 |
 |
| Module-wise count rates for Quadrant C Data is divided into 100 sec bins |
 |
 |
| Module-wise count rates for Quadrant D Data is divided into 100 sec bins |
 |
 |
| Parameter | Plot |
|---|---|
| CZT HV Monitor | 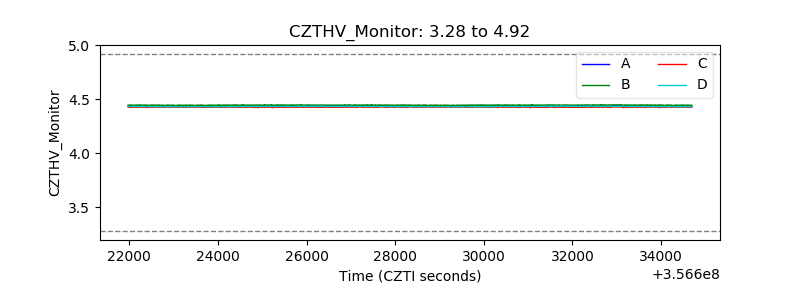 |
| D_VDD |  |
| Temperature 1 | 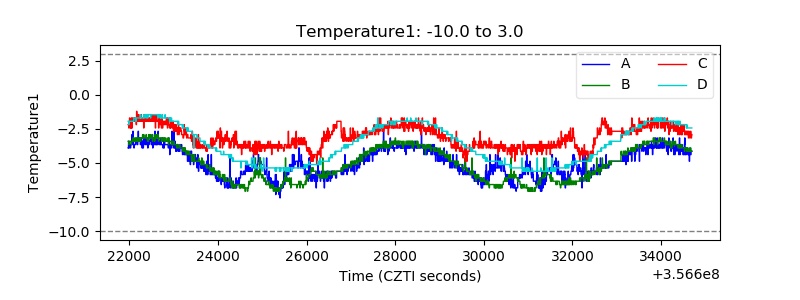 |
| Veto HV Monitor | 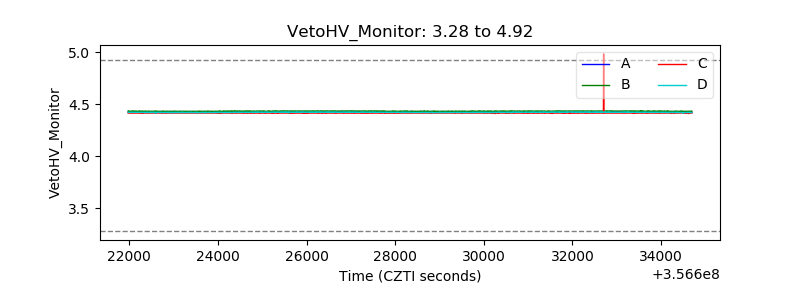 |
| Veto LLD |  |
| Alpha Counter | 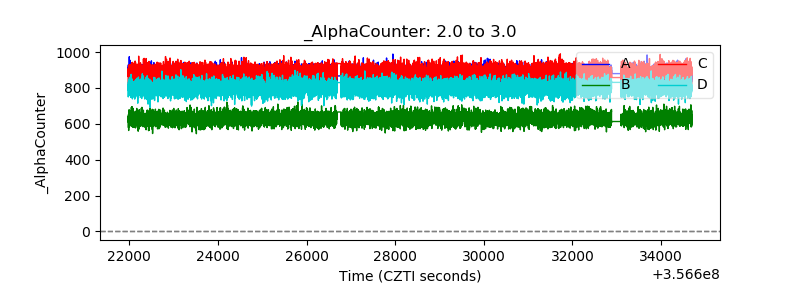 |
| _CPM_Rate | 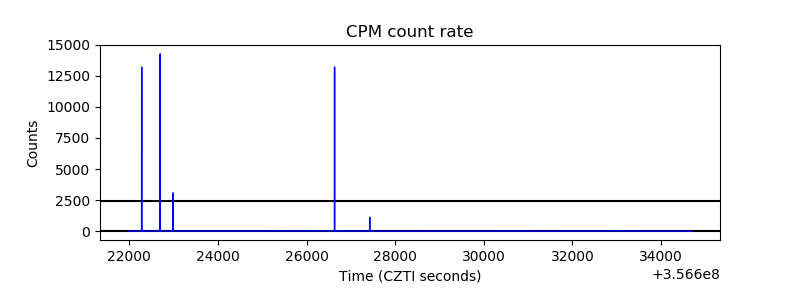 |
| CZT Counter | 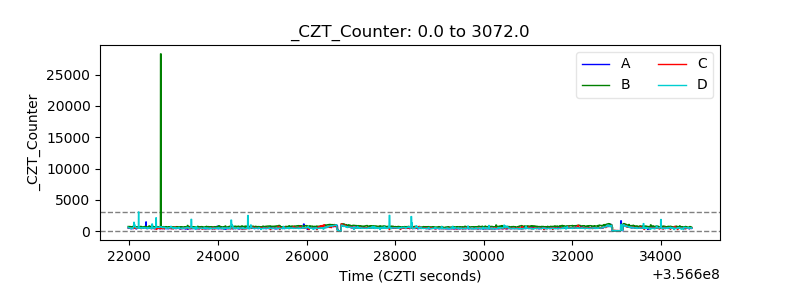 |
| +2.5 Volts monitor | 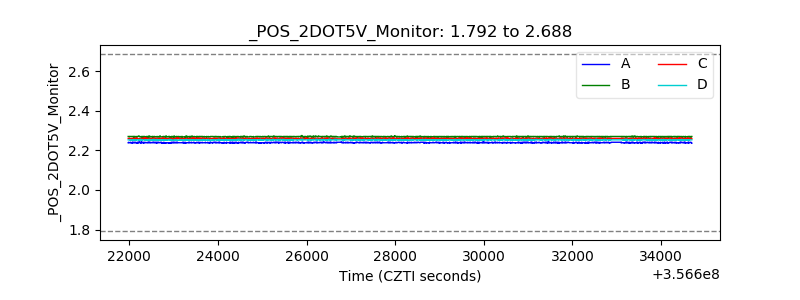 |
| +5 Volts monitor |  |
| _ROLL_ROT | 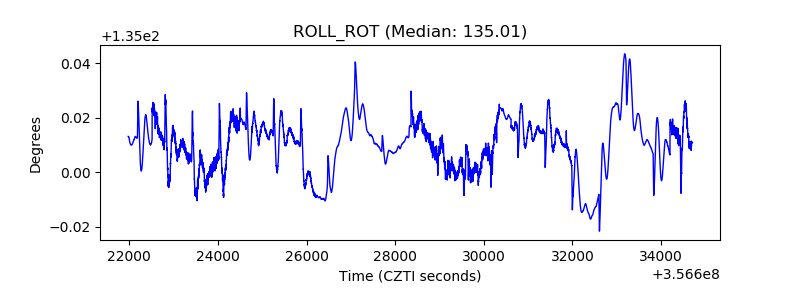 |
| _Roll_DEC | 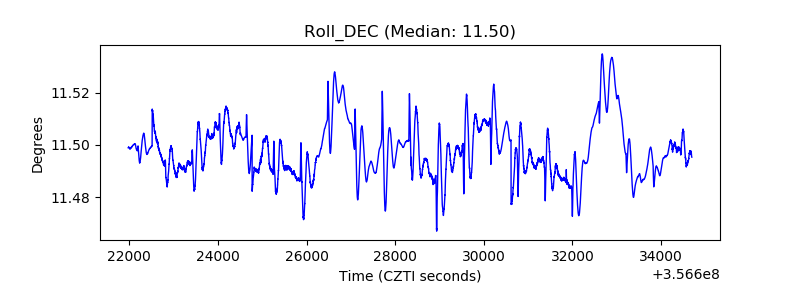 |
| _Roll_RA | 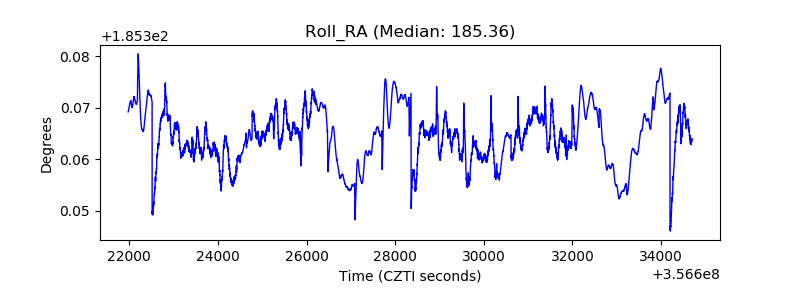 |
| Veto Counter | 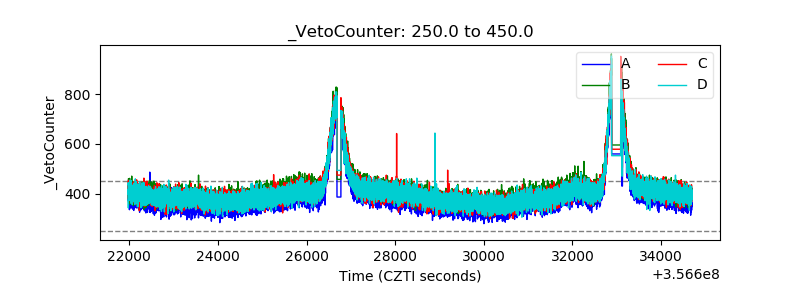 |