| Param | Original file | Final file |
|---|---|---|
| Filename | modeM0/AS1A10_071T08_9000004326cztM0_level2.fits | modeM0/AS1A10_071T08_9000004326cztM0_level2_quad_clean.evt |
| Size (bytes) | 74,790,720 | 45,118,080 |
| Size | 71.3 MB | 43.0 MB |
| Events in quadrant A | 459,416 | 218,778 |
| Events in quadrant B | 433,582 | 215,777 |
| Events in quadrant C | 442,000 | 203,335 |
| Events in quadrant D | 388,940 | 185,926 |
| Mode M9 | |||
|---|---|---|---|
| Quadrant | BADHDUFLAG | Total packets | Discarded packets |
| A | 0 | 10 | 0 |
| B | 0 | 10 | 0 |
| C | 0 | 10 | 0 |
| D | 0 | 10 | 0 |
| Mode SS | |||
|---|---|---|---|
| Quadrant | BADHDUFLAG | Total packets | Discarded packets |
| A | 0 | 158 | 0 |
| B | 0 | 158 | 0 |
| C | 0 | 158 | 0 |
| D | 0 | 158 | 0 |
| Mode M0 | |||
|---|---|---|---|
| Quadrant | BADHDUFLAG | Total packets | Discarded packets |
| A | 0 | 15861 | 0 |
| B | 0 | 23350 | 0 |
| C | 0 | 16166 | 0 |
| D | 0 | 17728 | 0 |
| Quadrant | Total seconds | Saturated seconds | Saturation percentage |
|---|---|---|---|
| A | 7784 | 38 | 0.488181% |
| B | 7784 | 81 | 1.040596% |
| C | 7784 | 77 | 0.989209% |
| D | 7784 | 102 | 1.310380% |
Noise dominated data is calculated using 1-second bins in cleaned event files. If a bin has >2000 counts, and if more than 50% of those come from <1% of pixels, then it is considered to be noise-dominated and hence unusable.
| Quadrant | # 1 sec bins | Bins with >0 counts | Bins with >2000 counts | High rate bins dominated by noise | Noise dominated (total time) | Noise dominated (detector-on time) | Marked lightcurve |
|---|---|---|---|---|---|---|---|
| A | 8754 | 7784 | 0 | 0 | 0.00% | 0.00% |  |
| B | 8754 | 7784 | 0 | 0 | 0.00% | 0.00% | 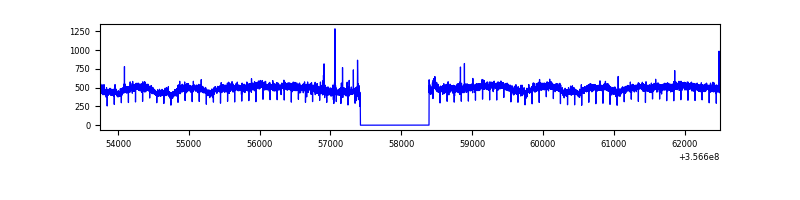 |
| C | 8754 | 7784 | 0 | 0 | 0.00% | 0.00% |  |
| D | 8754 | 7783 | 0 | 0 | 0.00% | 0.00% |  |
Top three noisy pixels from each quadrant. If the there are fewer than three noisy pixels in the level2.evt file, extra rows are filled as -1
| Pixel properties | Quadrant properties | ||||||
|---|---|---|---|---|---|---|---|
| Quadrant | DetID | PixID | Counts | Sigma | Mean | Median | Sigma |
| A | 0 | 29 | 467 | 11.23 | 119 | 112 | 31.6 |
| A | 14 | 79 | 343 | 7.31 | 119 | 112 | 31.6 |
| A | 7 | 110 | 342 | 7.28 | 119 | 112 | 31.6 |
| B | 2 | 9 | 337 | 9.1 | 114 | 109 | 25.1 |
| B | 5 | 232 | 290 | 7.22 | 114 | 109 | 25.1 |
| B | 3 | 17 | 290 | 7.22 | 114 | 109 | 25.1 |
| C | 1 | 80 | 321 | 6.7 | 116 | 109 | 31.7 |
| C | 9 | 209 | 313 | 6.45 | 116 | 109 | 31.7 |
| C | 3 | 158 | 310 | 6.35 | 116 | 109 | 31.7 |
| D | 15 | 46 | 317 | 6.89 | 111 | 101 | 31.4 |
| D | 6 | 231 | 294 | 6.15 | 111 | 101 | 31.4 |
| D | 3 | 14 | 291 | 6.06 | 111 | 101 | 31.4 |
Histogram calculated using DETX and DETY for each event in the final _common_clean file
| Quadrant A | 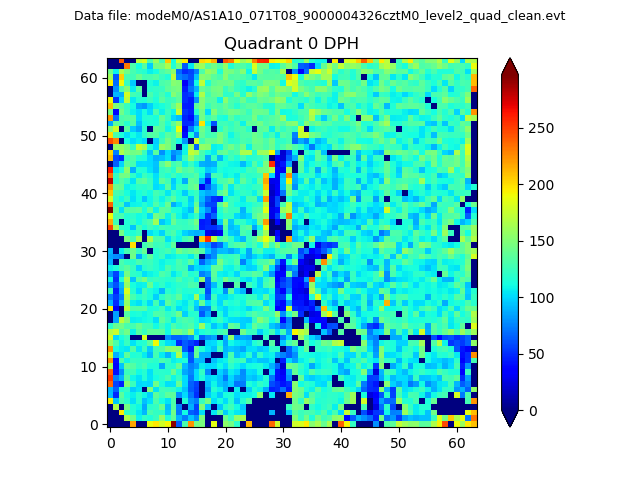 |
 |
Quadrant B |
|---|---|---|---|
| Quadrant D |  |
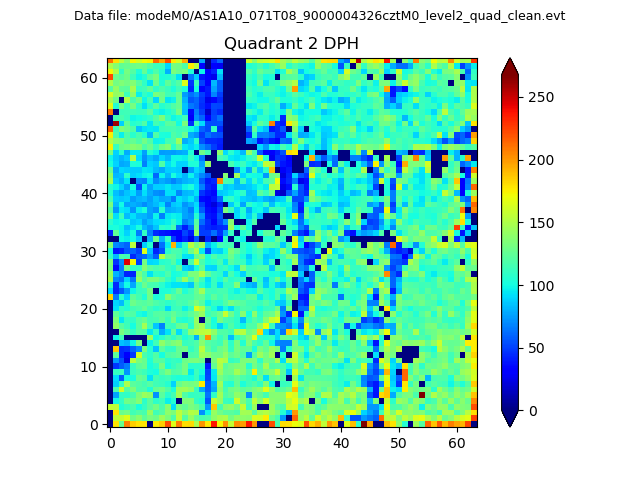 |
Quadrant C |
| Plot type | Count rate plots | Images |
|---|---|---|
| Comparison with Poisson distribution Blue bars denote a histogram of data divided into 1 sec bins. Red curve is a Poisson curve with rate = median count rate of data. |
 |
 |
| Quadrant-wise count rates Data is divided into 100 sec bins |
 |
|
| Module-wise count rates for Quadrant A Data is divided into 100 sec bins |
 |
 |
| Module-wise count rates for Quadrant B Data is divided into 100 sec bins |
 |
 |
| Module-wise count rates for Quadrant C Data is divided into 100 sec bins |
 |
 |
| Module-wise count rates for Quadrant D Data is divided into 100 sec bins |
 |
 |
| Parameter | Plot |
|---|---|
| CZT HV Monitor |  |
| D_VDD | 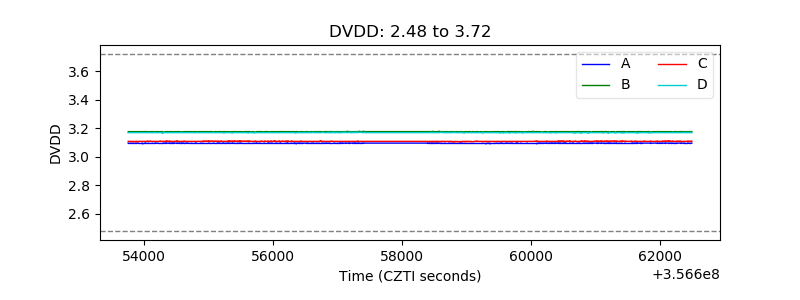 |
| Temperature 1 |  |
| Veto HV Monitor |  |
| Veto LLD |  |
| Alpha Counter |  |
| _CPM_Rate |  |
| CZT Counter |  |
| +2.5 Volts monitor |  |
| +5 Volts monitor |  |
| _ROLL_ROT |  |
| _Roll_DEC |  |
| _Roll_RA |  |
| Veto Counter |  |