| Param | Original file | Final file |
|---|---|---|
| Filename | modeM0/AS1A10_071T08_9000004326_30074cztM0_level2.evt | modeM0/AS1A10_071T08_9000004326_30074cztM0_level2_quad_clean.evt |
| Size (bytes) | 401,100,480 | 62,130,240 |
| Size | 382.5 MB | 59.3 MB |
| Events in quadrant A | 2,420,910 | 392,256 |
| Events in quadrant B | 3,891,322 | 391,501 |
| Events in quadrant C | 2,530,838 | 373,717 |
| Events in quadrant D | 2,957,151 | 365,682 |
| Mode M9 | |||
|---|---|---|---|
| Quadrant | BADHDUFLAG | Total packets | Discarded packets |
| A | 0 | 10 | 0 |
| B | 0 | 10 | 0 |
| C | 0 | 10 | 0 |
| D | 0 | 10 | 0 |
| Mode SS | |||
|---|---|---|---|
| Quadrant | BADHDUFLAG | Total packets | Discarded packets |
| A | 0 | 104 | 0 |
| B | 0 | 104 | 0 |
| C | 0 | 104 | 0 |
| D | 0 | 104 | 0 |
| Mode M0 | |||
|---|---|---|---|
| Quadrant | BADHDUFLAG | Total packets | Discarded packets |
| A | 0 | 10499 | 1 |
| B | 0 | 15354 | 1 |
| C | 0 | 10737 | 1 |
| D | 0 | 12357 | 1 |
| Quadrant | Total seconds | Saturated seconds | Saturation percentage |
|---|---|---|---|
| A | 5108 | 38 | 0.743931% |
| B | 5108 | 71 | 1.389977% |
| C | 5107 | 65 | 1.272763% |
| D | 5107 | 102 | 1.997259% |
Noise dominated data is calculated using 1-second bins in cleaned event files. If a bin has >2000 counts, and if more than 50% of those come from <1% of pixels, then it is considered to be noise-dominated and hence unusable.
| Quadrant | # 1 sec bins | Bins with >0 counts | Bins with >2000 counts | High rate bins dominated by noise | Noise dominated (total time) | Noise dominated (detector-on time) | Marked lightcurve |
|---|---|---|---|---|---|---|---|
| A | 6078 | 5109 | 2 | 2 | 0.03% | 0.04% | 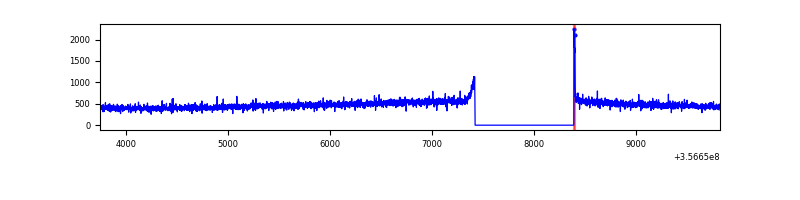 |
| B | 6078 | 5109 | 0 | 0 | 0.00% | 0.00% | 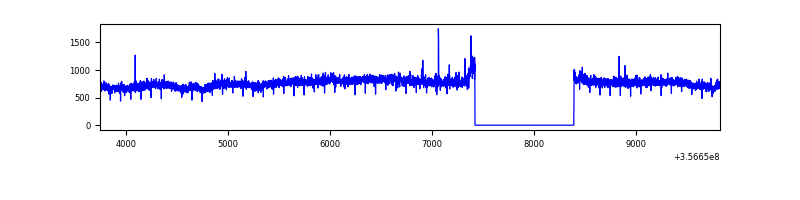 |
| C | 6077 | 5108 | 0 | 0 | 0.00% | 0.00% | 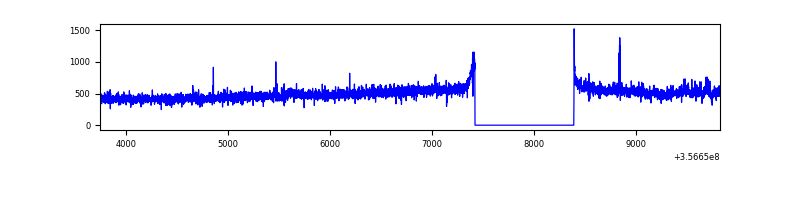 |
| D | 6077 | 5108 | 80 | 80 | 1.32% | 1.57% | 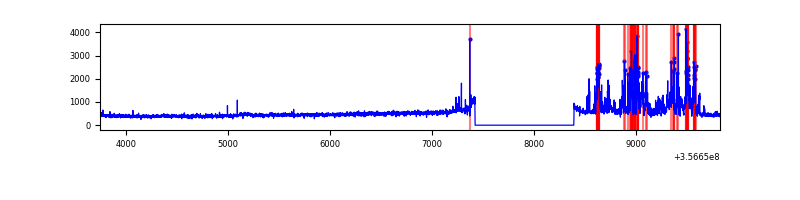 |
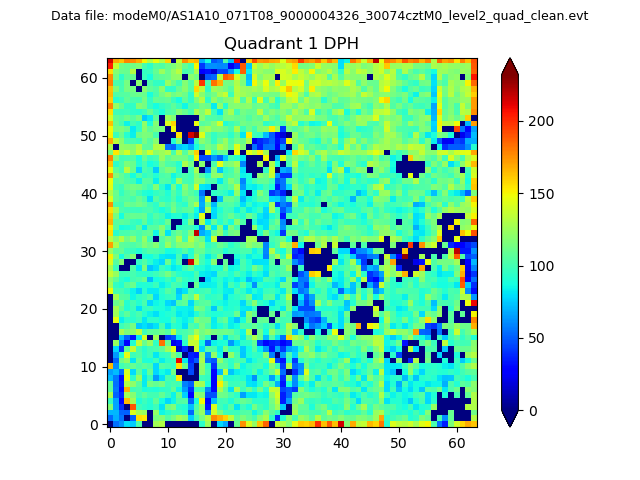
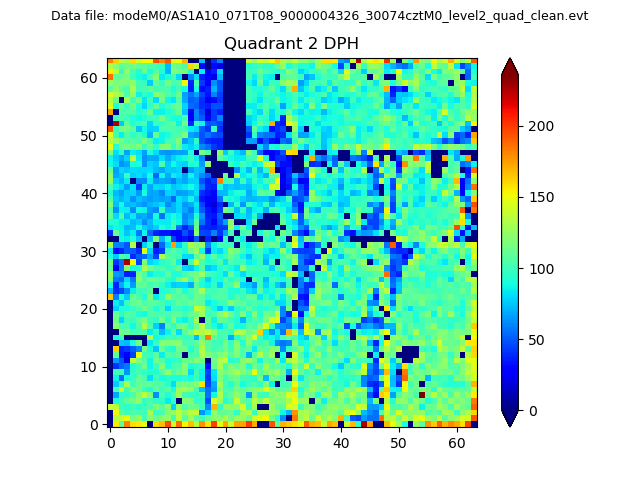
Top three noisy pixels from each quadrant. If the there are fewer than three noisy pixels in the level2.evt file, extra rows are filled as -1
| Pixel properties | Quadrant properties | ||||||
|---|---|---|---|---|---|---|---|
| Quadrant | DetID | PixID | Counts | Sigma | Mean | Median | Sigma |
| A | 8 | 192 | 15440 | 117.32 | 623 | 611 | 126.4 |
| A | 13 | 254 | 9221 | 68.12 | 623 | 611 | 126.4 |
| A | 3 | 137 | 6495 | 46.55 | 623 | 611 | 126.4 |
| B | 6 | 159 | 1458938 | 12212.55 | 615 | 599 | 119.4 |
| B | 12 | 111 | 15036 | 120.9 | 615 | 599 | 119.4 |
| B | 11 | 111 | 13982 | 112.07 | 615 | 599 | 119.4 |
| C | 14 | 238 | 97300 | 690.56 | 594 | 597 | 140.0 |
| C | 3 | 233 | 96414 | 684.23 | 594 | 597 | 140.0 |
| C | 2 | 114 | 11739 | 79.56 | 594 | 597 | 140.0 |
| D | 13 | 104 | 412395 | 2882.84 | 594 | 583 | 142.8 |
| D | 13 | 168 | 154240 | 1075.66 | 594 | 583 | 142.8 |
| D | 8 | 195 | 86433 | 600.98 | 594 | 583 | 142.8 |
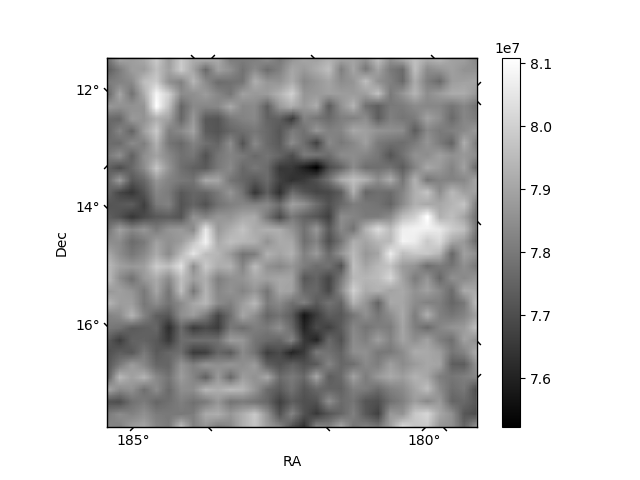
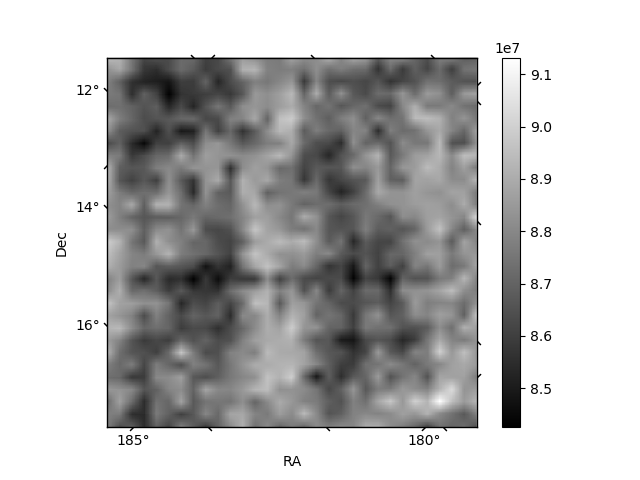
Histogram calculated using DETX and DETY for each event in the final _common_clean file
| Quadrant A | 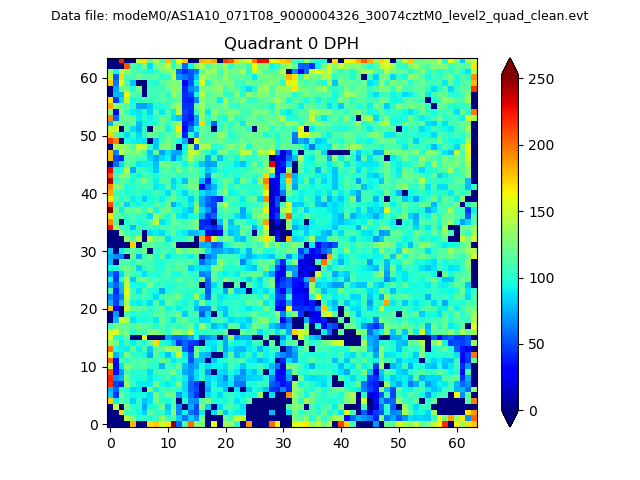 |
 |
Quadrant B |
|---|---|---|---|
| Quadrant D | 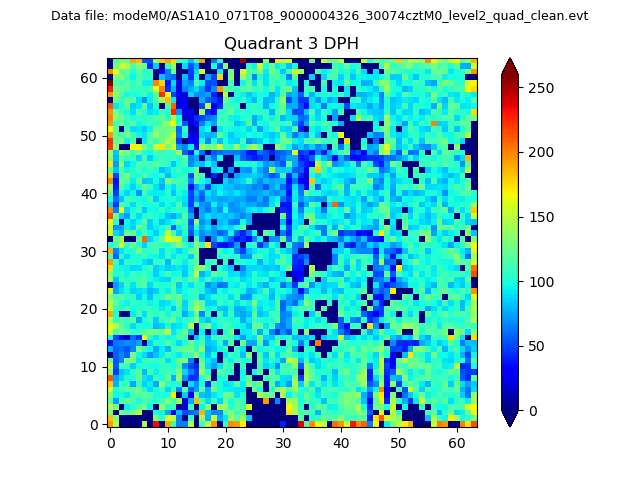 |
 |
Quadrant C |
| Plot type | Count rate plots | Images |
|---|---|---|
| Comparison with Poisson distribution Blue bars denote a histogram of data divided into 1 sec bins. Red curve is a Poisson curve with rate = median count rate of data. |
 |
 |
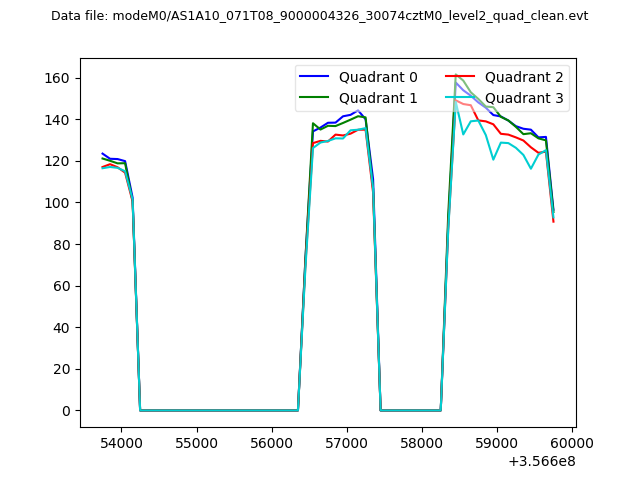
| Quadrant-wise count rates Data is divided into 100 sec bins |
 |
|
| Module-wise count rates for Quadrant A Data is divided into 100 sec bins |
 |
 |
| Module-wise count rates for Quadrant B Data is divided into 100 sec bins |
 |
 |
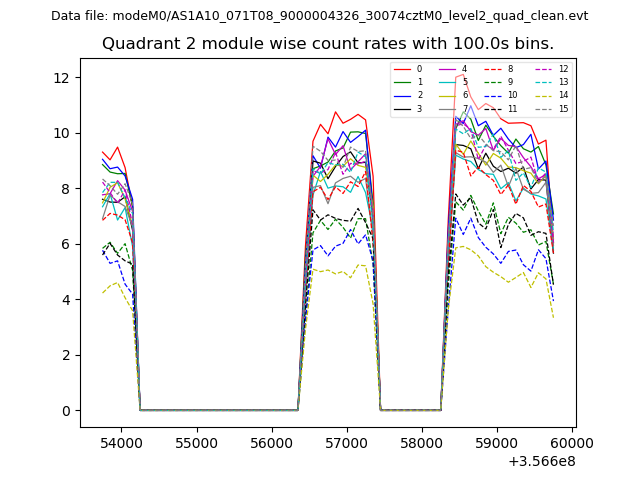
| Module-wise count rates for Quadrant C Data is divided into 100 sec bins |
 |
 |
| Module-wise count rates for Quadrant D Data is divided into 100 sec bins |
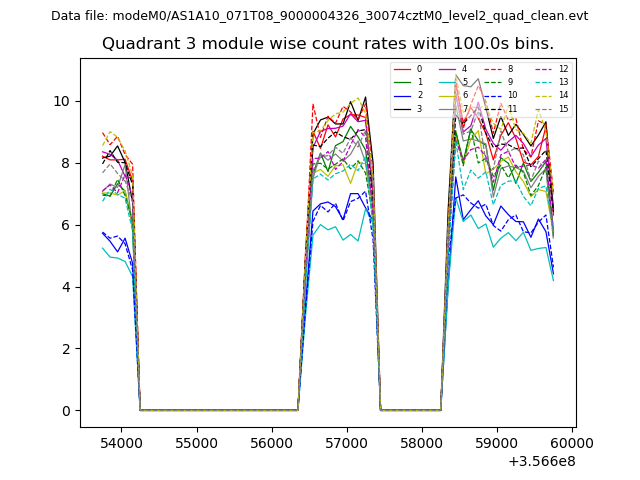 |
 |
| Parameter | Plot |
|---|---|
| CZT HV Monitor | 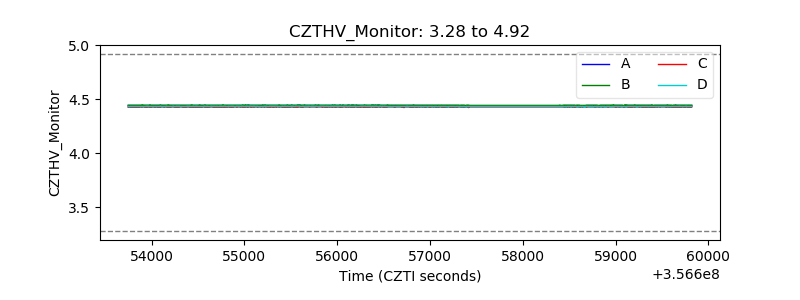 |
| D_VDD | 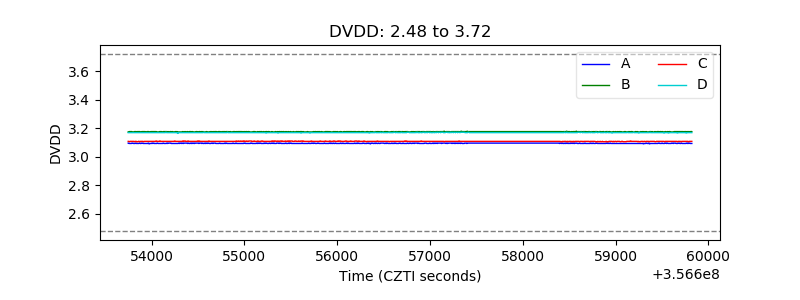 |
| Temperature 1 | 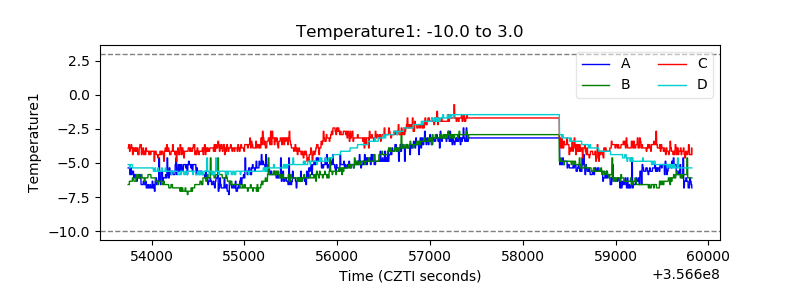 |
| Veto HV Monitor | 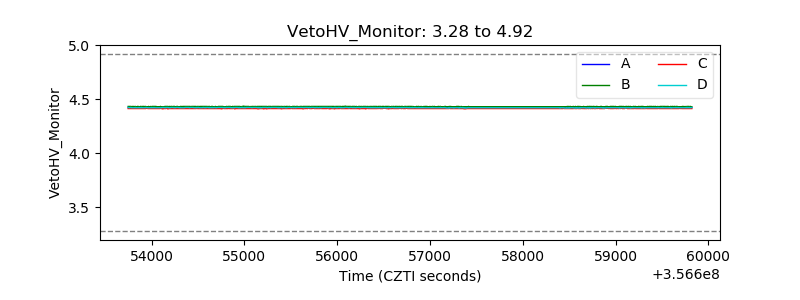 |
| Veto LLD | 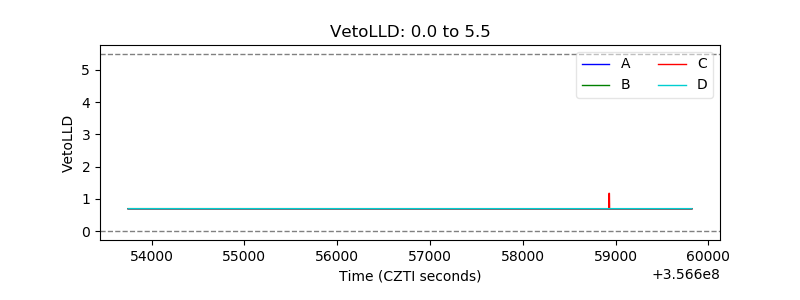 |
| Alpha Counter | 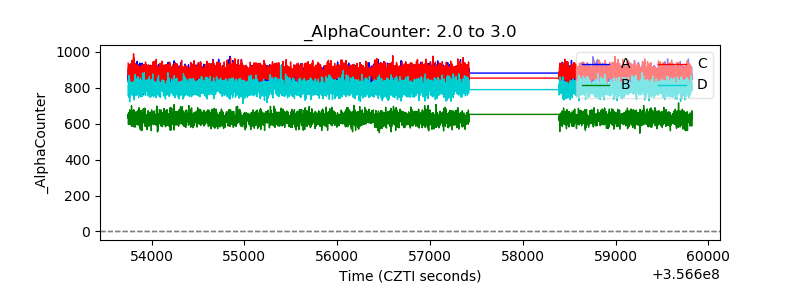 |
| _CPM_Rate | 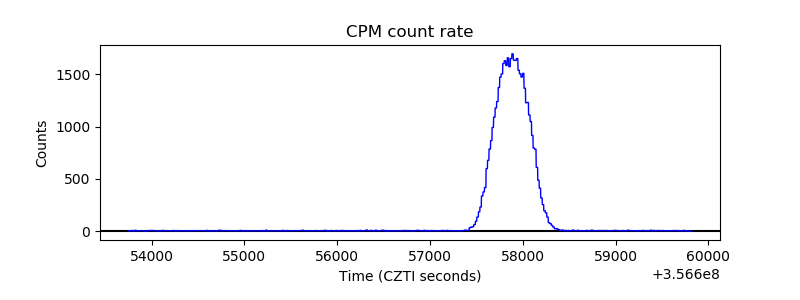 |
| CZT Counter | 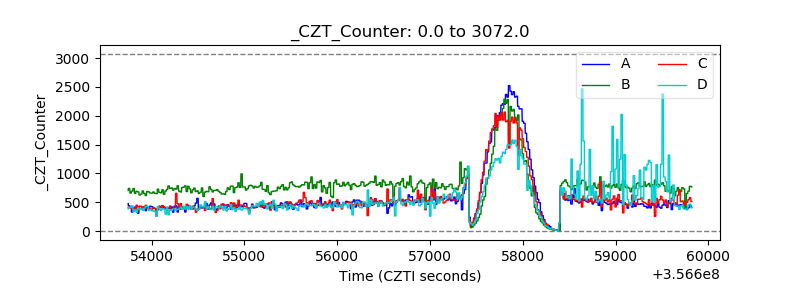 |
| +2.5 Volts monitor |  |
| +5 Volts monitor |  |
| _ROLL_ROT | 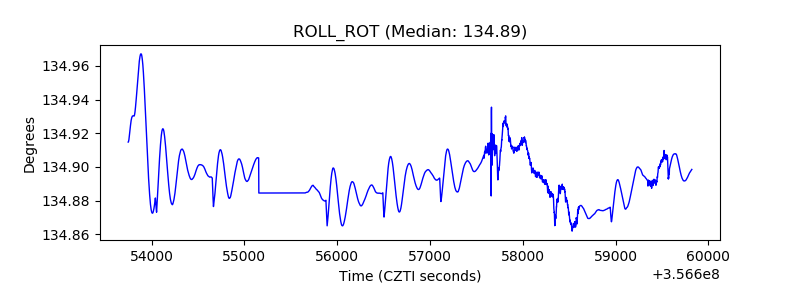 |
| _Roll_DEC | 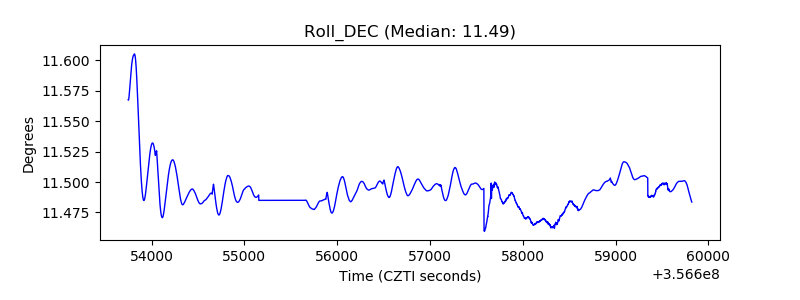 |
| _Roll_RA | 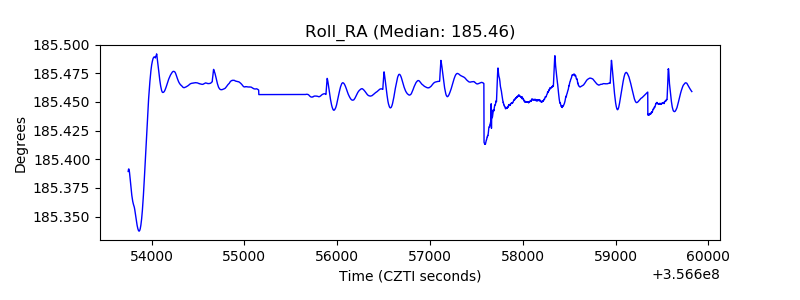 |
| Veto Counter |  |