| Param | Original file | Final file |
|---|---|---|
| Filename | modeM0/AS1A10_071T08_9000004326_30076cztM0_level2.evt | modeM0/AS1A10_071T08_9000004326_30076cztM0_level2_quad_clean.evt |
| Size (bytes) | 338,290,560 | 46,013,760 |
| Size | 322.6 MB | 43.9 MB |
| Events in quadrant A | 2,010,524 | 281,336 |
| Events in quadrant B | 3,259,717 | 282,430 |
| Events in quadrant C | 2,146,751 | 268,341 |
| Events in quadrant D | 2,537,449 | 260,127 |
| Mode M9 | |||
|---|---|---|---|
| Quadrant | BADHDUFLAG | Total packets | Discarded packets |
| A | 0 | 10 | 0 |
| B | 0 | 10 | 0 |
| C | 0 | 10 | 0 |
| D | 0 | 10 | 0 |
| Mode SS | |||
|---|---|---|---|
| Quadrant | BADHDUFLAG | Total packets | Discarded packets |
| A | 0 | 86 | 0 |
| B | 0 | 86 | 0 |
| C | 0 | 86 | 0 |
| D | 0 | 86 | 0 |
| Mode M0 | |||
|---|---|---|---|
| Quadrant | BADHDUFLAG | Total packets | Discarded packets |
| A | 0 | 8770 | 1 |
| B | 0 | 12851 | 1 |
| C | 0 | 9024 | 1 |
| D | 0 | 10631 | 1 |
| Quadrant | Total seconds | Saturated seconds | Saturation percentage |
|---|---|---|---|
| A | 4274 | 34 | 0.795508% |
| B | 4275 | 58 | 1.356725% |
| C | 4275 | 60 | 1.403509% |
| D | 4275 | 100 | 2.339181% |
Noise dominated data is calculated using 1-second bins in cleaned event files. If a bin has >2000 counts, and if more than 50% of those come from <1% of pixels, then it is considered to be noise-dominated and hence unusable.
| Quadrant | # 1 sec bins | Bins with >0 counts | Bins with >2000 counts | High rate bins dominated by noise | Noise dominated (total time) | Noise dominated (detector-on time) | Marked lightcurve |
|---|---|---|---|---|---|---|---|
| A | 5244 | 4275 | 2 | 2 | 0.04% | 0.05% | 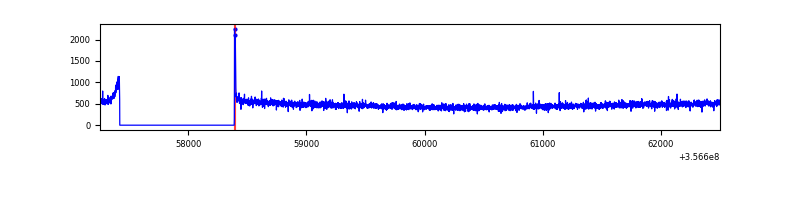 |
| B | 5245 | 4276 | 0 | 0 | 0.00% | 0.00% | 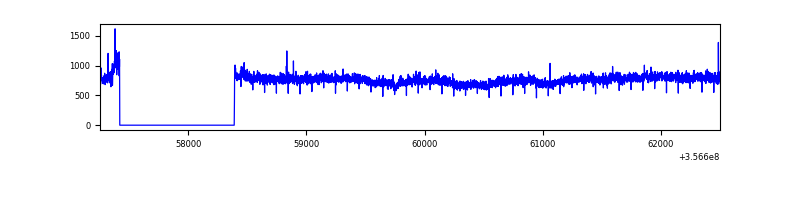 |
| C | 5245 | 4276 | 0 | 0 | 0.00% | 0.00% | 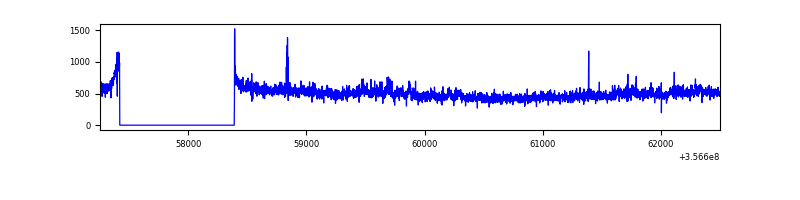 |
| D | 5245 | 4276 | 80 | 80 | 1.53% | 1.87% | 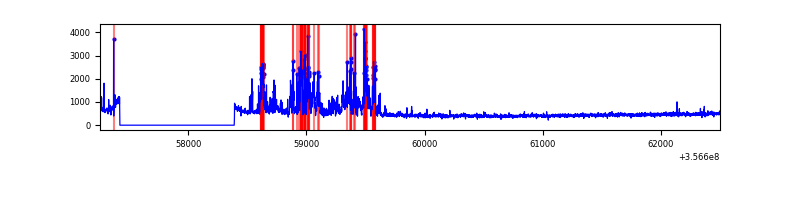 |
Top three noisy pixels from each quadrant. If the there are fewer than three noisy pixels in the level2.evt file, extra rows are filled as -1
| Pixel properties | Quadrant properties | ||||||
|---|---|---|---|---|---|---|---|
| Quadrant | DetID | PixID | Counts | Sigma | Mean | Median | Sigma |
| A | 8 | 192 | 15320 | 141.05 | 515 | 506 | 105.0 |
| A | 13 | 254 | 7701 | 68.51 | 515 | 506 | 105.0 |
| A | 3 | 1 | 6863 | 60.53 | 515 | 506 | 105.0 |
| B | 6 | 159 | 1252853 | 12677.25 | 510 | 498 | 98.8 |
| B | 12 | 111 | 12396 | 120.44 | 510 | 498 | 98.8 |
| B | 11 | 111 | 11309 | 109.44 | 510 | 498 | 98.8 |
| C | 3 | 233 | 134437 | 1154.97 | 490 | 495 | 116.0 |
| C | 14 | 238 | 79642 | 682.48 | 490 | 495 | 116.0 |
| C | 2 | 114 | 9775 | 80.02 | 490 | 495 | 116.0 |
| D | 13 | 104 | 409235 | 3469.79 | 489 | 480 | 117.8 |
| D | 13 | 168 | 154997 | 1311.64 | 489 | 480 | 117.8 |
| D | 8 | 195 | 63689 | 536.56 | 489 | 480 | 117.8 |
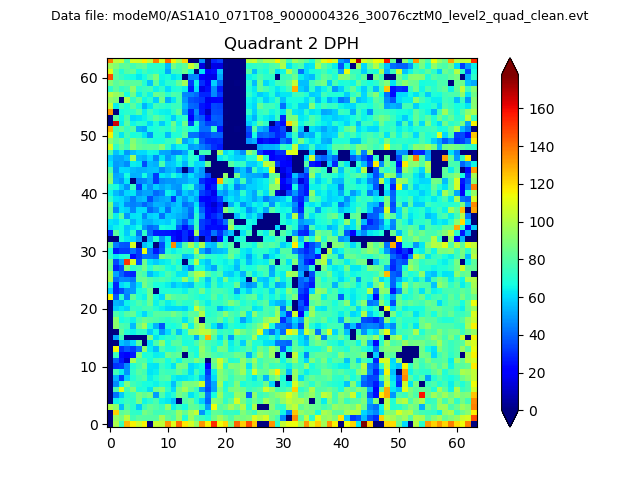
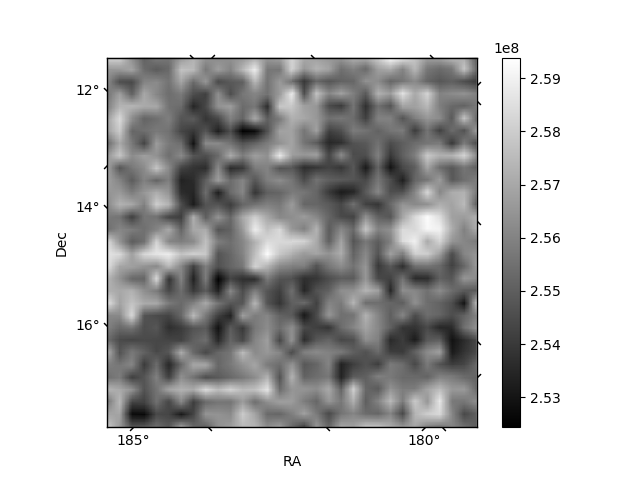
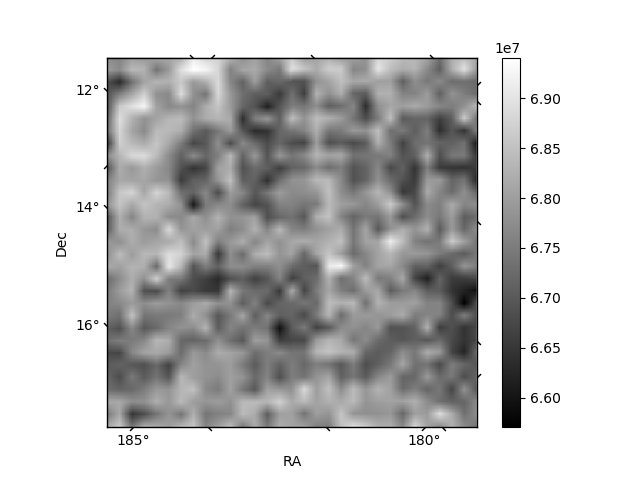
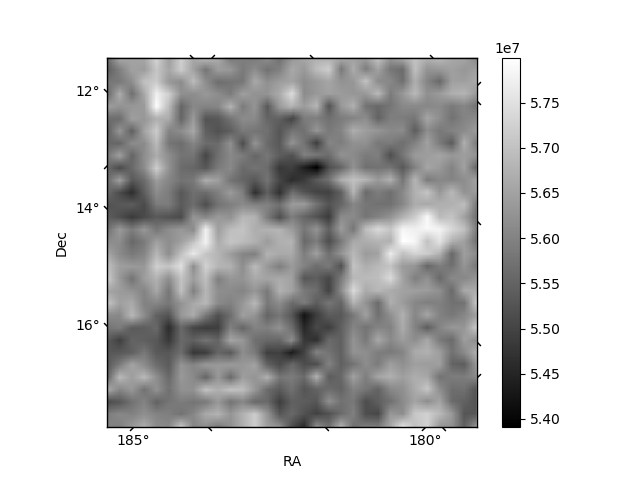
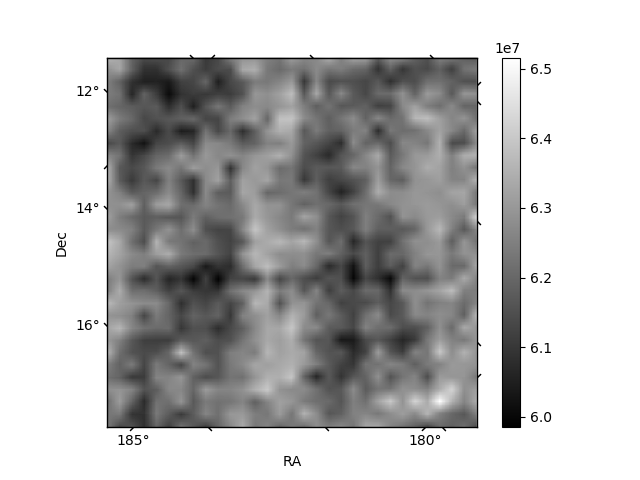
Histogram calculated using DETX and DETY for each event in the final _common_clean file
| Quadrant A | 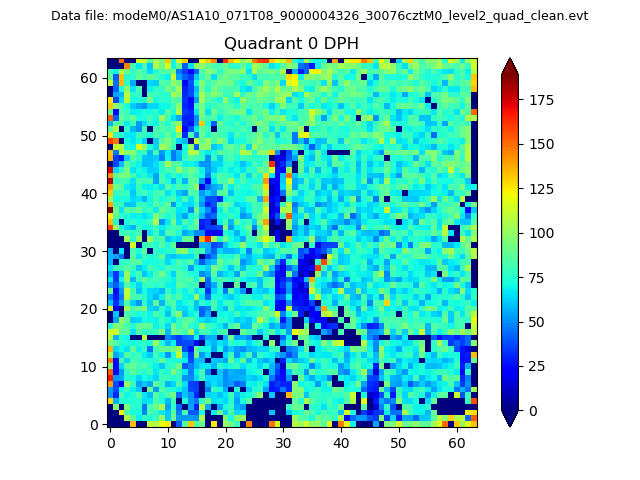 |
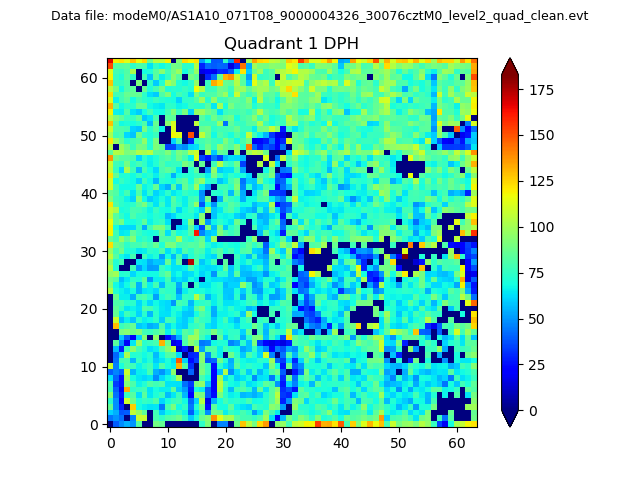 |
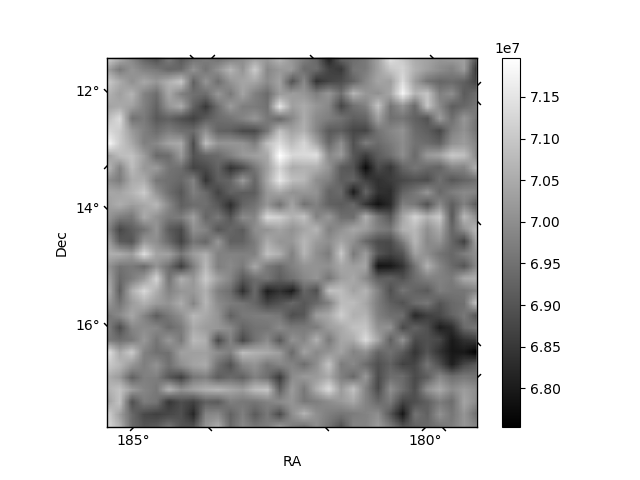
Quadrant B |
|---|---|---|---|
| Quadrant D | 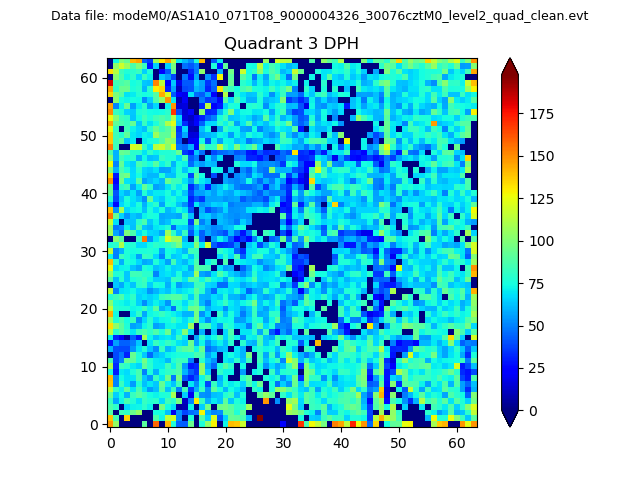 |
 |
Quadrant C |
| Plot type | Count rate plots | Images |
|---|---|---|
| Comparison with Poisson distribution Blue bars denote a histogram of data divided into 1 sec bins. Red curve is a Poisson curve with rate = median count rate of data. |
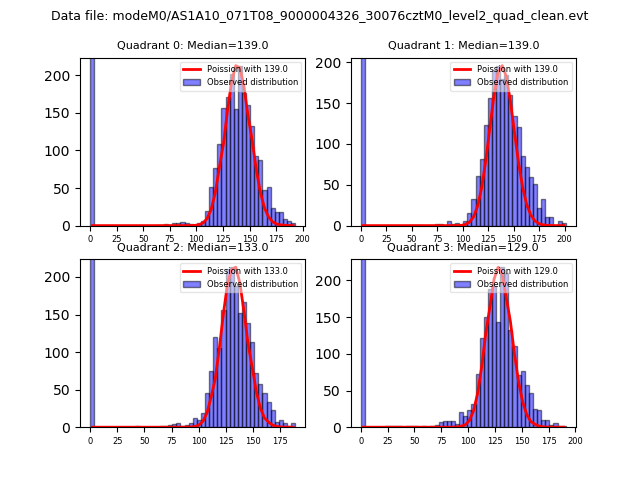 |
 |
| Quadrant-wise count rates Data is divided into 100 sec bins |
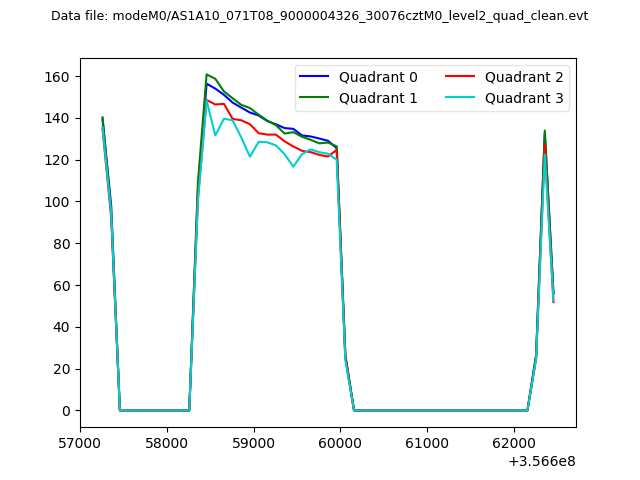 |
|
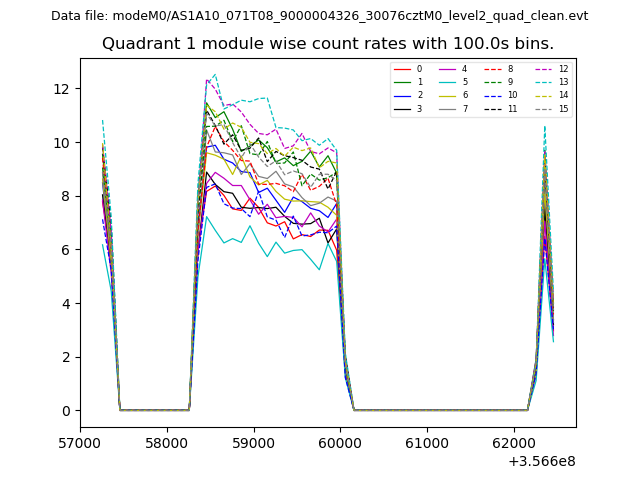
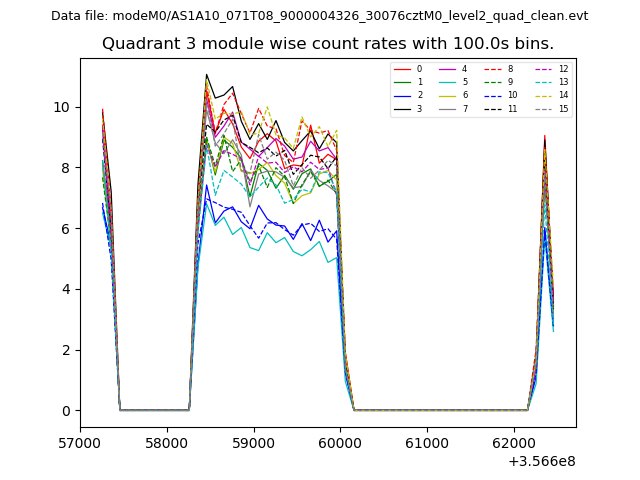
| Module-wise count rates for Quadrant A Data is divided into 100 sec bins |
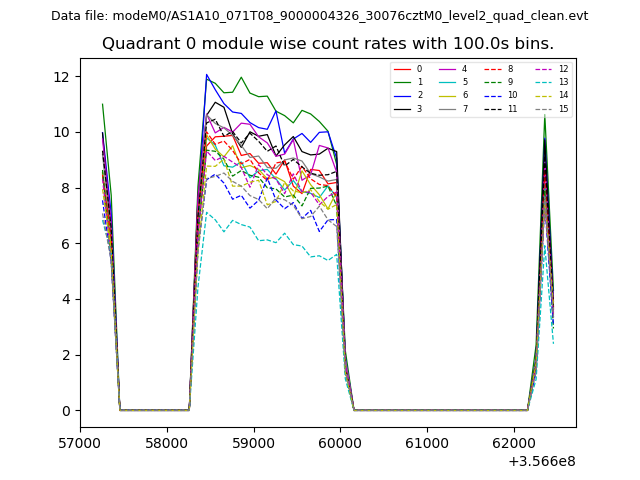 |
 |
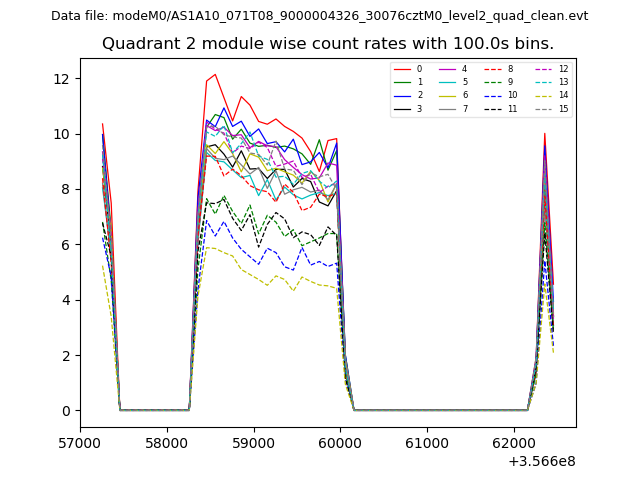
| Module-wise count rates for Quadrant B Data is divided into 100 sec bins |
 |
 |
| Module-wise count rates for Quadrant C Data is divided into 100 sec bins |
 |
 |
| Module-wise count rates for Quadrant D Data is divided into 100 sec bins |
 |
 |
| Parameter | Plot |
|---|---|
| CZT HV Monitor | 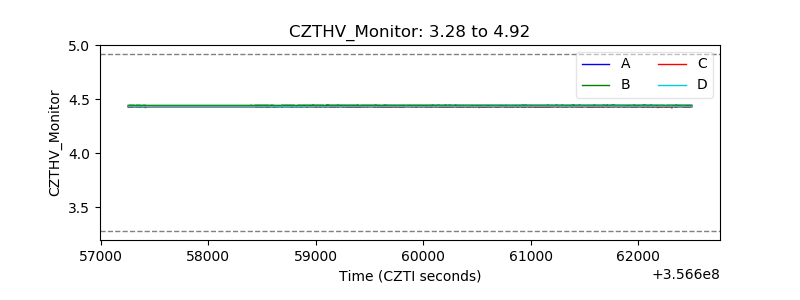 |
| D_VDD | 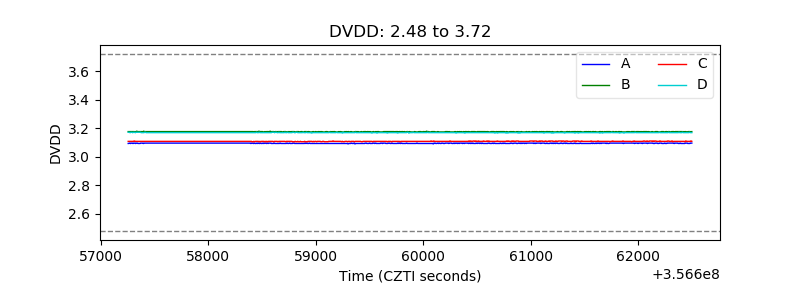 |
| Temperature 1 | 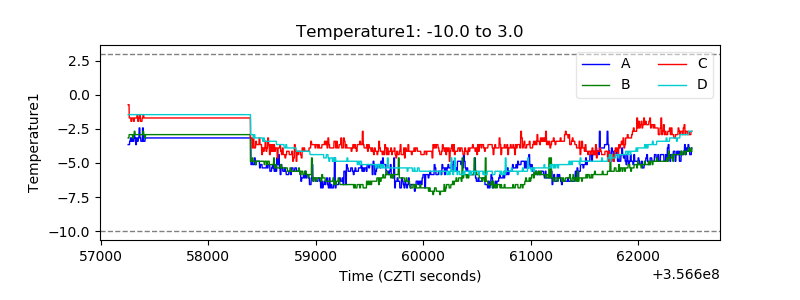 |
| Veto HV Monitor | 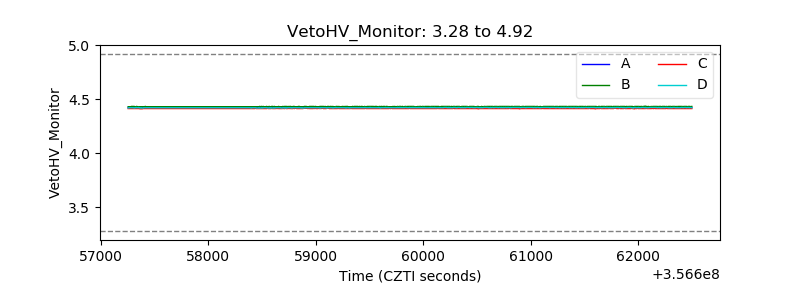 |
| Veto LLD | 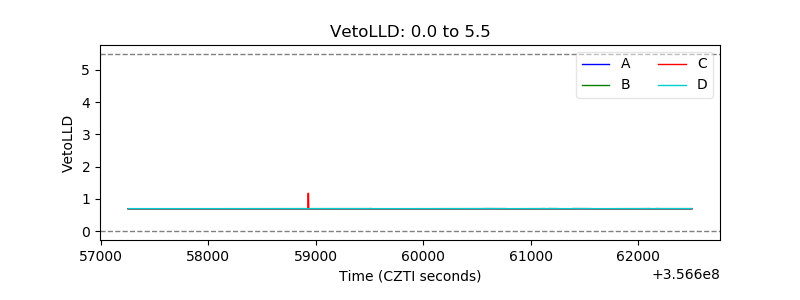 |
| Alpha Counter | 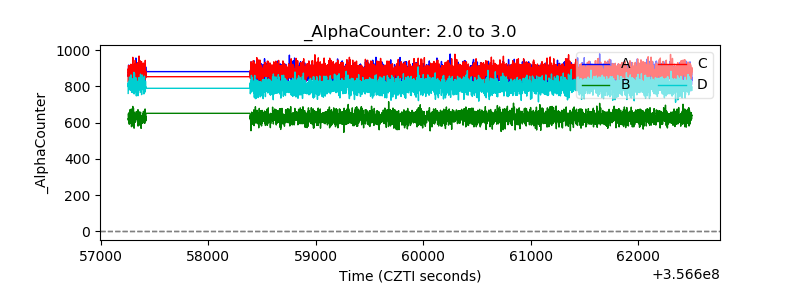 |
| _CPM_Rate | 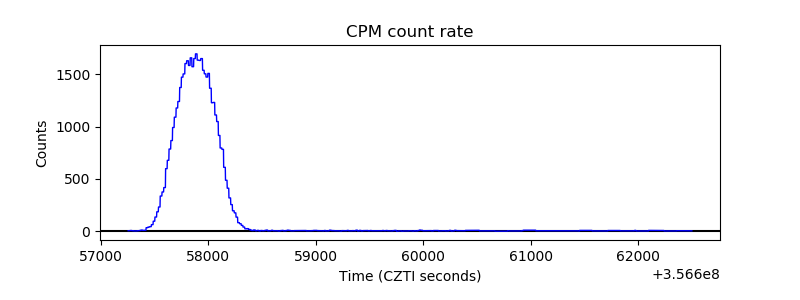 |
| CZT Counter | 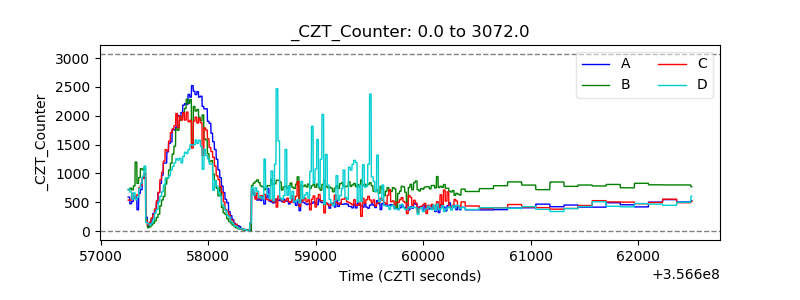 |
| +2.5 Volts monitor |  |
| +5 Volts monitor |  |
| _ROLL_ROT | 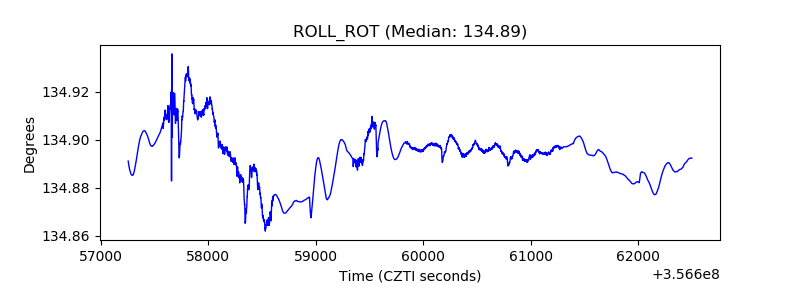 |
| _Roll_DEC | 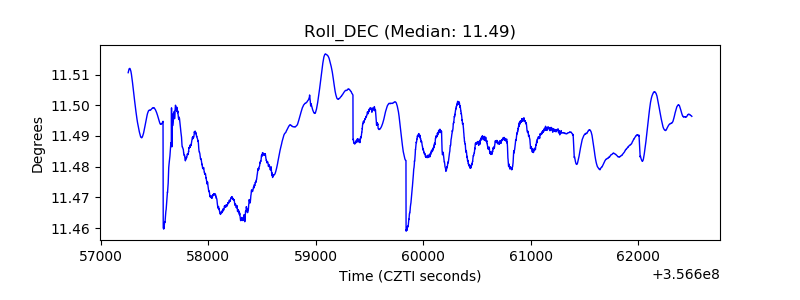 |
| _Roll_RA | 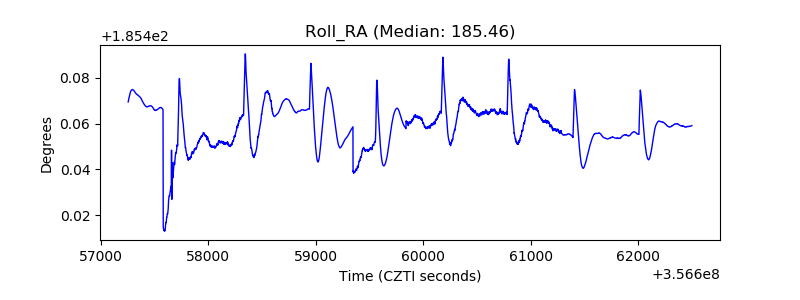 |
| Veto Counter | 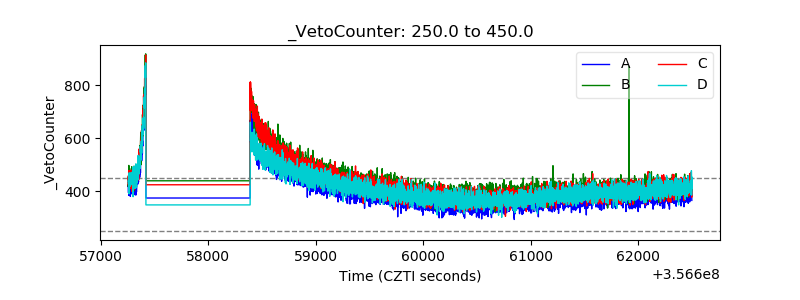 |