| Param | Original file | Final file |
|---|---|---|
| Filename | modeM0/AS1A10_050T05_9000004330cztM0_level2.fits | modeM0/AS1A10_050T05_9000004330cztM0_level2_quad_clean.evt |
| Size (bytes) | 543,859,200 | 368,919,360 |
| Size | 518.7 MB | 351.8 MB |
| Events in quadrant A | 3,421,320 | 1,987,087 |
| Events in quadrant B | 3,154,694 | 1,938,000 |
| Events in quadrant C | 3,300,426 | 1,866,660 |
| Events in quadrant D | 2,918,014 | 1,702,672 |
| Mode SS | |||
|---|---|---|---|
| Quadrant | BADHDUFLAG | Total packets | Discarded packets |
| A | 0 | 1094 | 0 |
| B | 0 | 1094 | 0 |
| C | 0 | 1094 | 0 |
| D | 0 | 1094 | 0 |
| Mode M9 | |||
|---|---|---|---|
| Quadrant | BADHDUFLAG | Total packets | Discarded packets |
| A | 0 | 103 | 0 |
| B | 0 | 103 | 0 |
| C | 0 | 103 | 0 |
| D | 0 | 103 | 0 |
| Mode M0 | |||
|---|---|---|---|
| Quadrant | BADHDUFLAG | Total packets | Discarded packets |
| A | 0 | 113707 | 0 |
| B | 0 | 171586 | 0 |
| C | 0 | 113299 | 0 |
| D | 0 | 131169 | 0 |
| Quadrant | Total seconds | Saturated seconds | Saturation percentage |
|---|---|---|---|
| A | 53568 | 488 | 0.910992% |
| B | 53568 | 1772 | 3.307945% |
| C | 53568 | 1016 | 1.896655% |
| D | 53568 | 1928 | 3.599164% |
Noise dominated data is calculated using 1-second bins in cleaned event files. If a bin has >2000 counts, and if more than 50% of those come from <1% of pixels, then it is considered to be noise-dominated and hence unusable.
| Quadrant | # 1 sec bins | Bins with >0 counts | Bins with >2000 counts | High rate bins dominated by noise | Noise dominated (total time) | Noise dominated (detector-on time) | Marked lightcurve |
|---|---|---|---|---|---|---|---|
| A | 63933 | 53568 | 0 | 0 | 0.00% | 0.00% |  |
| B | 63933 | 53564 | 0 | 0 | 0.00% | 0.00% | 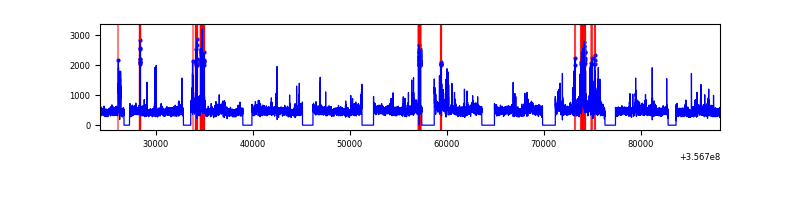 |
| C | 63933 | 53567 | 0 | 0 | 0.00% | 0.00% |  |
| D | 63933 | 53555 | 0 | 0 | 0.00% | 0.00% |  |
Top three noisy pixels from each quadrant. If the there are fewer than three noisy pixels in the level2.evt file, extra rows are filled as -1
| Pixel properties | Quadrant properties | ||||||
|---|---|---|---|---|---|---|---|
| Quadrant | DetID | PixID | Counts | Sigma | Mean | Median | Sigma |
| A | 0 | 29 | 2741 | 8.66 | 891 | 837 | 219.9 |
| A | 14 | 239 | 2653 | 8.26 | 891 | 837 | 219.9 |
| A | 7 | 110 | 2551 | 7.8 | 891 | 837 | 219.9 |
| B | 2 | 9 | 2593 | 10.94 | 835 | 798 | 164.0 |
| B | 2 | 8 | 2114 | 8.02 | 835 | 798 | 164.0 |
| B | 3 | 17 | 2096 | 7.91 | 835 | 798 | 164.0 |
| C | 12 | 241 | 2263 | 6.52 | 873 | 821 | 221.2 |
| C | 9 | 233 | 2223 | 6.34 | 873 | 821 | 221.2 |
| C | 3 | 126 | 2192 | 6.2 | 873 | 821 | 221.2 |
| D | 15 | 46 | 2179 | 6.42 | 833 | 762 | 220.8 |
| D | 3 | 14 | 2143 | 6.25 | 833 | 762 | 220.8 |
| D | 10 | 189 | 2099 | 6.05 | 833 | 762 | 220.8 |
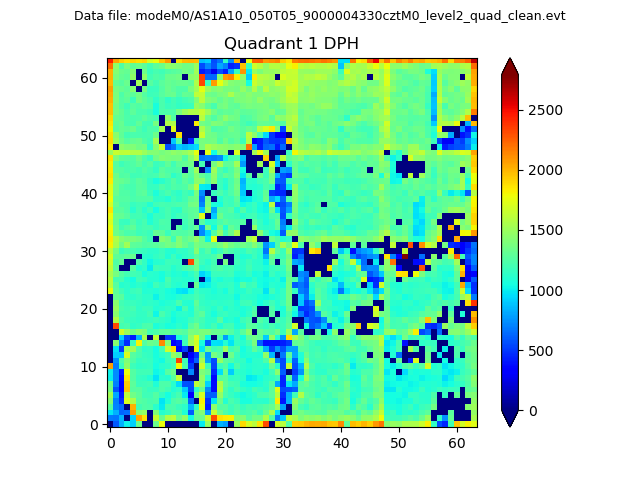
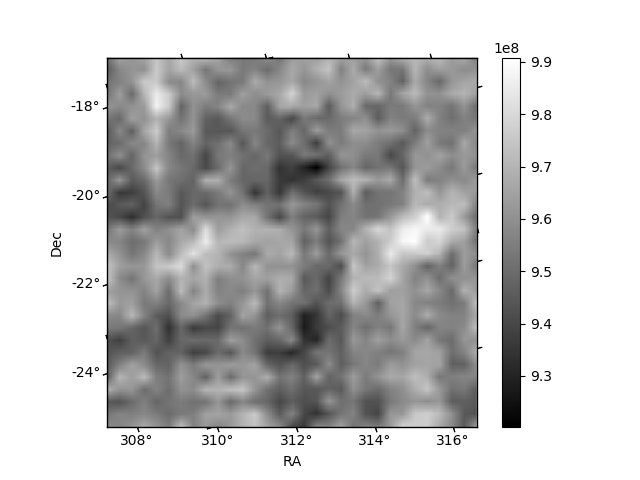
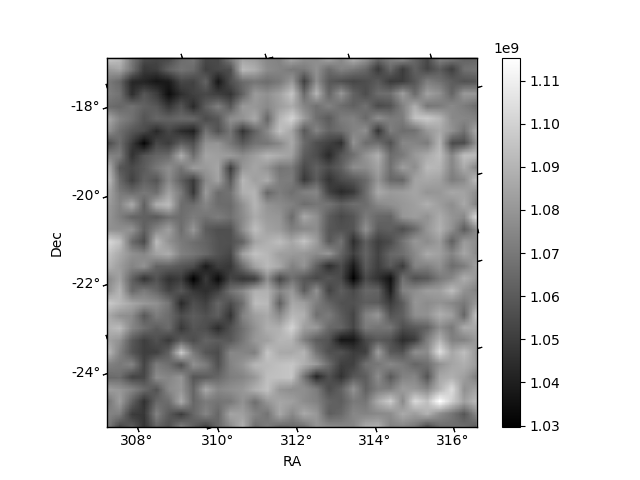
Histogram calculated using DETX and DETY for each event in the final _common_clean file
| Quadrant A |  |
 |
Quadrant B |
|---|---|---|---|
| Quadrant D | 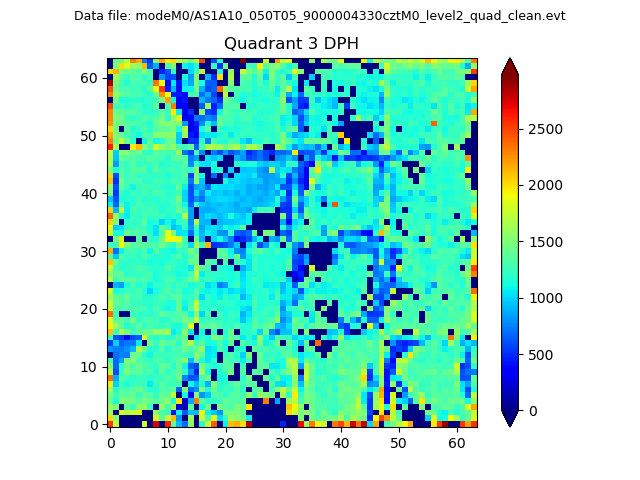 |
 |
Quadrant C |
| Plot type | Count rate plots | Images |
|---|---|---|
| Comparison with Poisson distribution Blue bars denote a histogram of data divided into 1 sec bins. Red curve is a Poisson curve with rate = median count rate of data. |
 |
 |
| Quadrant-wise count rates Data is divided into 100 sec bins |
 |
|
| Module-wise count rates for Quadrant A Data is divided into 100 sec bins |
 |
 |
| Module-wise count rates for Quadrant B Data is divided into 100 sec bins |
 |
 |
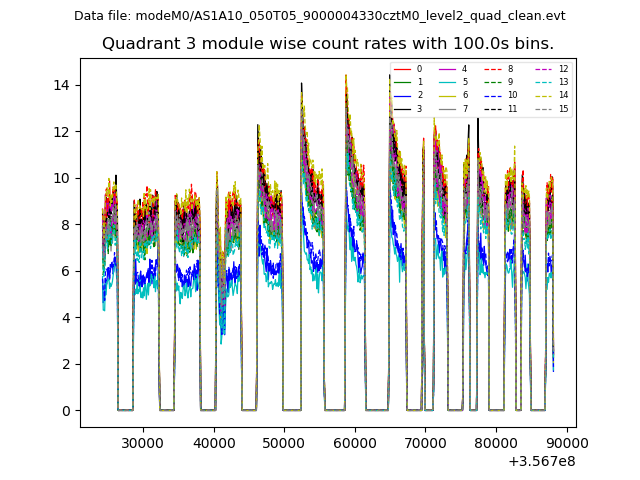
| Module-wise count rates for Quadrant C Data is divided into 100 sec bins |
 |
 |
| Module-wise count rates for Quadrant D Data is divided into 100 sec bins |
 |
 |
| Parameter | Plot |
|---|---|
| CZT HV Monitor | 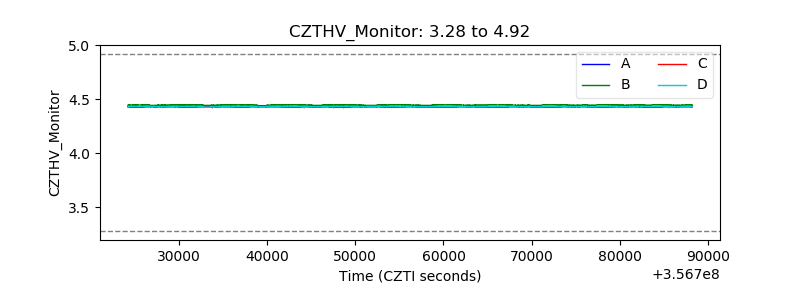 |
| D_VDD | 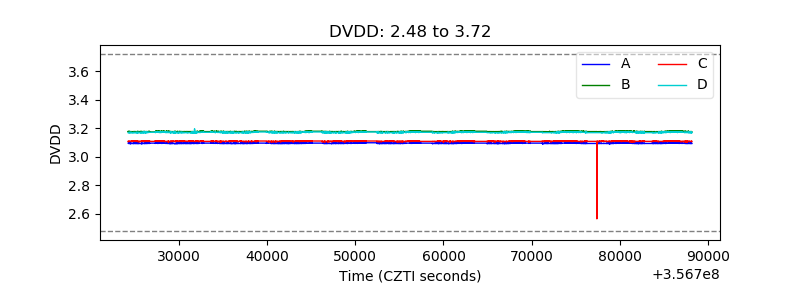 |
| Temperature 1 |  |
| Veto HV Monitor |  |
| Veto LLD |  |
| Alpha Counter | 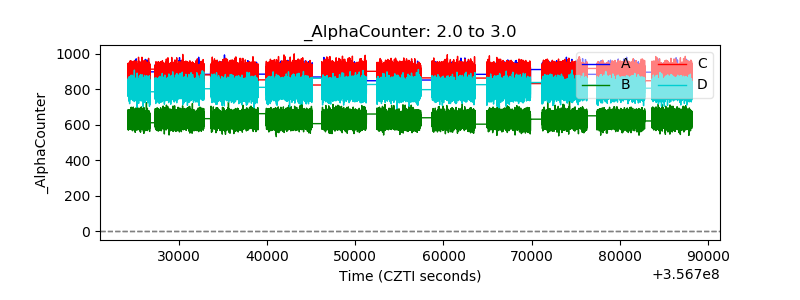 |
| _CPM_Rate |  |
| CZT Counter | 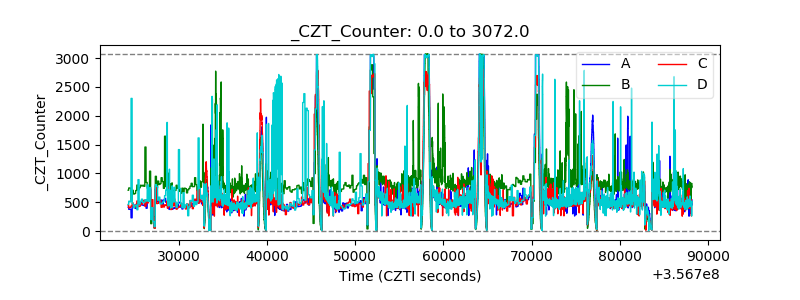 |
| +2.5 Volts monitor |  |
| +5 Volts monitor |  |
| _ROLL_ROT |  |
| _Roll_DEC |  |
| _Roll_RA | 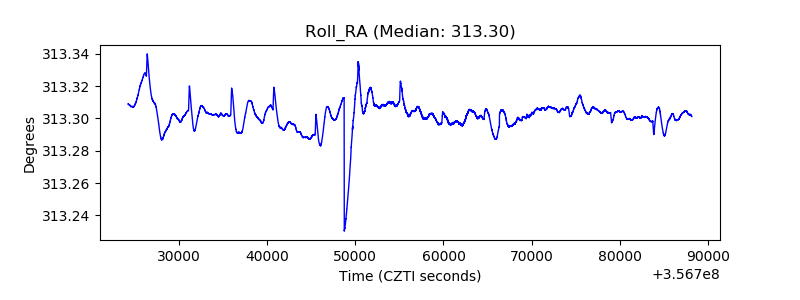 |
| Veto Counter |  |