| Param | Original file | Final file |
|---|---|---|
| Filename | modeM0/AS1A10_050T05_9000004330_30091cztM0_level2.evt | modeM0/AS1A10_050T05_9000004330_30091cztM0_level2_quad_clean.evt |
| Size (bytes) | 517,622,400 | 108,348,480 |
| Size | 493.6 MB | 103.3 MB |
| Events in quadrant A | 3,166,485 | 716,351 |
| Events in quadrant B | 5,189,318 | 725,019 |
| Events in quadrant C | 3,326,828 | 705,026 |
| Events in quadrant D | 3,563,721 | 692,316 |
| Mode SS | |||
|---|---|---|---|
| Quadrant | BADHDUFLAG | Total packets | Discarded packets |
| A | 0 | 130 | 0 |
| B | 0 | 130 | 0 |
| C | 0 | 130 | 0 |
| D | 0 | 130 | 0 |
| Mode M9 | |||
|---|---|---|---|
| Quadrant | BADHDUFLAG | Total packets | Discarded packets |
| A | 0 | 11 | 0 |
| B | 0 | 11 | 0 |
| C | 0 | 11 | 0 |
| D | 0 | 11 | 0 |
| Mode M0 | |||
|---|---|---|---|
| Quadrant | BADHDUFLAG | Total packets | Discarded packets |
| A | 0 | 13416 | 2 |
| B | 0 | 19668 | 2 |
| C | 0 | 13891 | 2 |
| D | 0 | 14694 | 2 |
| Quadrant | Total seconds | Saturated seconds | Saturation percentage |
|---|---|---|---|
| A | 6341 | 15 | 0.236556% |
| B | 6342 | 81 | 1.277200% |
| C | 6342 | 100 | 1.576790% |
| D | 6342 | 54 | 0.851466% |
Noise dominated data is calculated using 1-second bins in cleaned event files. If a bin has >2000 counts, and if more than 50% of those come from <1% of pixels, then it is considered to be noise-dominated and hence unusable.
| Quadrant | # 1 sec bins | Bins with >0 counts | Bins with >2000 counts | High rate bins dominated by noise | Noise dominated (total time) | Noise dominated (detector-on time) | Marked lightcurve |
|---|---|---|---|---|---|---|---|
| A | 7526 | 6342 | 1 | 1 | 0.01% | 0.02% | 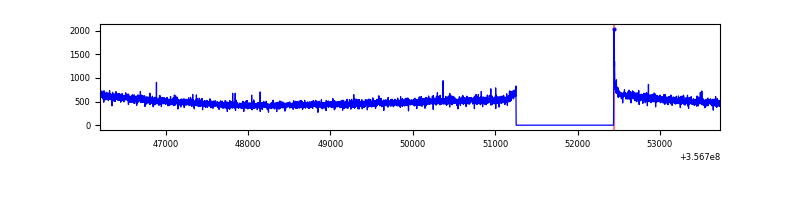 |
| B | 7527 | 6343 | 2 | 2 | 0.03% | 0.03% | 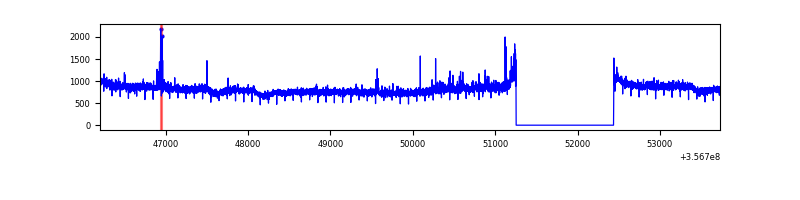 |
| C | 7527 | 6343 | 0 | 0 | 0.00% | 0.00% | 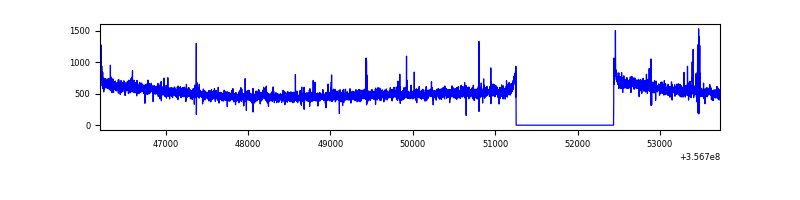 |
| D | 7527 | 6343 | 26 | 26 | 0.35% | 0.41% | 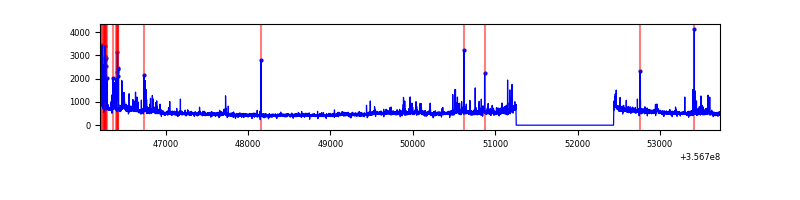 |
Top three noisy pixels from each quadrant. If the there are fewer than three noisy pixels in the level2.evt file, extra rows are filled as -1
| Pixel properties | Quadrant properties | ||||||
|---|---|---|---|---|---|---|---|
| Quadrant | DetID | PixID | Counts | Sigma | Mean | Median | Sigma |
| A | 8 | 192 | 14508 | 84.34 | 816 | 800 | 162.5 |
| A | 13 | 254 | 11988 | 68.84 | 816 | 800 | 162.5 |
| A | 3 | 137 | 7632 | 42.04 | 816 | 800 | 162.5 |
| B | 6 | 159 | 1875440 | 12074.88 | 817 | 797 | 155.3 |
| B | 0 | 229 | 36781 | 231.78 | 817 | 797 | 155.3 |
| B | 0 | 190 | 28883 | 180.91 | 817 | 797 | 155.3 |
| C | 14 | 238 | 146274 | 772.6 | 801 | 808 | 188.3 |
| C | 14 | 254 | 24534 | 126.01 | 801 | 808 | 188.3 |
| C | 3 | 233 | 17945 | 91.02 | 801 | 808 | 188.3 |
| D | 8 | 195 | 119119 | 621.04 | 798 | 782 | 190.5 |
| D | 2 | 250 | 91181 | 474.42 | 798 | 782 | 190.5 |
| D | 13 | 104 | 79653 | 413.92 | 798 | 782 | 190.5 |
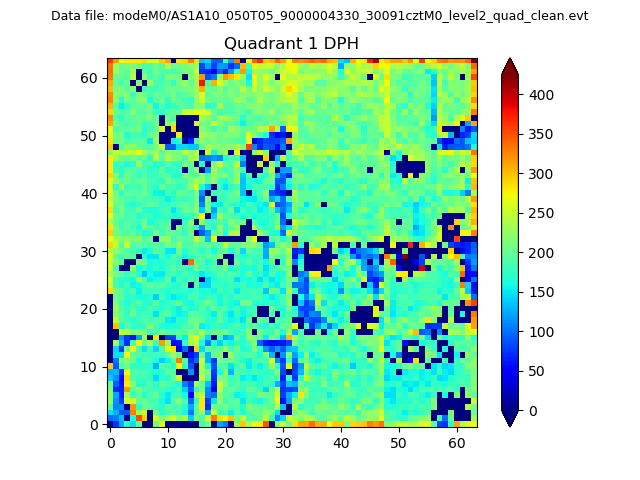
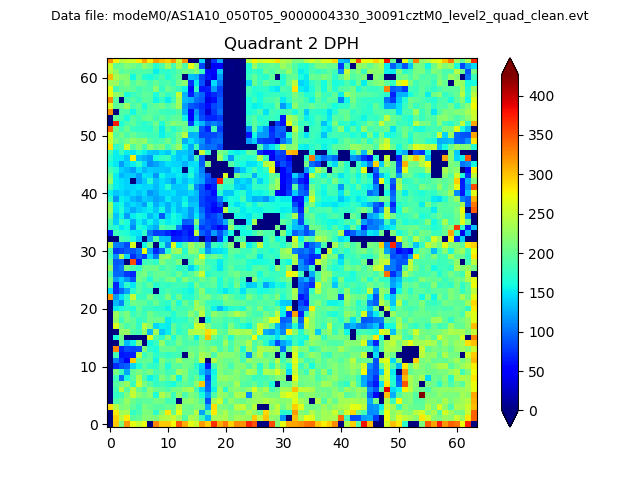
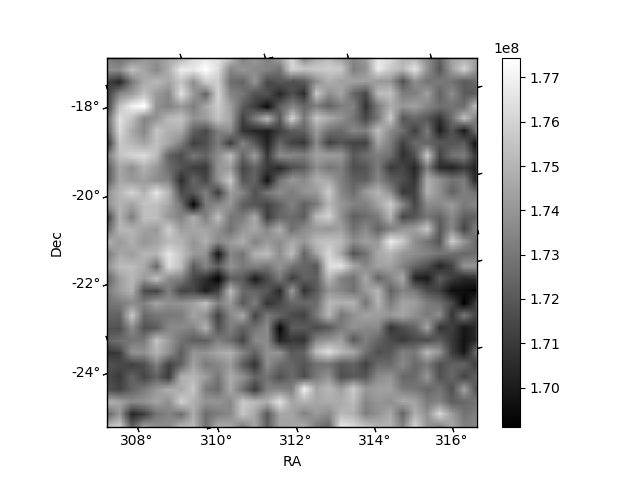
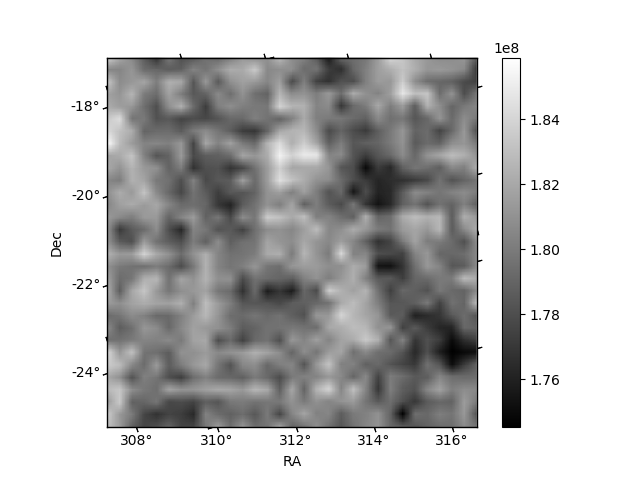
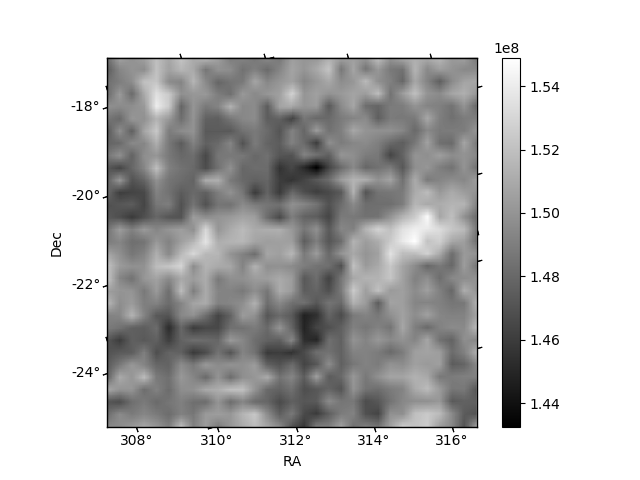
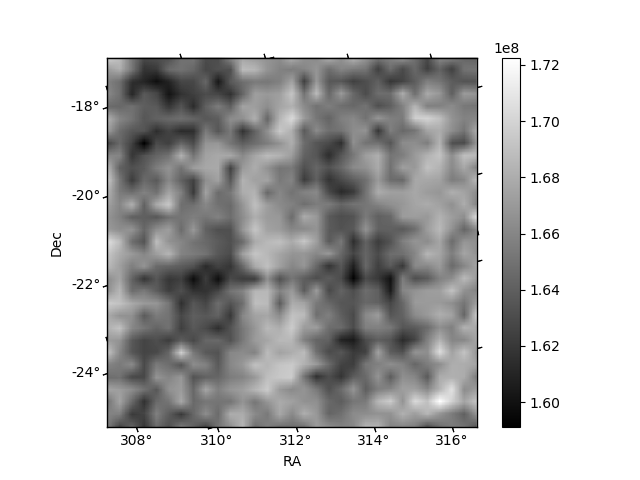
Histogram calculated using DETX and DETY for each event in the final _common_clean file
| Quadrant A |  |
 |
Quadrant B |
|---|---|---|---|
| Quadrant D |  |
 |
Quadrant C |
| Plot type | Count rate plots | Images |
|---|---|---|
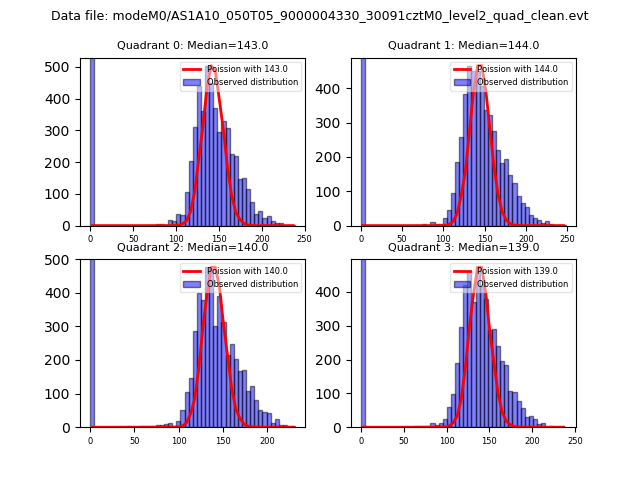
| Comparison with Poisson distribution Blue bars denote a histogram of data divided into 1 sec bins. Red curve is a Poisson curve with rate = median count rate of data. |
 |
 |
| Quadrant-wise count rates Data is divided into 100 sec bins |
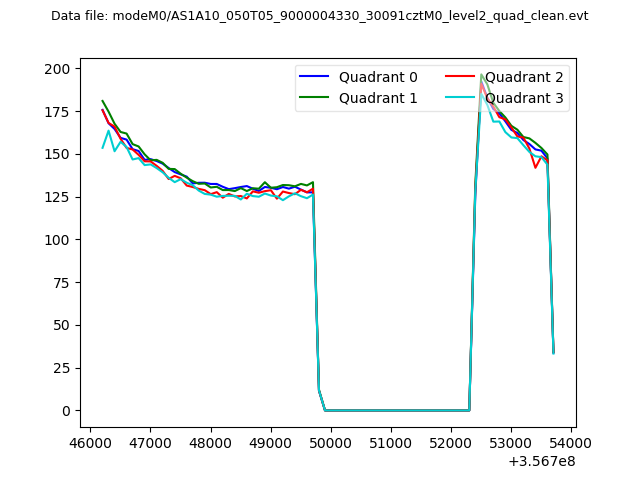 |
|
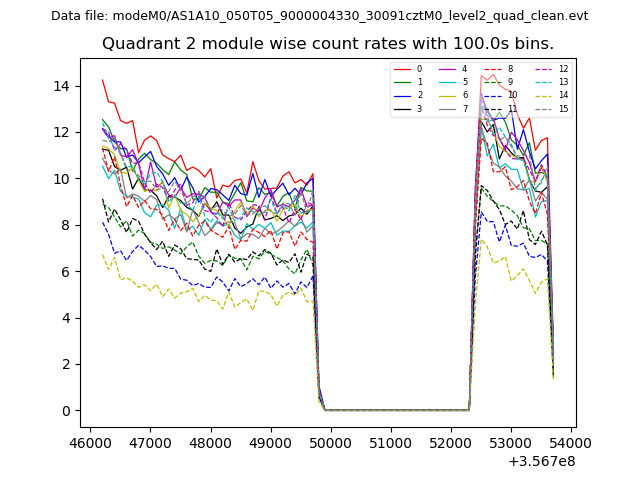
| Module-wise count rates for Quadrant A Data is divided into 100 sec bins |
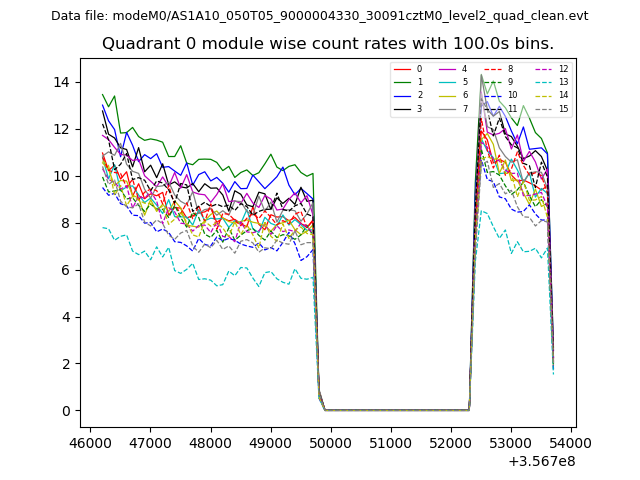 |
 |
| Module-wise count rates for Quadrant B Data is divided into 100 sec bins |
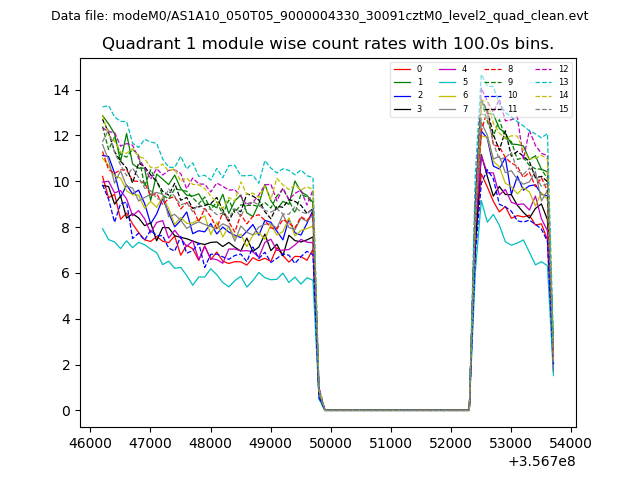 |
 |
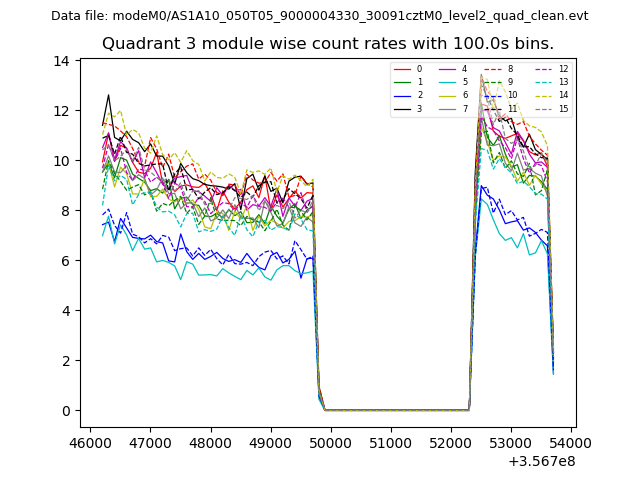
| Module-wise count rates for Quadrant C Data is divided into 100 sec bins |
 |
 |
| Module-wise count rates for Quadrant D Data is divided into 100 sec bins |
 |
 |
| Parameter | Plot |
|---|---|
| CZT HV Monitor | 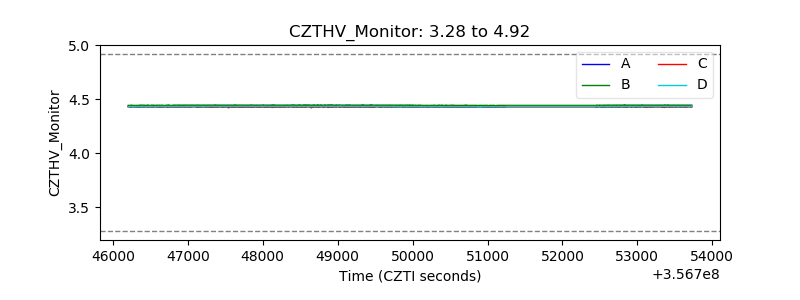 |
| D_VDD | 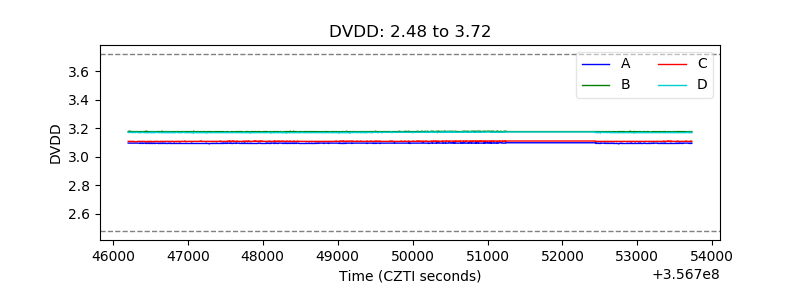 |
| Temperature 1 | 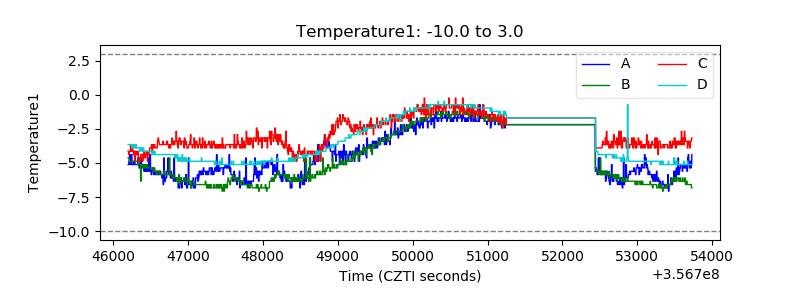 |
| Veto HV Monitor | 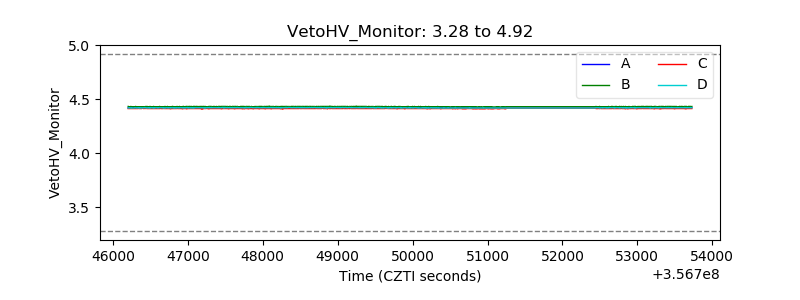 |
| Veto LLD | 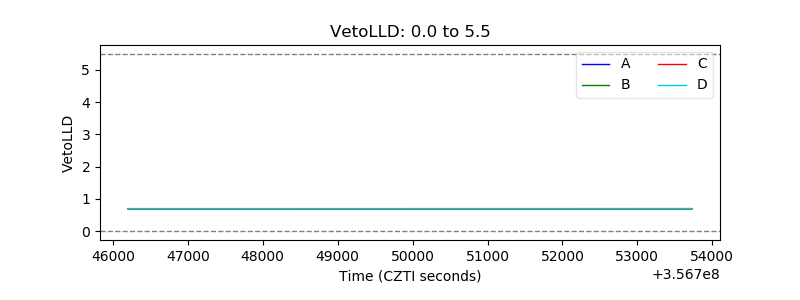 |
| Alpha Counter | 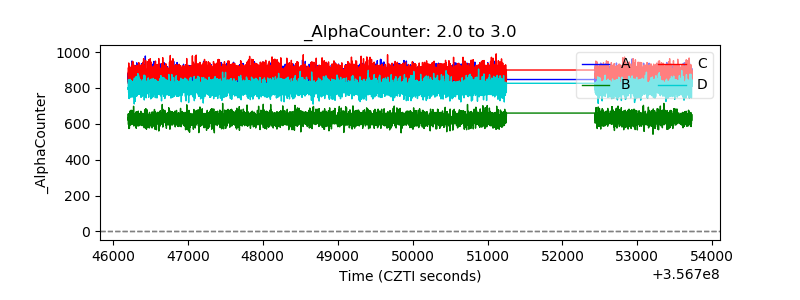 |
| _CPM_Rate | 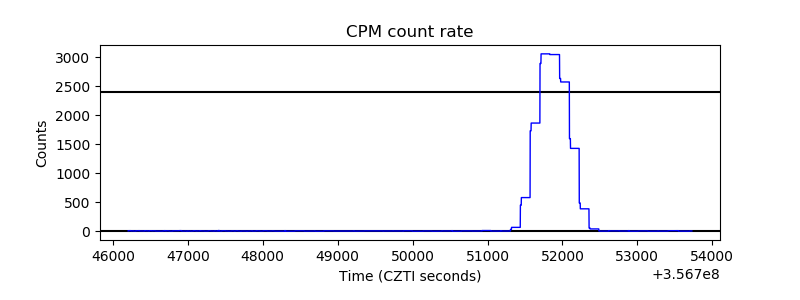 |
| CZT Counter | 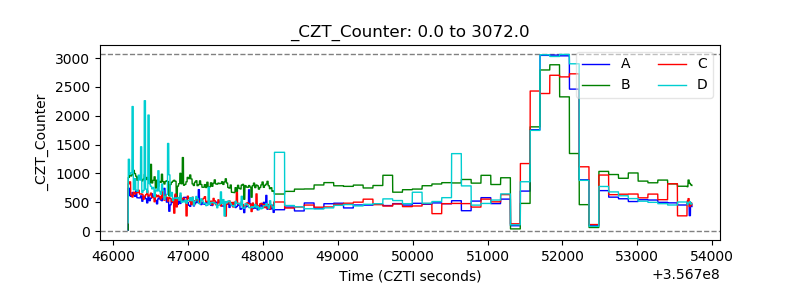 |
| +2.5 Volts monitor |  |
| +5 Volts monitor |  |
| _ROLL_ROT | 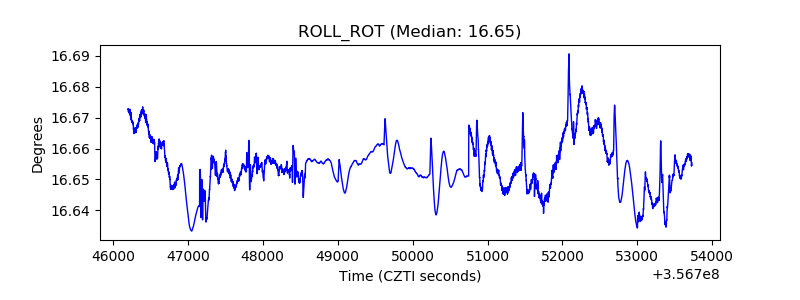 |
| _Roll_DEC | 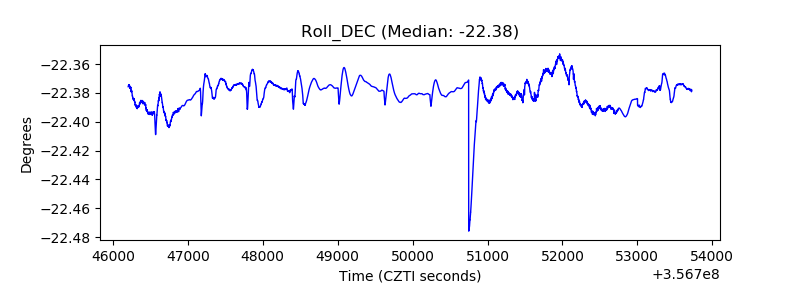 |
| _Roll_RA | 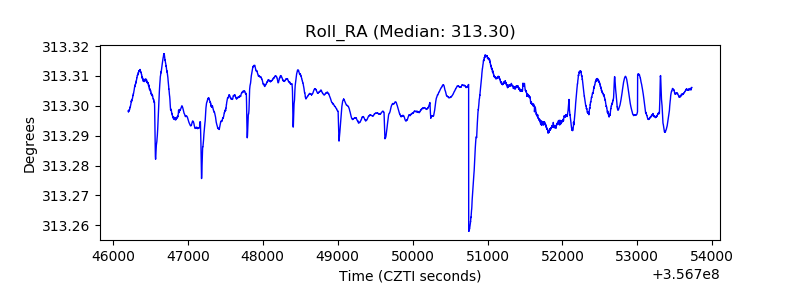 |
| Veto Counter | 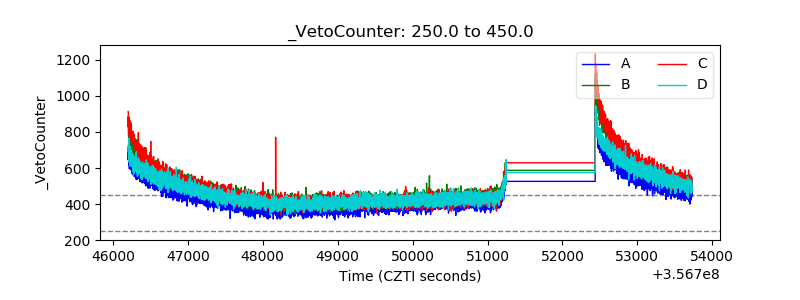 |