| Param | Original file | Final file |
|---|---|---|
| Filename | modeM0/AS1A10_050T05_9000004330_30092cztM0_level2.evt | modeM0/AS1A10_050T05_9000004330_30092cztM0_level2_quad_clean.evt |
| Size (bytes) | 544,919,040 | 107,496,000 |
| Size | 519.7 MB | 102.5 MB |
| Events in quadrant A | 3,351,261 | 710,003 |
| Events in quadrant B | 5,849,532 | 710,699 |
| Events in quadrant C | 3,425,576 | 702,803 |
| Events in quadrant D | 3,449,306 | 691,762 |
| Mode SS | |||
|---|---|---|---|
| Quadrant | BADHDUFLAG | Total packets | Discarded packets |
| A | 0 | 128 | 0 |
| B | 0 | 128 | 0 |
| C | 0 | 128 | 0 |
| D | 0 | 128 | 0 |
| Mode M9 | |||
|---|---|---|---|
| Quadrant | BADHDUFLAG | Total packets | Discarded packets |
| A | 0 | 20 | 0 |
| B | 0 | 21 | 0 |
| C | 0 | 21 | 0 |
| D | 0 | 21 | 0 |
| Mode M0 | |||
|---|---|---|---|
| Quadrant | BADHDUFLAG | Total packets | Discarded packets |
| A | 0 | 13888 | 2 |
| B | 0 | 21613 | 2 |
| C | 0 | 14070 | 2 |
| D | 0 | 14186 | 2 |
| Quadrant | Total seconds | Saturated seconds | Saturation percentage |
|---|---|---|---|
| A | 6310 | 39 | 0.618067% |
| B | 6310 | 320 | 5.071315% |
| C | 6310 | 102 | 1.616482% |
| D | 6310 | 23 | 0.364501% |
Noise dominated data is calculated using 1-second bins in cleaned event files. If a bin has >2000 counts, and if more than 50% of those come from <1% of pixels, then it is considered to be noise-dominated and hence unusable.
| Quadrant | # 1 sec bins | Bins with >0 counts | Bins with >2000 counts | High rate bins dominated by noise | Noise dominated (total time) | Noise dominated (detector-on time) | Marked lightcurve |
|---|---|---|---|---|---|---|---|
| A | 7595 | 6311 | 7 | 7 | 0.09% | 0.11% | 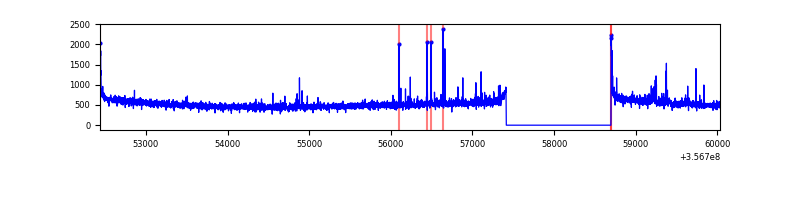 |
| B | 7595 | 6311 | 175 | 175 | 2.30% | 2.77% | 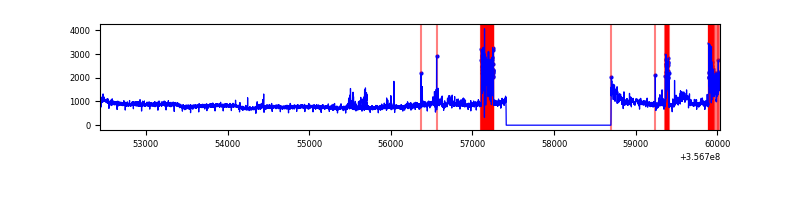 |
| C | 7595 | 6311 | 0 | 0 | 0.00% | 0.00% | 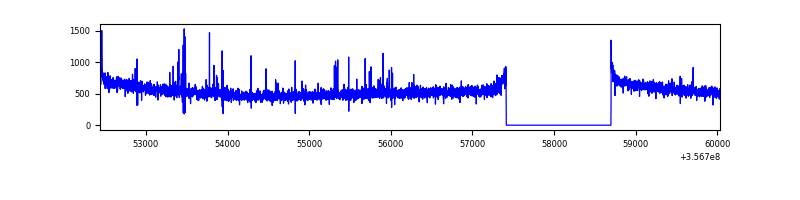 |
| D | 7595 | 6311 | 9 | 9 | 0.12% | 0.14% | 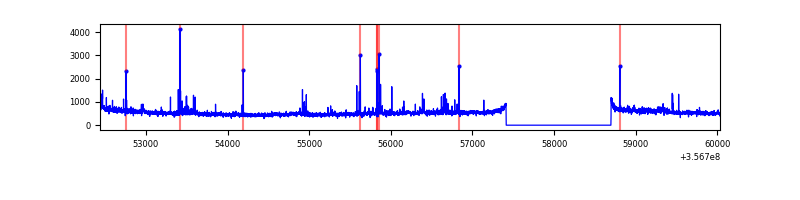 |
Top three noisy pixels from each quadrant. If the there are fewer than three noisy pixels in the level2.evt file, extra rows are filled as -1
| Pixel properties | Quadrant properties | ||||||
|---|---|---|---|---|---|---|---|
| Quadrant | DetID | PixID | Counts | Sigma | Mean | Median | Sigma |
| A | 0 | 13 | 98911 | 594.24 | 836 | 822 | 165.1 |
| A | 8 | 192 | 24732 | 144.85 | 836 | 822 | 165.1 |
| A | 13 | 254 | 11873 | 66.95 | 836 | 822 | 165.1 |
| B | 6 | 159 | 1815450 | 11840.88 | 820 | 799 | 153.3 |
| B | 0 | 229 | 725020 | 4725.66 | 820 | 799 | 153.3 |
| B | 0 | 190 | 82508 | 533.16 | 820 | 799 | 153.3 |
| C | 14 | 238 | 156193 | 812.33 | 821 | 828 | 191.3 |
| C | 14 | 254 | 34842 | 177.84 | 821 | 828 | 191.3 |
| C | 2 | 114 | 15002 | 74.11 | 821 | 828 | 191.3 |
| D | 8 | 195 | 118771 | 609.14 | 823 | 808 | 193.7 |
| D | 13 | 104 | 38515 | 194.71 | 823 | 808 | 193.7 |
| D | 2 | 250 | 31438 | 158.17 | 823 | 808 | 193.7 |
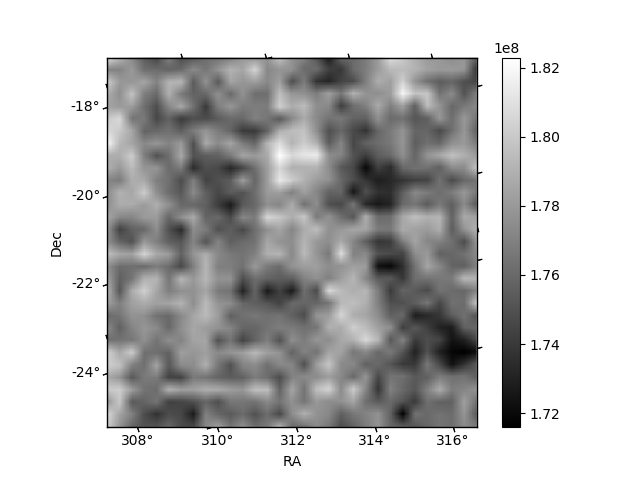
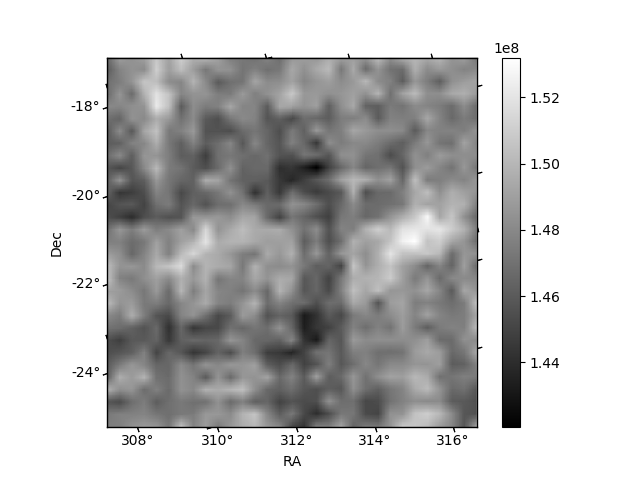
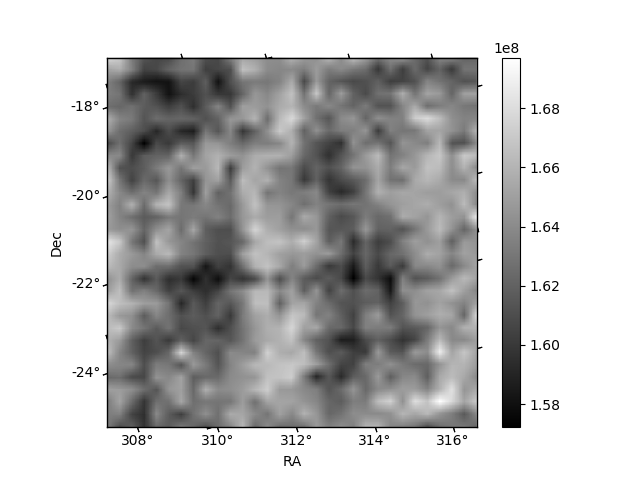
Histogram calculated using DETX and DETY for each event in the final _common_clean file
| Quadrant A |  |
 |
Quadrant B |
|---|---|---|---|
| Quadrant D |  |
 |
Quadrant C |
| Plot type | Count rate plots | Images |
|---|---|---|
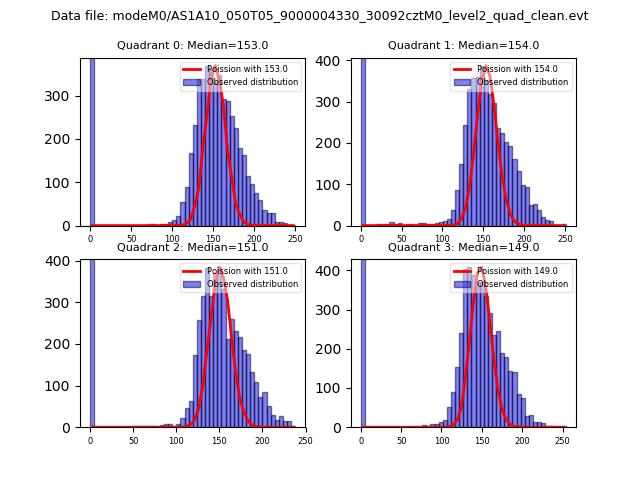
| Comparison with Poisson distribution Blue bars denote a histogram of data divided into 1 sec bins. Red curve is a Poisson curve with rate = median count rate of data. |
 |
 |
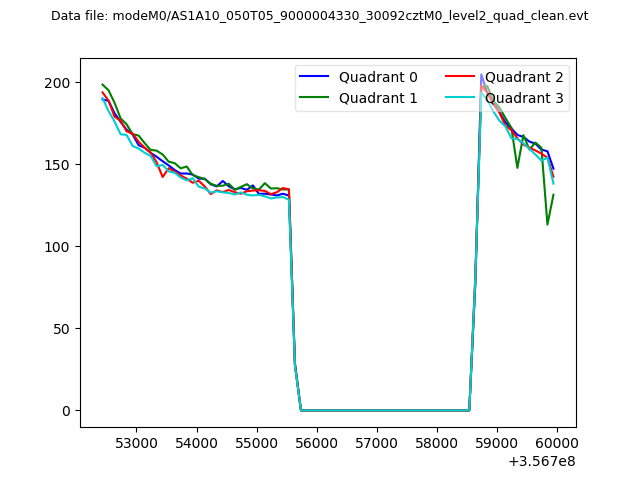
| Quadrant-wise count rates Data is divided into 100 sec bins |
 |
|
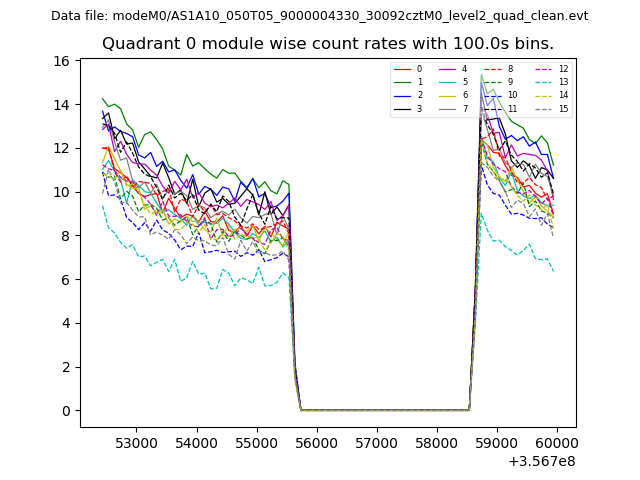
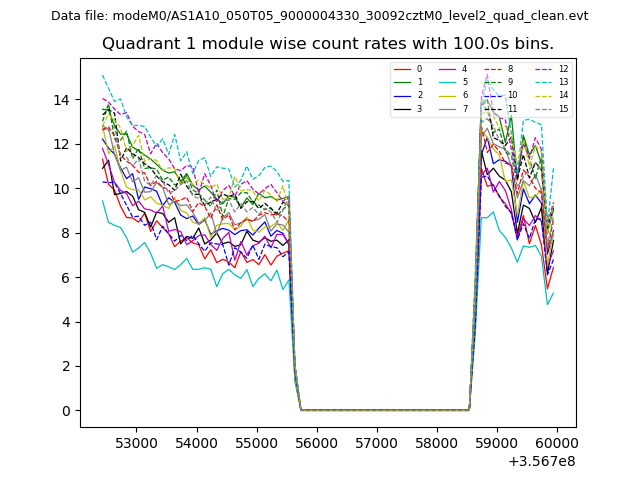
| Module-wise count rates for Quadrant A Data is divided into 100 sec bins |
 |
 |
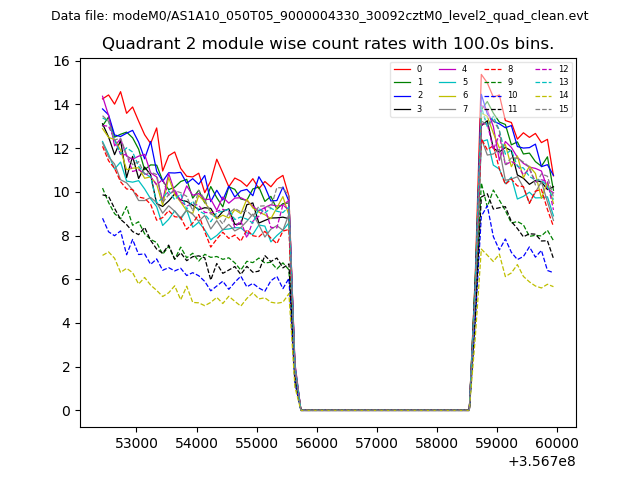
| Module-wise count rates for Quadrant B Data is divided into 100 sec bins |
 |
 |
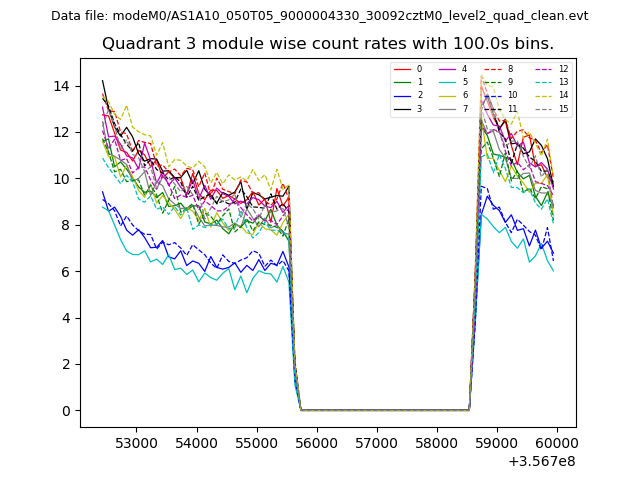
| Module-wise count rates for Quadrant C Data is divided into 100 sec bins |
 |
 |
| Module-wise count rates for Quadrant D Data is divided into 100 sec bins |
 |
 |
| Parameter | Plot |
|---|---|
| CZT HV Monitor | 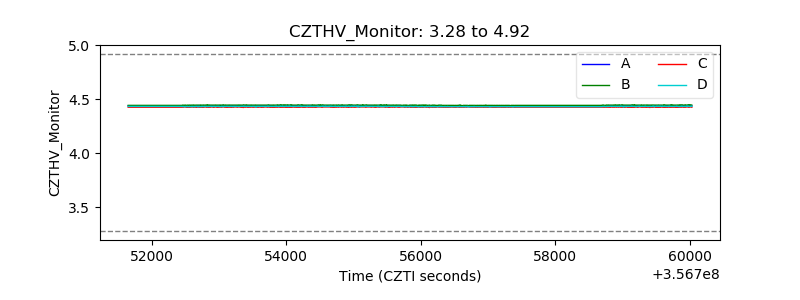 |
| D_VDD | 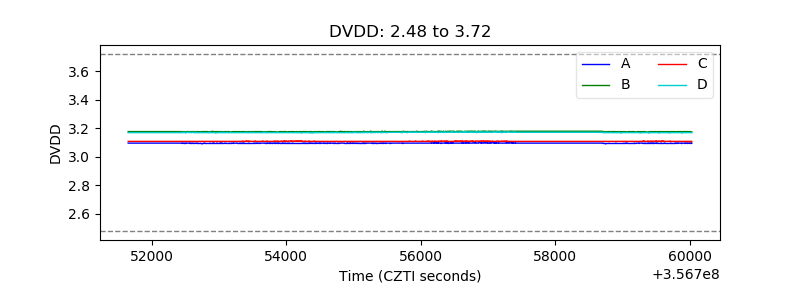 |
| Temperature 1 | 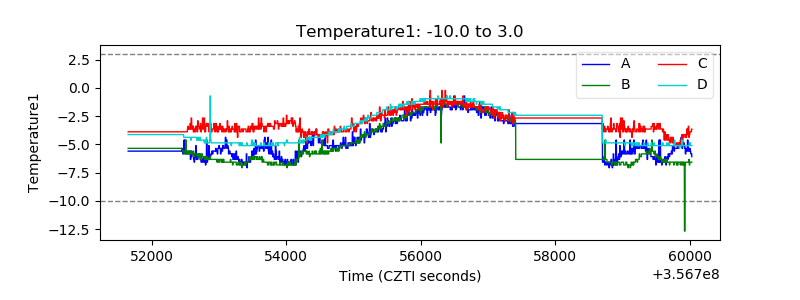 |
| Veto HV Monitor | 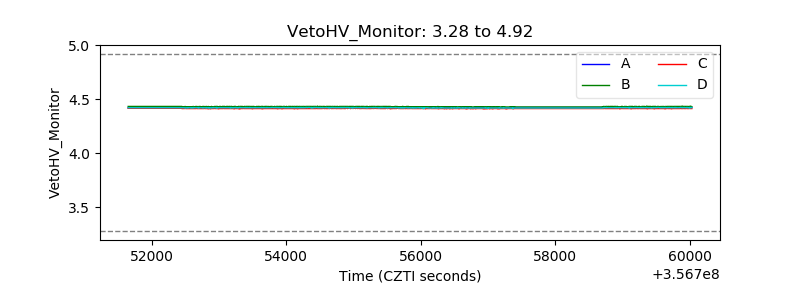 |
| Veto LLD | 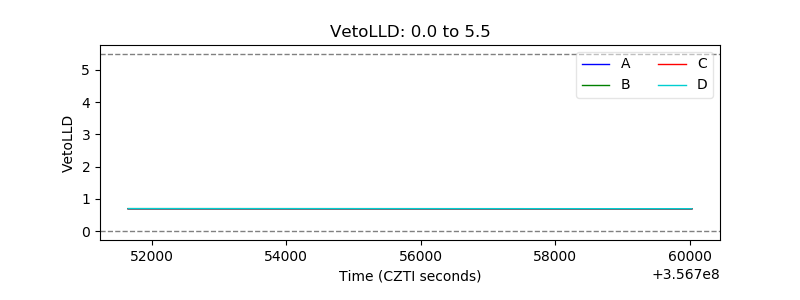 |
| Alpha Counter | 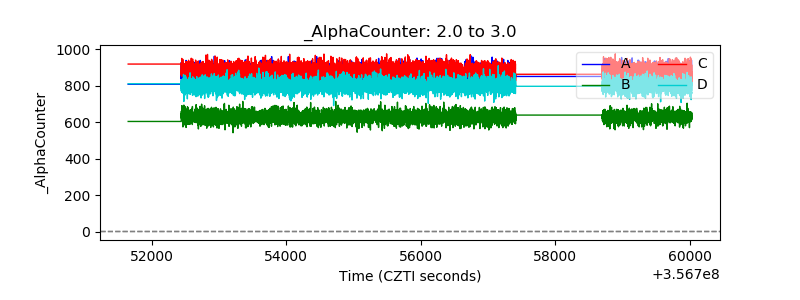 |
| _CPM_Rate | 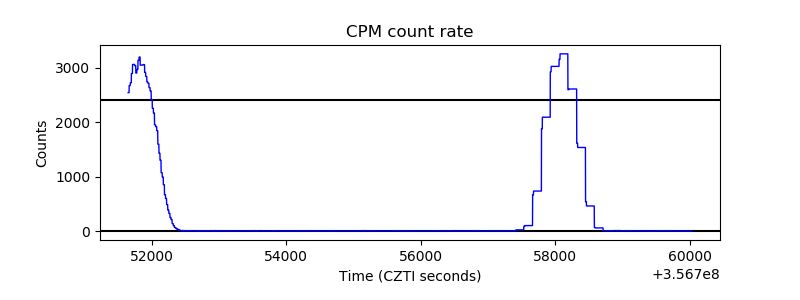 |
| CZT Counter |  |
| +2.5 Volts monitor |  |
| +5 Volts monitor | 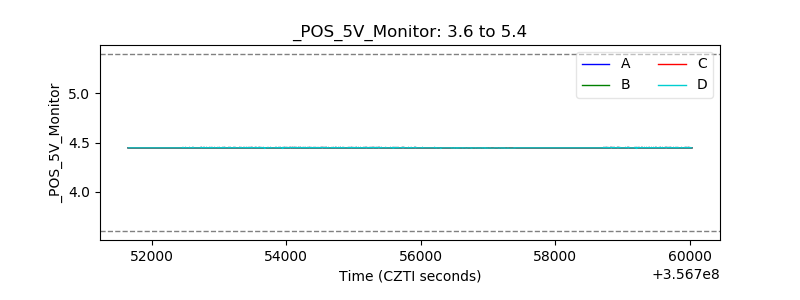 |
| _ROLL_ROT | 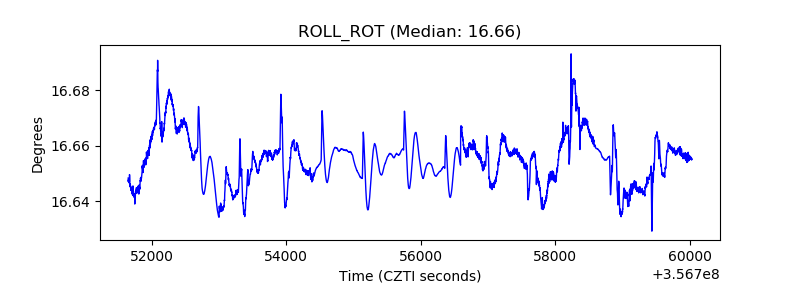 |
| _Roll_DEC |  |
| _Roll_RA |  |
| Veto Counter | 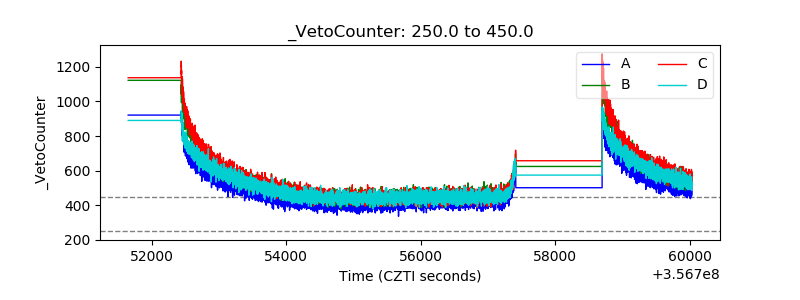 |