| Param | Original file | Final file |
|---|---|---|
| Filename | modeM0/AS1A10_050T05_9000004330_30095cztM0_level2.evt | modeM0/AS1A10_050T05_9000004330_30095cztM0_level2_quad_clean.evt |
| Size (bytes) | 579,032,640 | 99,567,360 |
| Size | 552.2 MB | 95.0 MB |
| Events in quadrant A | 3,567,545 | 650,580 |
| Events in quadrant B | 6,338,180 | 645,850 |
| Events in quadrant C | 3,519,510 | 623,689 |
| Events in quadrant D | 3,656,645 | 627,532 |
| Mode SS | |||
|---|---|---|---|
| Quadrant | BADHDUFLAG | Total packets | Discarded packets |
| A | 0 | 136 | 0 |
| B | 0 | 136 | 0 |
| C | 0 | 136 | 0 |
| D | 0 | 136 | 0 |
| Mode M9 | |||
|---|---|---|---|
| Quadrant | BADHDUFLAG | Total packets | Discarded packets |
| A | 0 | 11 | 0 |
| B | 0 | 11 | 0 |
| C | 0 | 11 | 0 |
| D | 0 | 11 | 0 |
| Mode M0 | |||
|---|---|---|---|
| Quadrant | BADHDUFLAG | Total packets | Discarded packets |
| A | 0 | 14519 | 1 |
| B | 0 | 23311 | 1 |
| C | 0 | 14332 | 1 |
| D | 0 | 14841 | 1 |
| Quadrant | Total seconds | Saturated seconds | Saturation percentage |
|---|---|---|---|
| A | 6707 | 116 | 1.729536% |
| B | 6708 | 438 | 6.529517% |
| C | 6708 | 190 | 2.832439% |
| D | 6708 | 93 | 1.386404% |
Noise dominated data is calculated using 1-second bins in cleaned event files. If a bin has >2000 counts, and if more than 50% of those come from <1% of pixels, then it is considered to be noise-dominated and hence unusable.
| Quadrant | # 1 sec bins | Bins with >0 counts | Bins with >2000 counts | High rate bins dominated by noise | Noise dominated (total time) | Noise dominated (detector-on time) | Marked lightcurve |
|---|---|---|---|---|---|---|---|
| A | 7802 | 6708 | 6 | 6 | 0.08% | 0.09% | 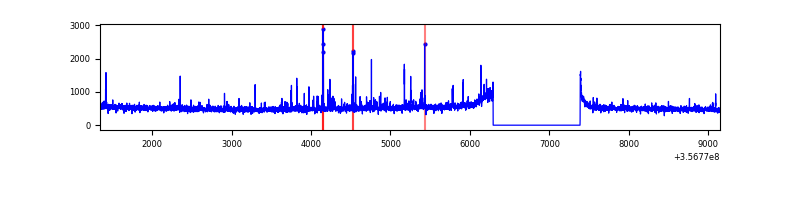 |
| B | 7803 | 6709 | 203 | 203 | 2.60% | 3.03% | 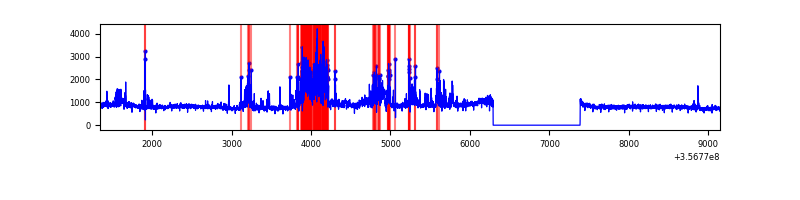 |
| C | 7803 | 6709 | 0 | 0 | 0.00% | 0.00% | 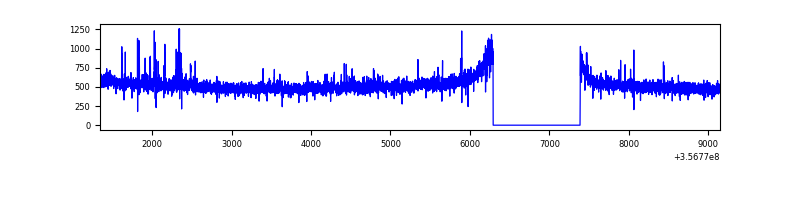 |
| D | 7803 | 6709 | 19 | 19 | 0.24% | 0.28% | 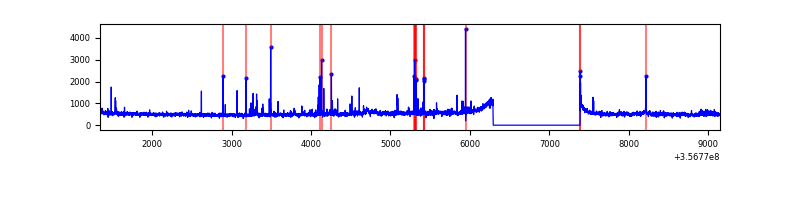 |
Top three noisy pixels from each quadrant. If the there are fewer than three noisy pixels in the level2.evt file, extra rows are filled as -1
| Pixel properties | Quadrant properties | ||||||
|---|---|---|---|---|---|---|---|
| Quadrant | DetID | PixID | Counts | Sigma | Mean | Median | Sigma |
| A | 0 | 13 | 150123 | 849.42 | 883 | 867 | 175.7 |
| A | 13 | 254 | 12481 | 66.1 | 883 | 867 | 175.7 |
| A | 8 | 192 | 11020 | 57.78 | 883 | 867 | 175.7 |
| B | 6 | 159 | 1917778 | 11670.72 | 856 | 835 | 164.3 |
| B | 0 | 229 | 917042 | 5578.04 | 856 | 835 | 164.3 |
| B | 0 | 190 | 86664 | 522.54 | 856 | 835 | 164.3 |
| C | 14 | 238 | 157786 | 798.5 | 842 | 851 | 196.5 |
| C | 14 | 254 | 34222 | 169.79 | 842 | 851 | 196.5 |
| C | 3 | 233 | 29275 | 144.62 | 842 | 851 | 196.5 |
| D | 8 | 195 | 163119 | 785.3 | 862 | 843 | 206.6 |
| D | 7 | 238 | 46375 | 220.34 | 862 | 843 | 206.6 |
| D | 13 | 138 | 34384 | 162.31 | 862 | 843 | 206.6 |
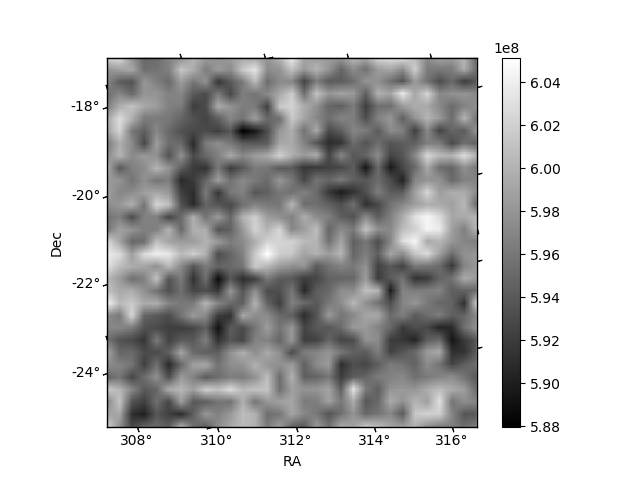
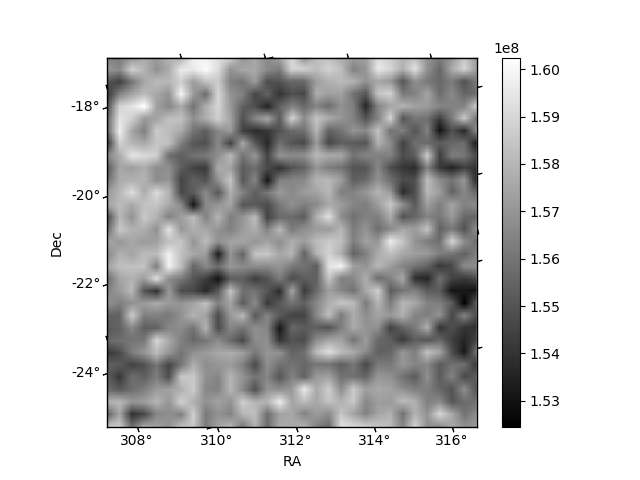
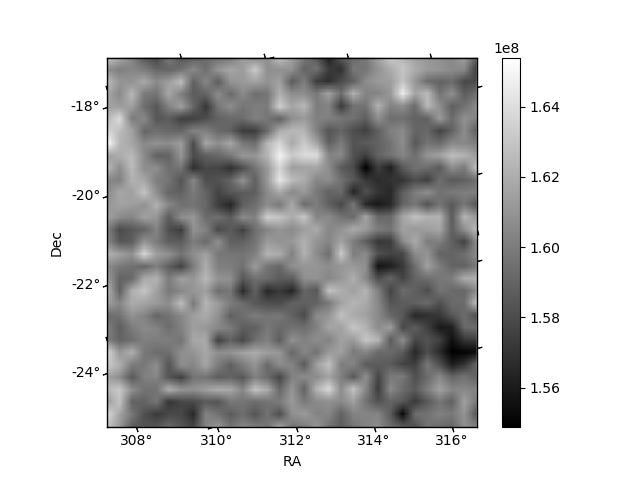
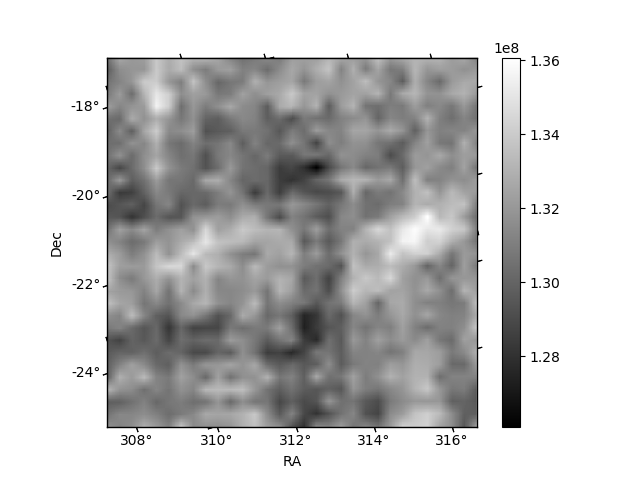
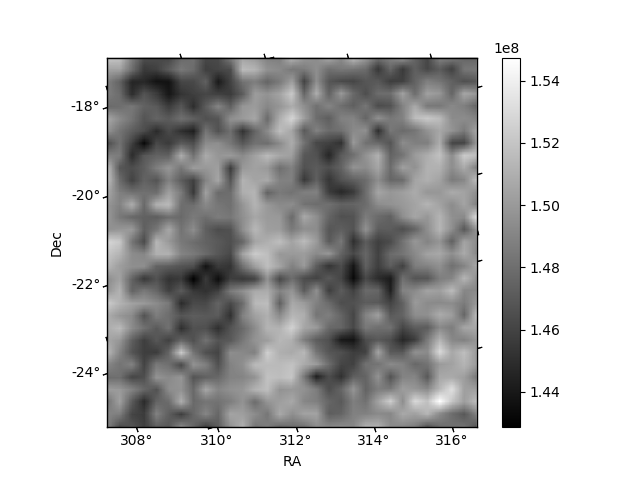
Histogram calculated using DETX and DETY for each event in the final _common_clean file
| Quadrant A | 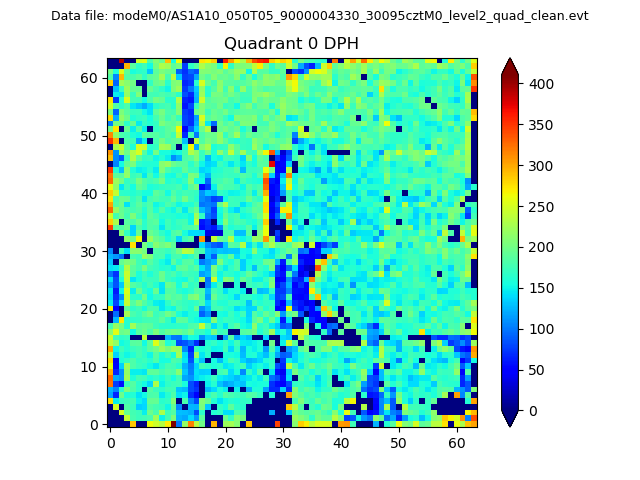 |
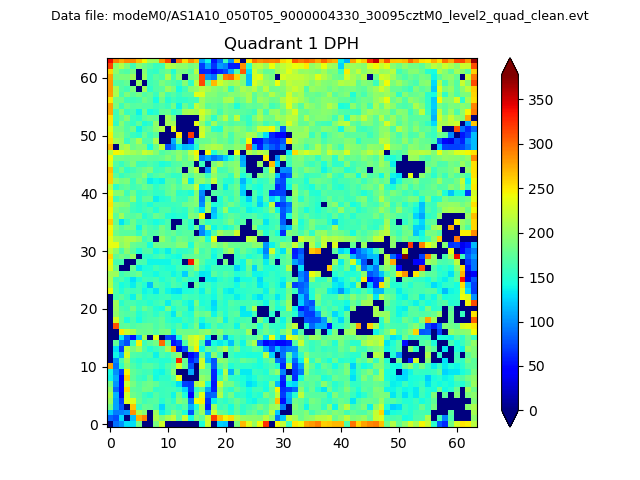 |
Quadrant B |
|---|---|---|---|
| Quadrant D | 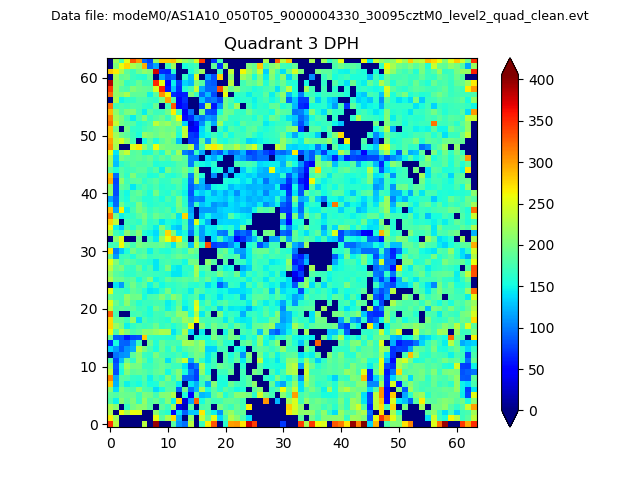 |
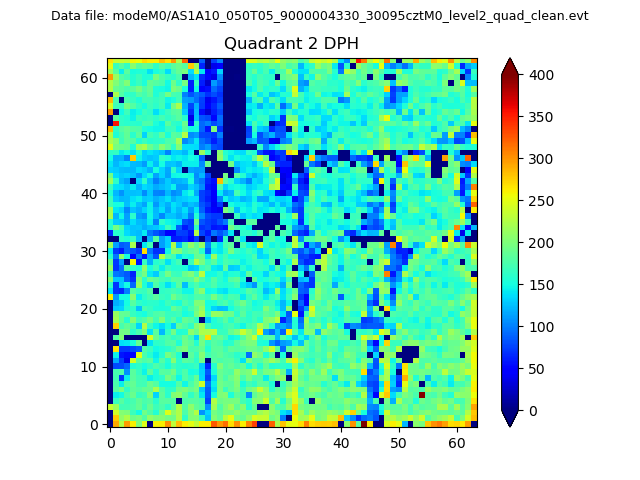 |
Quadrant C |
| Plot type | Count rate plots | Images |
|---|---|---|
| Comparison with Poisson distribution Blue bars denote a histogram of data divided into 1 sec bins. Red curve is a Poisson curve with rate = median count rate of data. |
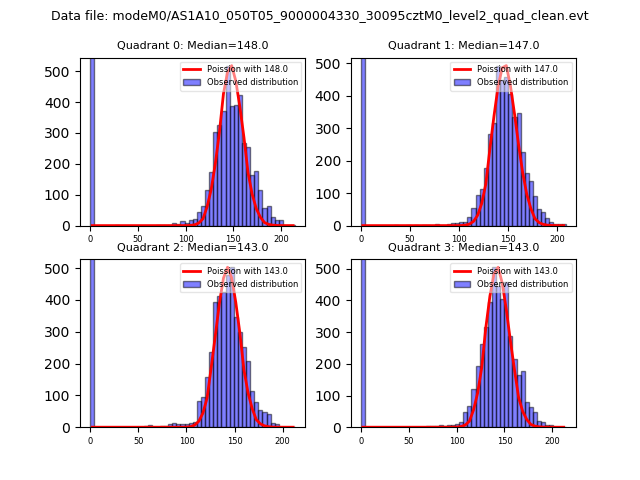 |
 |
| Quadrant-wise count rates Data is divided into 100 sec bins |
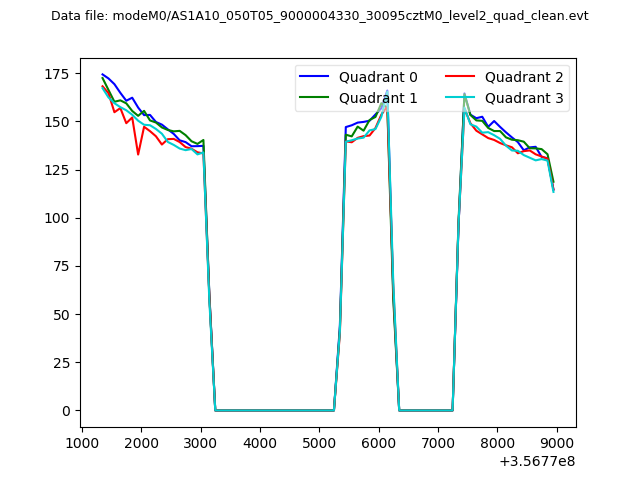 |
|
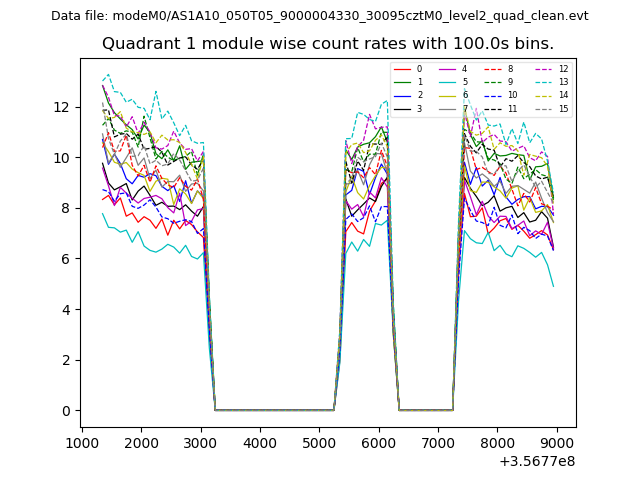
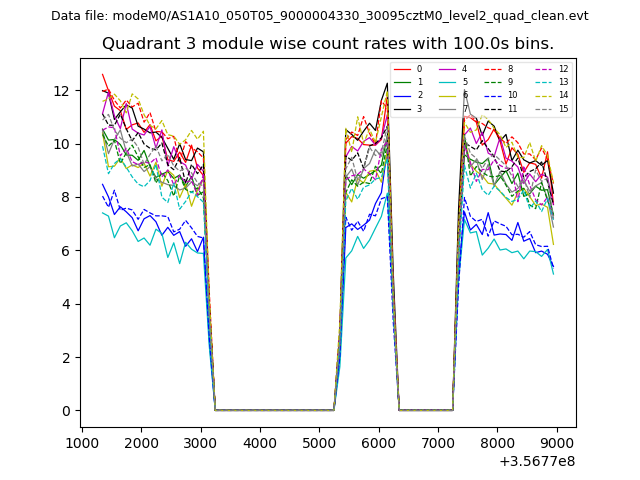
| Module-wise count rates for Quadrant A Data is divided into 100 sec bins |
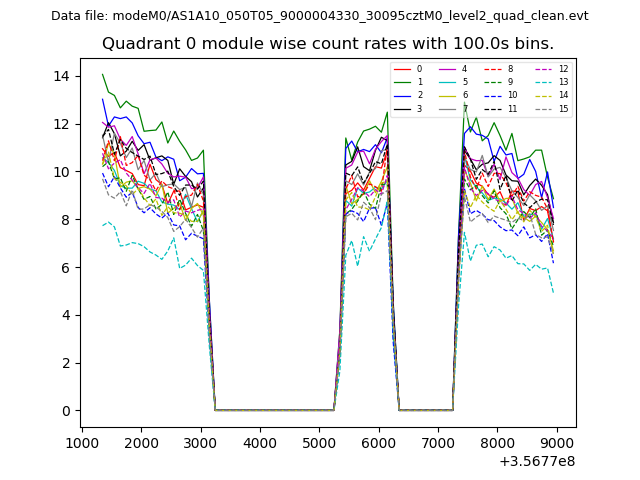 |
 |
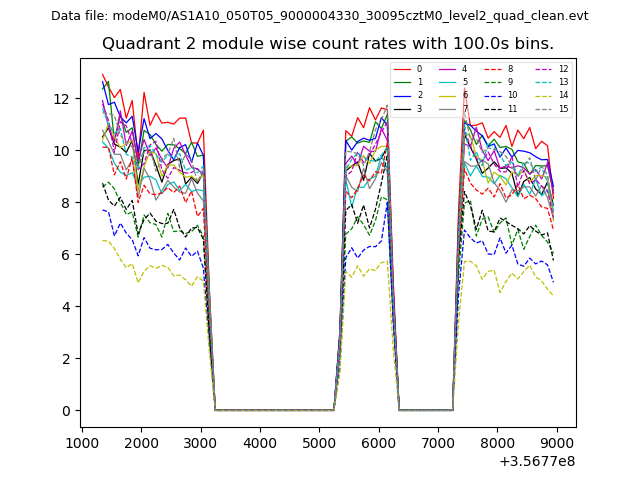
| Module-wise count rates for Quadrant B Data is divided into 100 sec bins |
 |
 |
| Module-wise count rates for Quadrant C Data is divided into 100 sec bins |
 |
 |
| Module-wise count rates for Quadrant D Data is divided into 100 sec bins |
 |
 |
| Parameter | Plot |
|---|---|
| CZT HV Monitor | 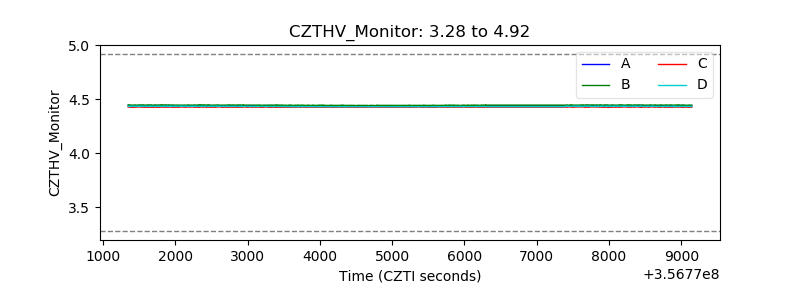 |
| D_VDD | 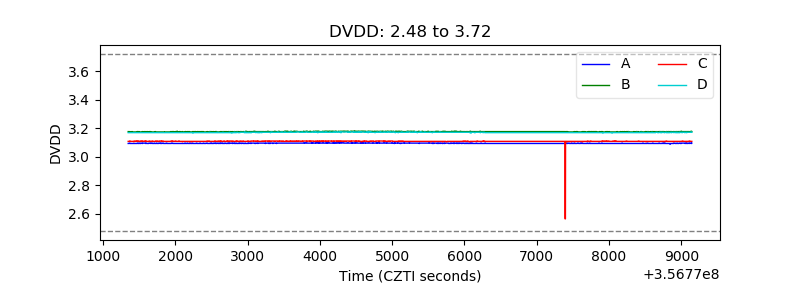 |
| Temperature 1 | 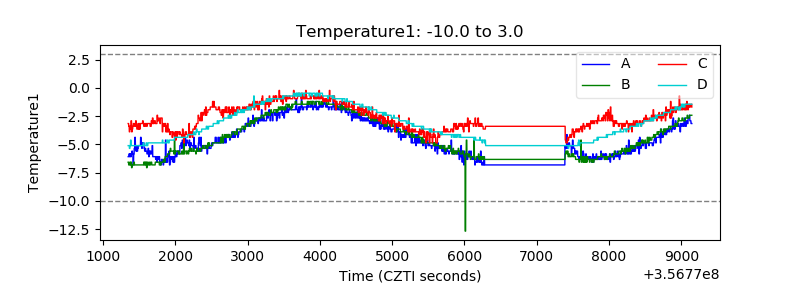 |
| Veto HV Monitor | 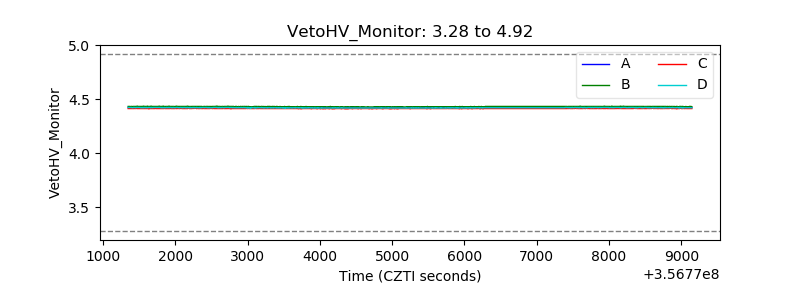 |
| Veto LLD | 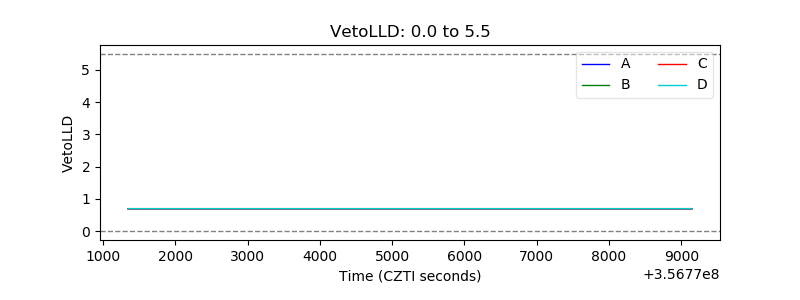 |
| Alpha Counter | 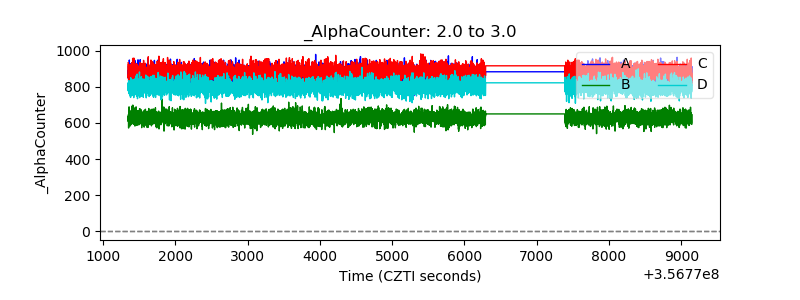 |
| _CPM_Rate | 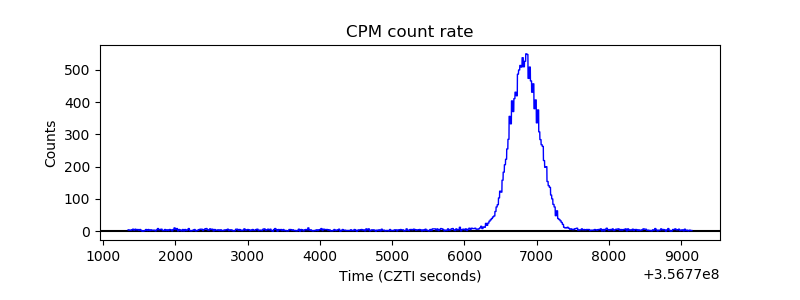 |
| CZT Counter | 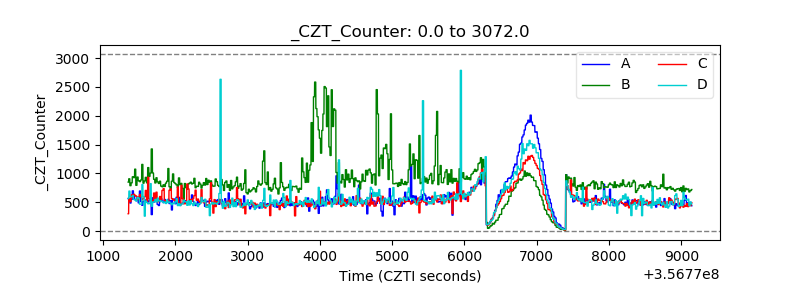 |
| +2.5 Volts monitor |  |
| +5 Volts monitor | 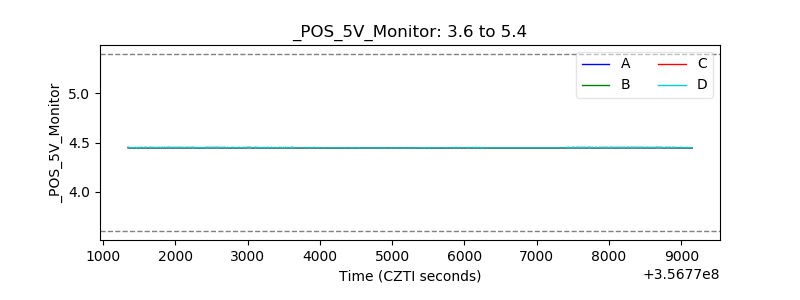 |
| _ROLL_ROT | 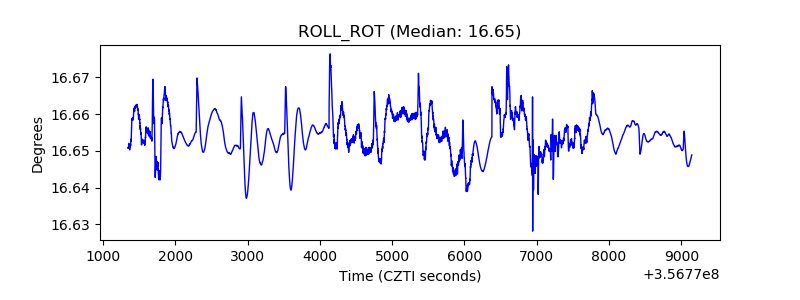 |
| _Roll_DEC | 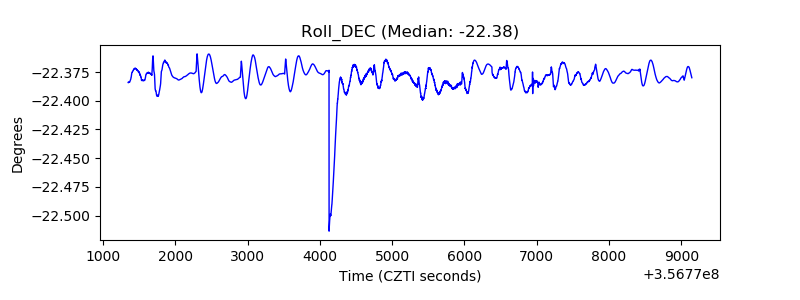 |
| _Roll_RA | 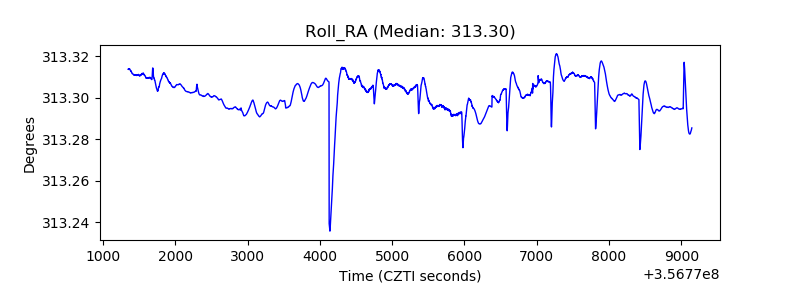 |
| Veto Counter | 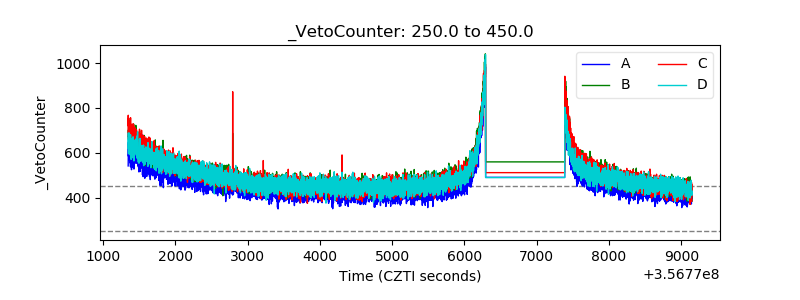 |