| Param | Original file | Final file |
|---|---|---|
| Filename | modeM0/AS1A10_050T05_9000004330_30096cztM0_level2.evt | modeM0/AS1A10_050T05_9000004330_30096cztM0_level2_quad_clean.evt |
| Size (bytes) | 544,795,200 | 88,056,000 |
| Size | 519.6 MB | 84.0 MB |
| Events in quadrant A | 3,477,780 | 561,290 |
| Events in quadrant B | 5,332,883 | 559,949 |
| Events in quadrant C | 3,299,221 | 542,794 |
| Events in quadrant D | 3,936,191 | 536,451 |
| Mode SS | |||
|---|---|---|---|
| Quadrant | BADHDUFLAG | Total packets | Discarded packets |
| A | 0 | 136 | 0 |
| B | 0 | 136 | 0 |
| C | 0 | 136 | 0 |
| D | 0 | 136 | 0 |
| Mode M9 | |||
|---|---|---|---|
| Quadrant | BADHDUFLAG | Total packets | Discarded packets |
| A | 0 | 8 | 0 |
| B | 0 | 8 | 0 |
| C | 0 | 8 | 0 |
| D | 0 | 8 | 0 |
| Mode M0 | |||
|---|---|---|---|
| Quadrant | BADHDUFLAG | Total packets | Discarded packets |
| A | 0 | 14309 | 1 |
| B | 0 | 20445 | 1 |
| C | 0 | 13747 | 1 |
| D | 0 | 15689 | 1 |
| Quadrant | Total seconds | Saturated seconds | Saturation percentage |
|---|---|---|---|
| A | 6685 | 138 | 2.064323% |
| B | 6686 | 161 | 2.408017% |
| C | 6686 | 115 | 1.720012% |
| D | 6685 | 148 | 2.213912% |
Noise dominated data is calculated using 1-second bins in cleaned event files. If a bin has >2000 counts, and if more than 50% of those come from <1% of pixels, then it is considered to be noise-dominated and hence unusable.
| Quadrant | # 1 sec bins | Bins with >0 counts | Bins with >2000 counts | High rate bins dominated by noise | Noise dominated (total time) | Noise dominated (detector-on time) | Marked lightcurve |
|---|---|---|---|---|---|---|---|
| A | 7505 | 6686 | 23 | 23 | 0.31% | 0.34% | 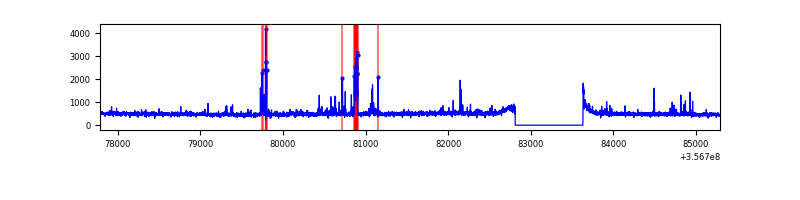 |
| B | 7506 | 6687 | 9 | 9 | 0.12% | 0.13% | 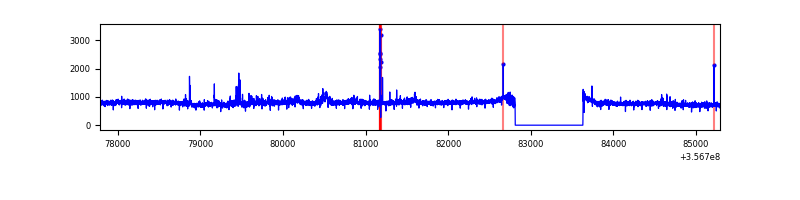 |
| C | 7506 | 6687 | 0 | 0 | 0.00% | 0.00% | 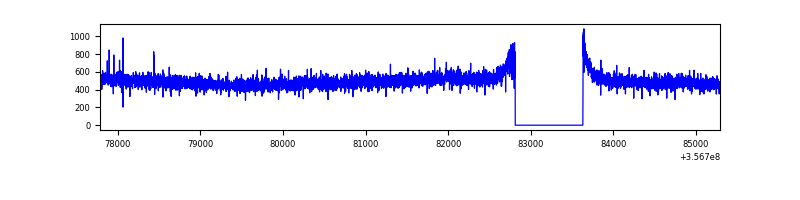 |
| D | 7505 | 6686 | 51 | 51 | 0.68% | 0.76% | 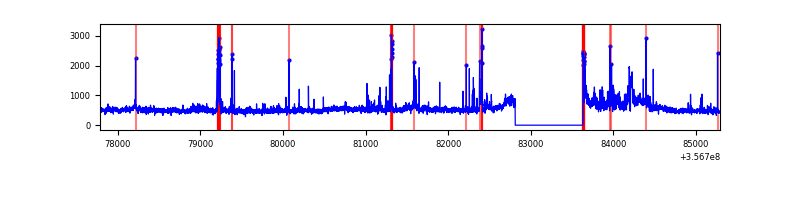 |
Top three noisy pixels from each quadrant. If the there are fewer than three noisy pixels in the level2.evt file, extra rows are filled as -1
| Pixel properties | Quadrant properties | ||||||
|---|---|---|---|---|---|---|---|
| Quadrant | DetID | PixID | Counts | Sigma | Mean | Median | Sigma |
| A | 0 | 13 | 221383 | 1302.73 | 840 | 822 | 169.3 |
| A | 13 | 254 | 12669 | 69.97 | 840 | 822 | 169.3 |
| A | 8 | 192 | 11371 | 62.31 | 840 | 822 | 169.3 |
| B | 6 | 159 | 1920815 | 12076.16 | 823 | 802 | 159.0 |
| B | 0 | 229 | 119763 | 748.22 | 823 | 802 | 159.0 |
| B | 0 | 190 | 28321 | 173.08 | 823 | 802 | 159.0 |
| C | 14 | 238 | 130673 | 683.04 | 805 | 809 | 190.1 |
| C | 2 | 114 | 15684 | 78.23 | 805 | 809 | 190.1 |
| C | 3 | 233 | 8651 | 41.24 | 805 | 809 | 190.1 |
| D | 7 | 238 | 378424 | 1935.13 | 814 | 795 | 195.1 |
| D | 8 | 195 | 198046 | 1010.8 | 814 | 795 | 195.1 |
| D | 2 | 250 | 77813 | 394.67 | 814 | 795 | 195.1 |
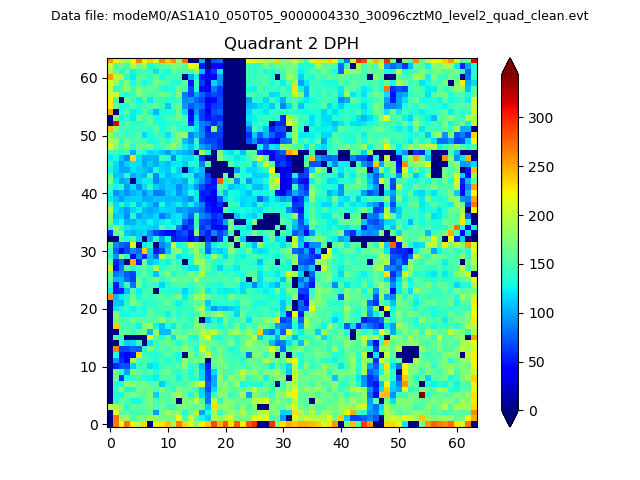
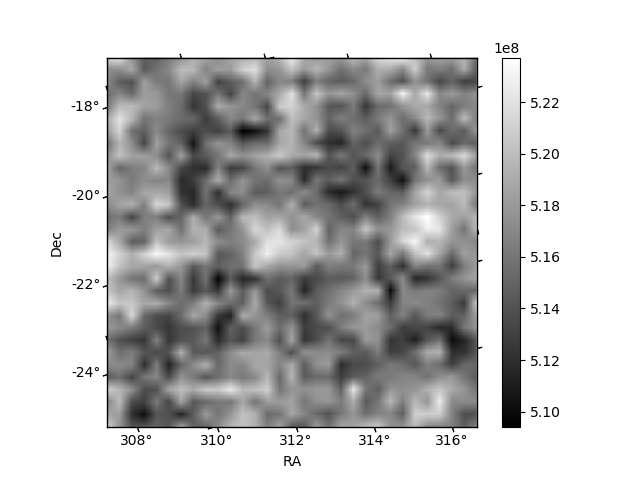
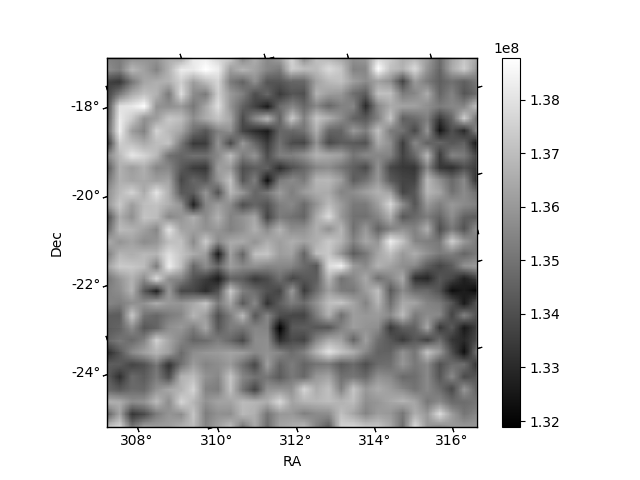
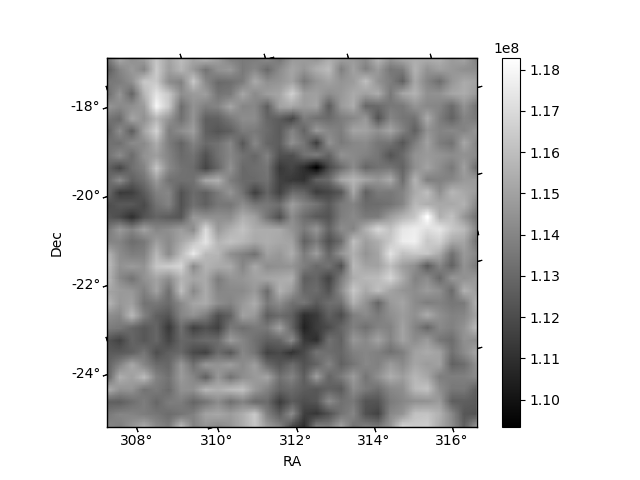
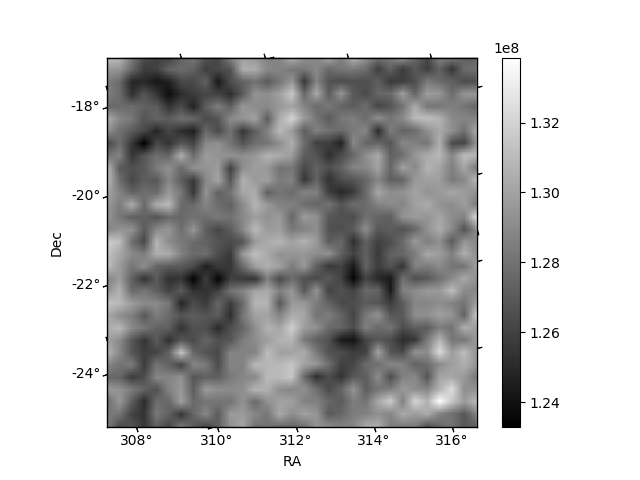
Histogram calculated using DETX and DETY for each event in the final _common_clean file
| Quadrant A | 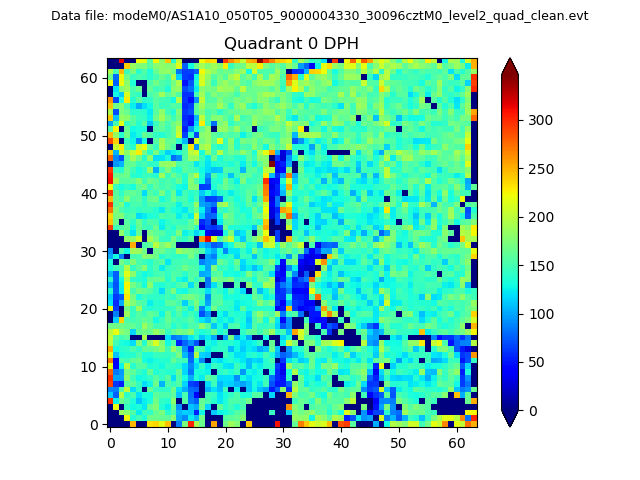 |
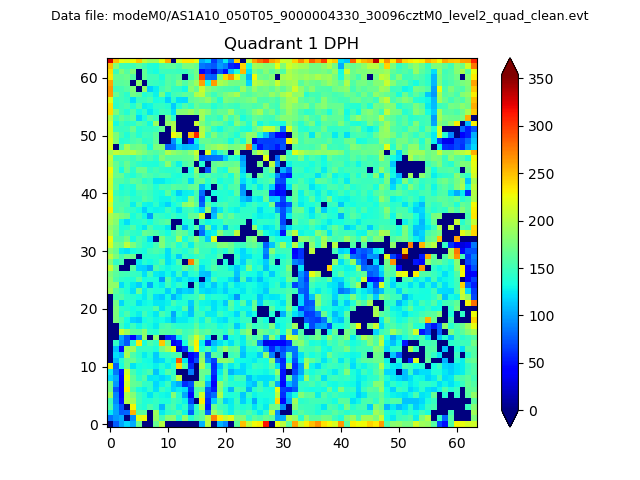 |
Quadrant B |
|---|---|---|---|
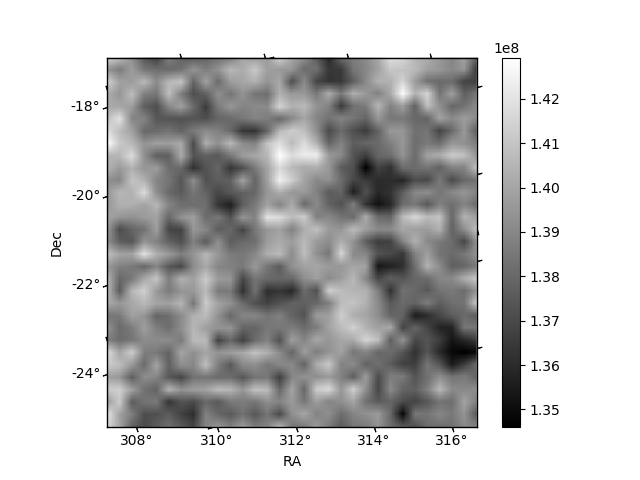
| Quadrant D | 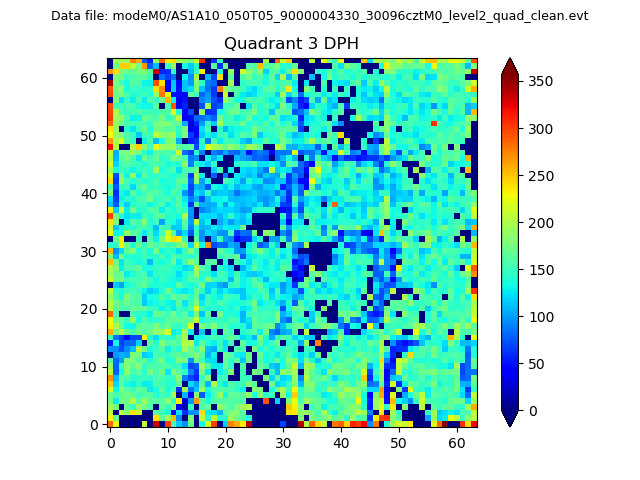 |
 |
Quadrant C |
| Plot type | Count rate plots | Images |
|---|---|---|
| Comparison with Poisson distribution Blue bars denote a histogram of data divided into 1 sec bins. Red curve is a Poisson curve with rate = median count rate of data. |
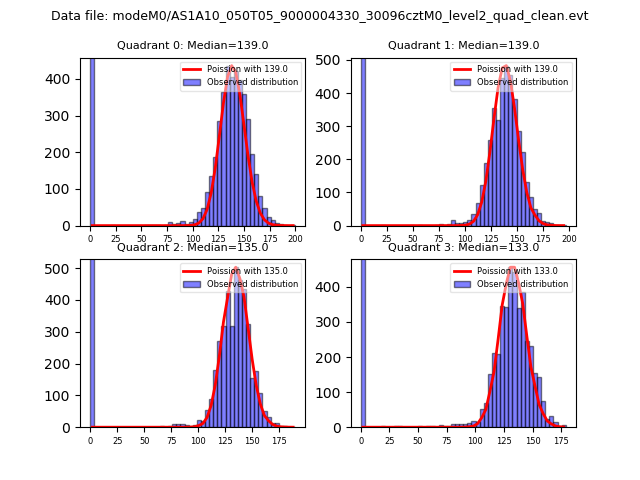 |
 |
| Quadrant-wise count rates Data is divided into 100 sec bins |
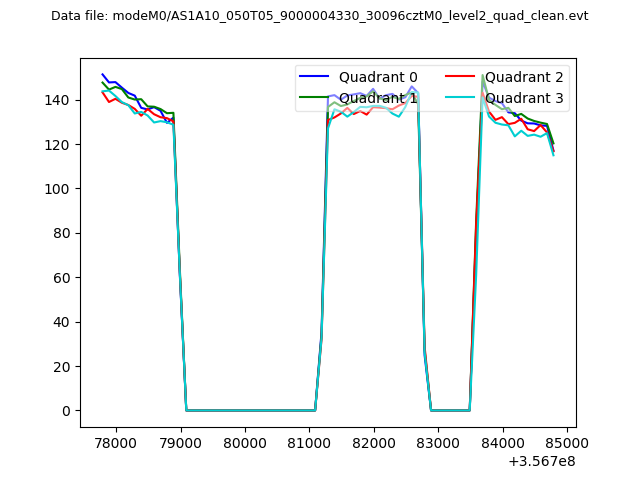 |
|
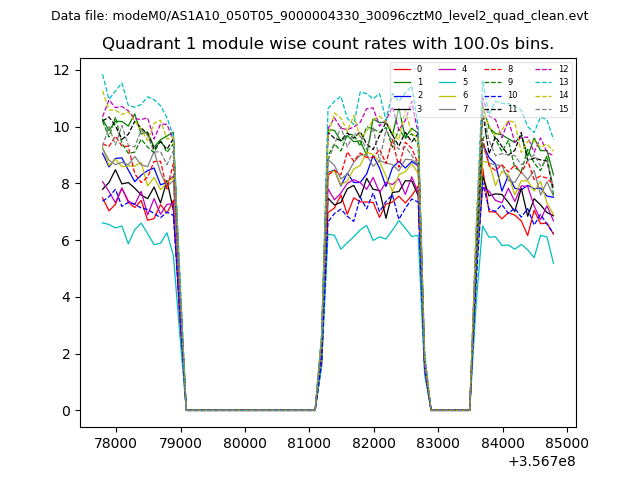
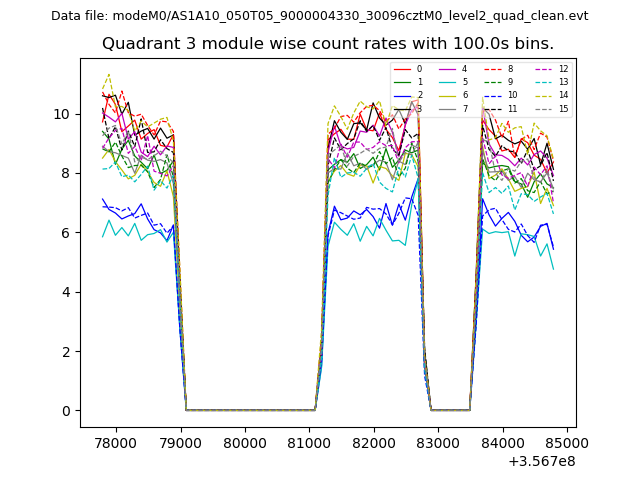
| Module-wise count rates for Quadrant A Data is divided into 100 sec bins |
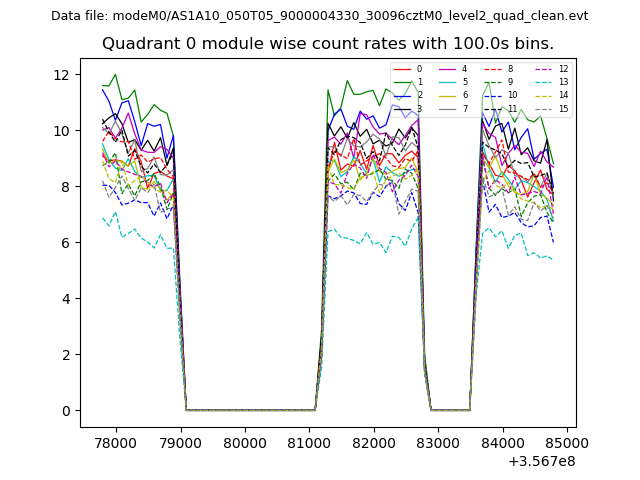 |
 |
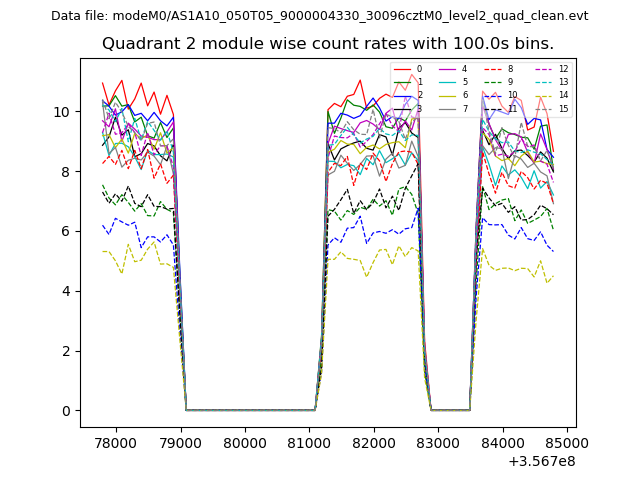
| Module-wise count rates for Quadrant B Data is divided into 100 sec bins |
 |
 |
| Module-wise count rates for Quadrant C Data is divided into 100 sec bins |
 |
 |
| Module-wise count rates for Quadrant D Data is divided into 100 sec bins |
 |
 |
| Parameter | Plot |
|---|---|
| CZT HV Monitor | 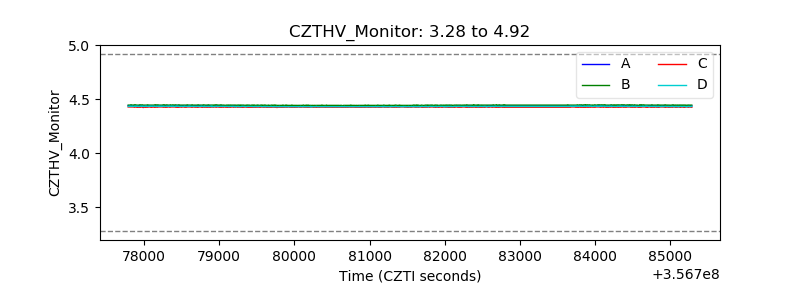 |
| D_VDD | 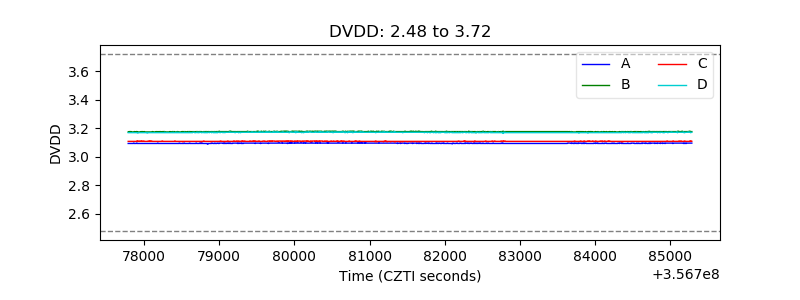 |
| Temperature 1 | 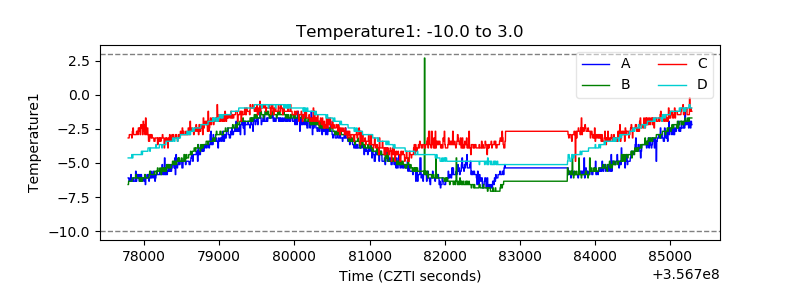 |
| Veto HV Monitor | 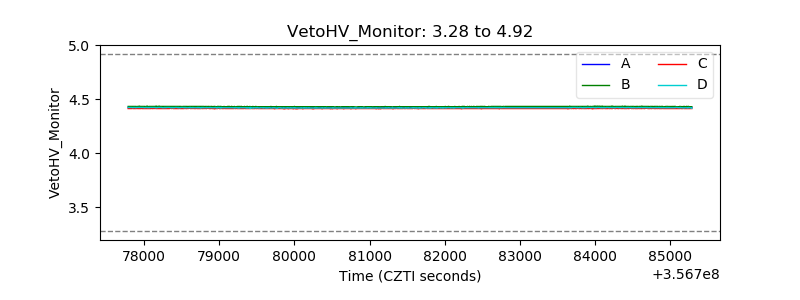 |
| Veto LLD | 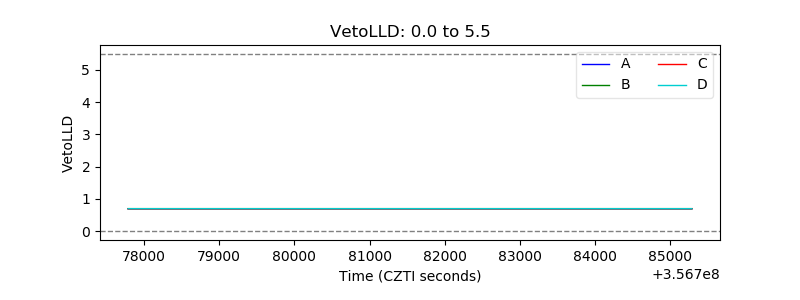 |
| Alpha Counter | 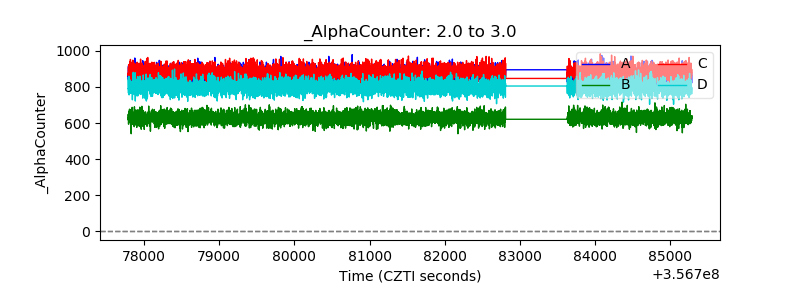 |
| _CPM_Rate | 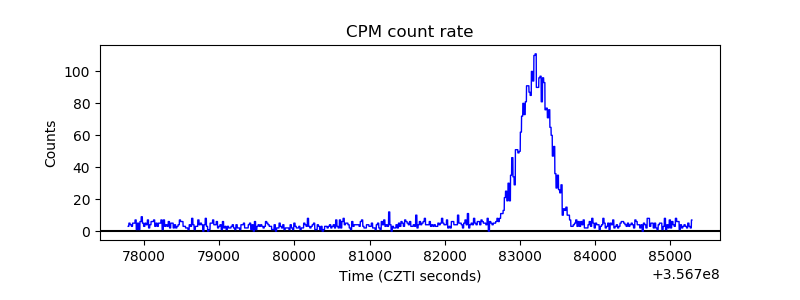 |
| CZT Counter | 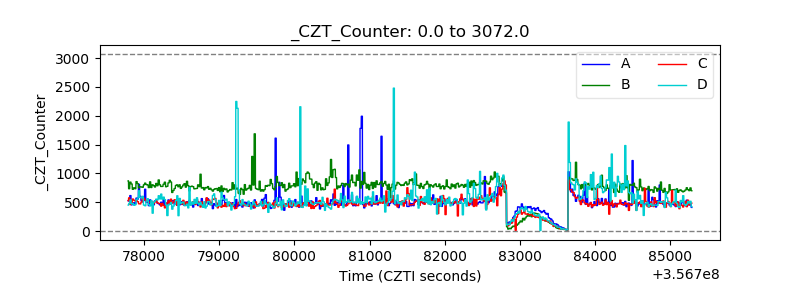 |
| +2.5 Volts monitor |  |
| +5 Volts monitor |  |
| _ROLL_ROT | 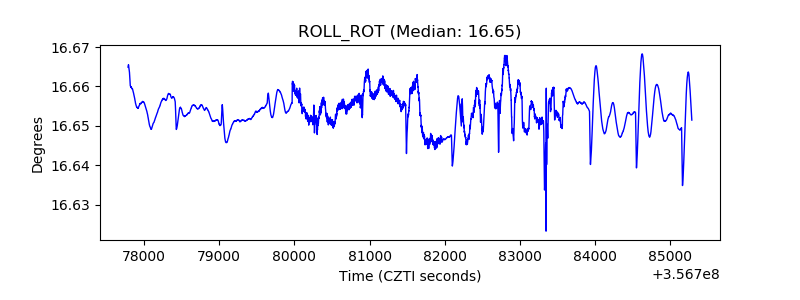 |
| _Roll_DEC | 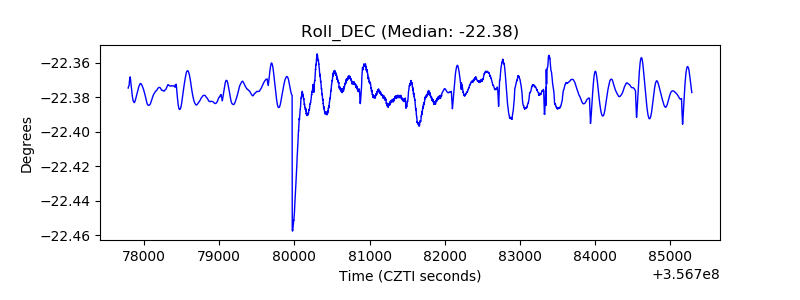 |
| _Roll_RA |  |
| Veto Counter | 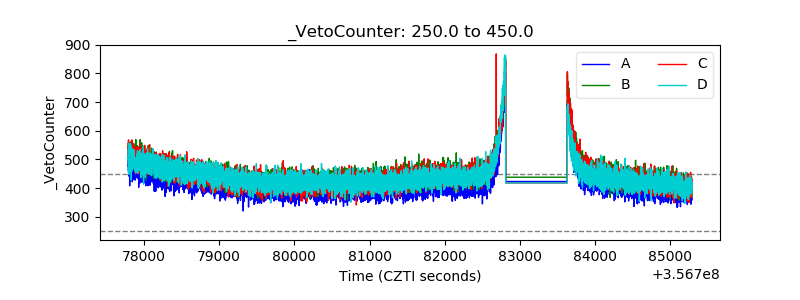 |