| Param | Original file | Final file |
|---|---|---|
| Filename | modeM0/AS1A10_050T05_9000004330_30097cztM0_level2.evt | modeM0/AS1A10_050T05_9000004330_30097cztM0_level2_quad_clean.evt |
| Size (bytes) | 309,006,720 | 38,384,640 |
| Size | 294.7 MB | 36.6 MB |
| Events in quadrant A | 1,933,120 | 225,879 |
| Events in quadrant B | 3,037,358 | 224,308 |
| Events in quadrant C | 1,831,176 | 216,935 |
| Events in quadrant D | 2,288,472 | 217,032 |
| Mode SS | |||
|---|---|---|---|
| Quadrant | BADHDUFLAG | Total packets | Discarded packets |
| A | 0 | 80 | 0 |
| B | 0 | 80 | 0 |
| C | 0 | 80 | 0 |
| D | 0 | 80 | 0 |
| Mode M0 | |||
|---|---|---|---|
| Quadrant | BADHDUFLAG | Total packets | Discarded packets |
| A | 0 | 8168 | 0 |
| B | 0 | 11895 | 0 |
| C | 0 | 7878 | 0 |
| D | 0 | 9243 | 0 |
| Quadrant | Total seconds | Saturated seconds | Saturation percentage |
|---|---|---|---|
| A | 3927 | 6 | 0.152788% |
| B | 3928 | 15 | 0.381874% |
| C | 3928 | 17 | 0.432790% |
| D | 3928 | 68 | 1.731161% |
Noise dominated data is calculated using 1-second bins in cleaned event files. If a bin has >2000 counts, and if more than 50% of those come from <1% of pixels, then it is considered to be noise-dominated and hence unusable.
| Quadrant | # 1 sec bins | Bins with >0 counts | Bins with >2000 counts | High rate bins dominated by noise | Noise dominated (total time) | Noise dominated (detector-on time) | Marked lightcurve |
|---|---|---|---|---|---|---|---|
| A | 3927 | 3927 | 3 | 3 | 0.08% | 0.08% | 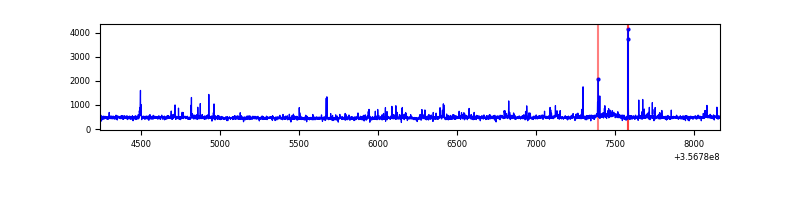 |
| B | 3928 | 3928 | 1 | 1 | 0.03% | 0.03% | 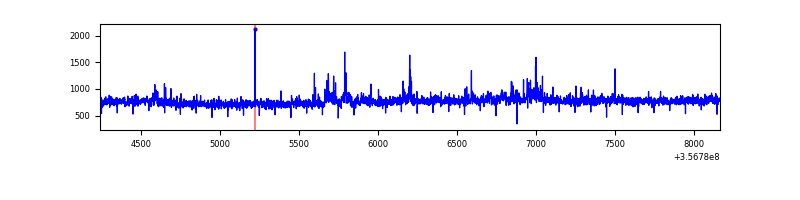 |
| C | 3928 | 3928 | 0 | 0 | 0.00% | 0.00% | 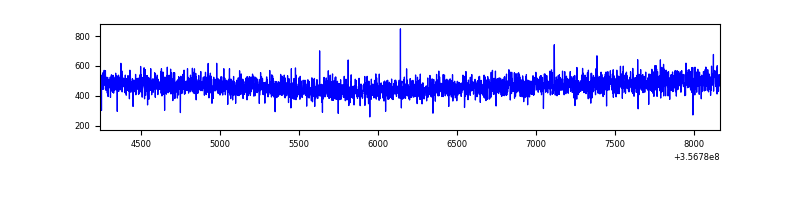 |
| D | 3928 | 3928 | 61 | 61 | 1.55% | 1.55% | 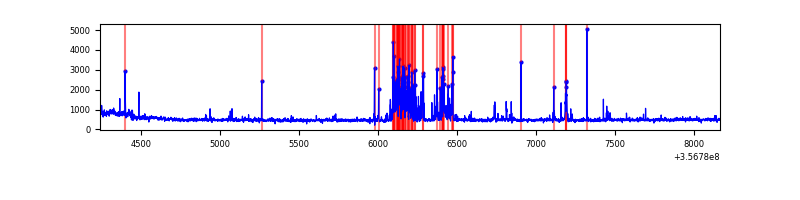 |
Top three noisy pixels from each quadrant. If the there are fewer than three noisy pixels in the level2.evt file, extra rows are filled as -1
| Pixel properties | Quadrant properties | ||||||
|---|---|---|---|---|---|---|---|
| Quadrant | DetID | PixID | Counts | Sigma | Mean | Median | Sigma |
| A | 0 | 13 | 110956 | 1163.25 | 469 | 458 | 95.0 |
| A | 13 | 210 | 9227 | 92.31 | 469 | 458 | 95.0 |
| A | 13 | 254 | 7326 | 72.3 | 469 | 458 | 95.0 |
| B | 6 | 159 | 1134332 | 12596.99 | 460 | 450 | 90.0 |
| B | 0 | 190 | 57162 | 630.05 | 460 | 450 | 90.0 |
| B | 5 | 235 | 14086 | 151.49 | 460 | 450 | 90.0 |
| C | 14 | 238 | 72716 | 681.33 | 446 | 448 | 106.1 |
| C | 2 | 114 | 9057 | 81.16 | 446 | 448 | 106.1 |
| C | 3 | 233 | 5105 | 43.91 | 446 | 448 | 106.1 |
| D | 12 | 2 | 296345 | 2599.36 | 449 | 438 | 113.8 |
| D | 8 | 195 | 100156 | 875.96 | 449 | 438 | 113.8 |
| D | 7 | 238 | 96075 | 840.11 | 449 | 438 | 113.8 |
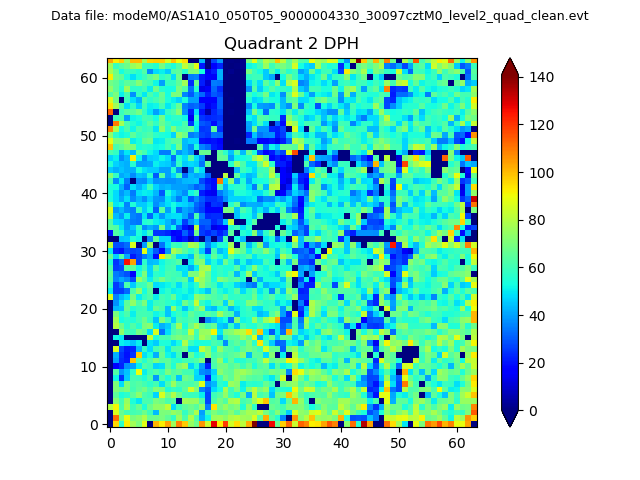
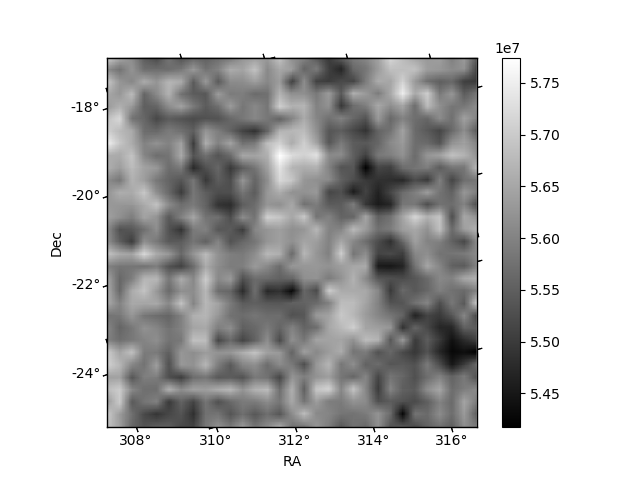
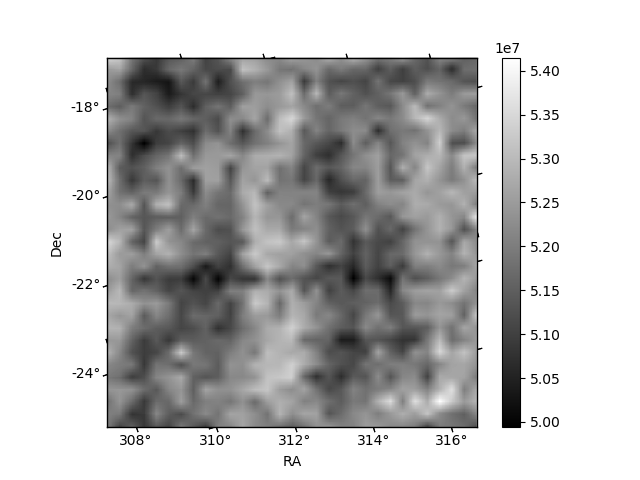
Histogram calculated using DETX and DETY for each event in the final _common_clean file
| Quadrant A | 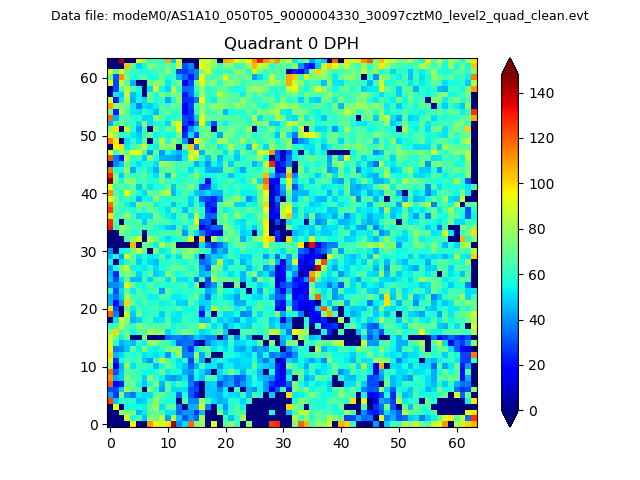 |
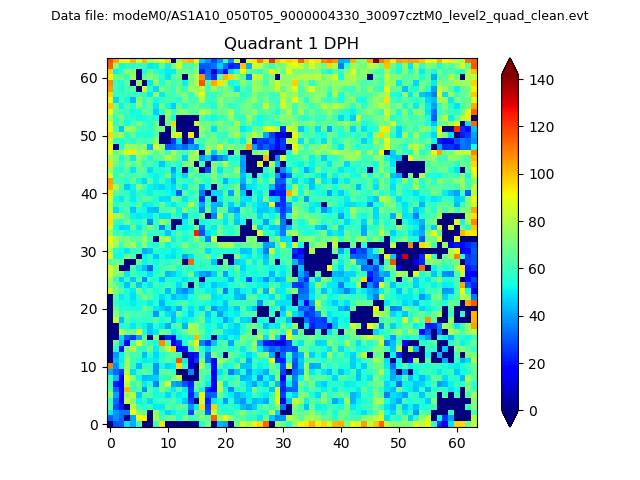 |
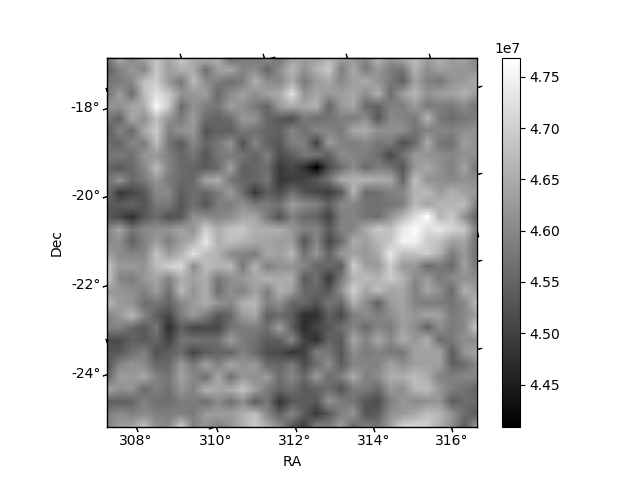
Quadrant B |
|---|---|---|---|
| Quadrant D | 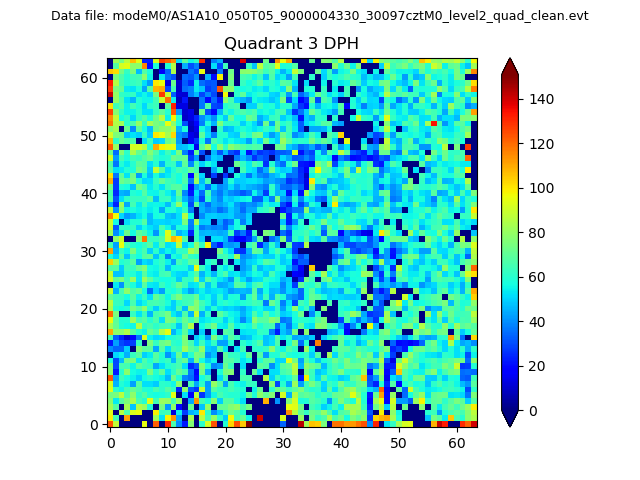 |
 |
Quadrant C |
| Plot type | Count rate plots | Images |
|---|---|---|
| Comparison with Poisson distribution Blue bars denote a histogram of data divided into 1 sec bins. Red curve is a Poisson curve with rate = median count rate of data. |
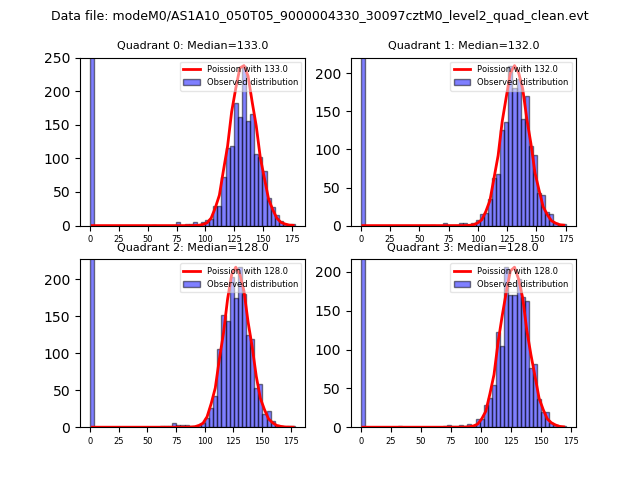 |
 |
| Quadrant-wise count rates Data is divided into 100 sec bins |
 |
|
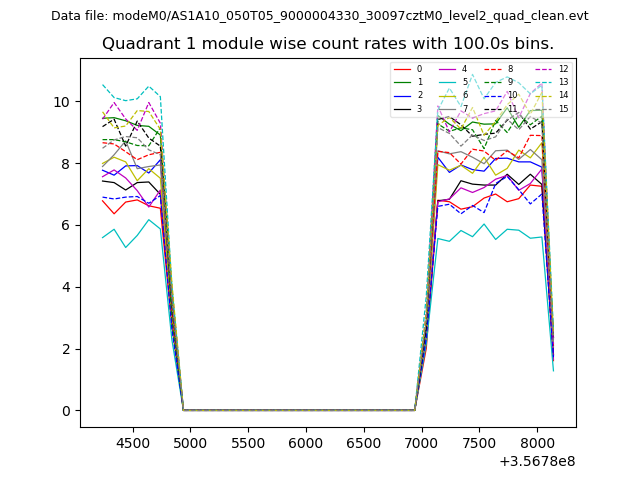
| Module-wise count rates for Quadrant A Data is divided into 100 sec bins |
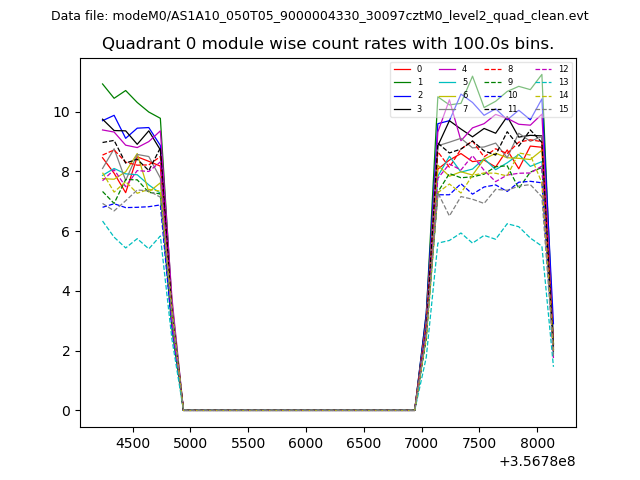 |
 |
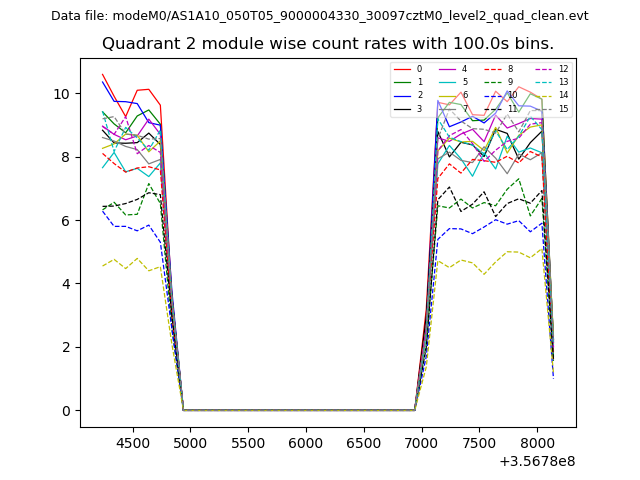
| Module-wise count rates for Quadrant B Data is divided into 100 sec bins |
 |
 |
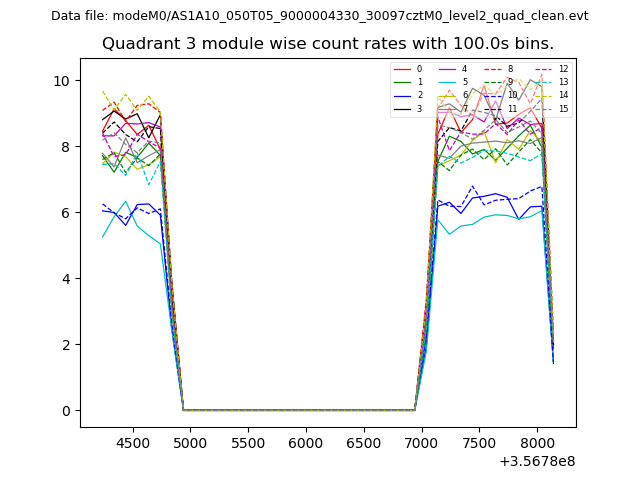
| Module-wise count rates for Quadrant C Data is divided into 100 sec bins |
 |
 |
| Module-wise count rates for Quadrant D Data is divided into 100 sec bins |
 |
 |
| Parameter | Plot |
|---|---|
| CZT HV Monitor | 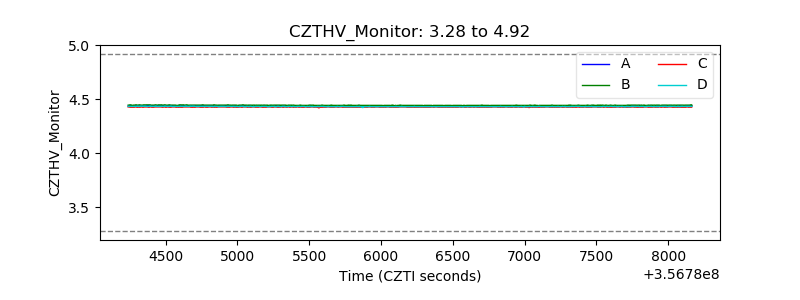 |
| D_VDD | 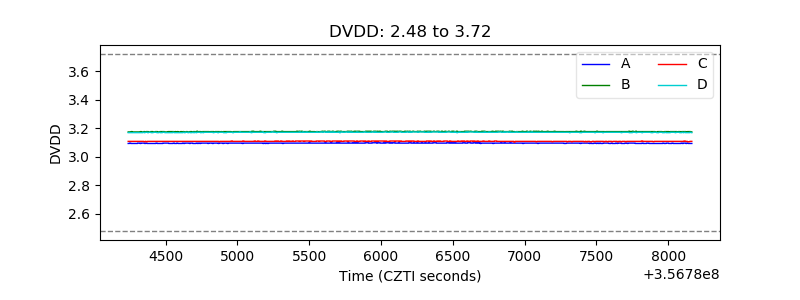 |
| Temperature 1 | 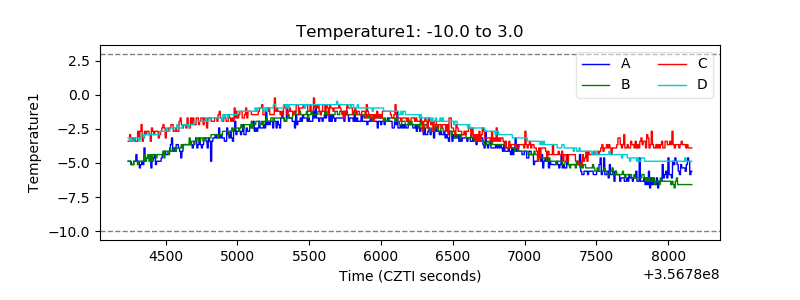 |
| Veto HV Monitor |  |
| Veto LLD |  |
| Alpha Counter | 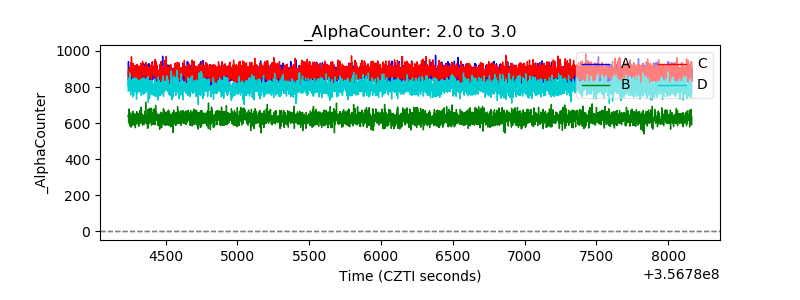 |
| _CPM_Rate | 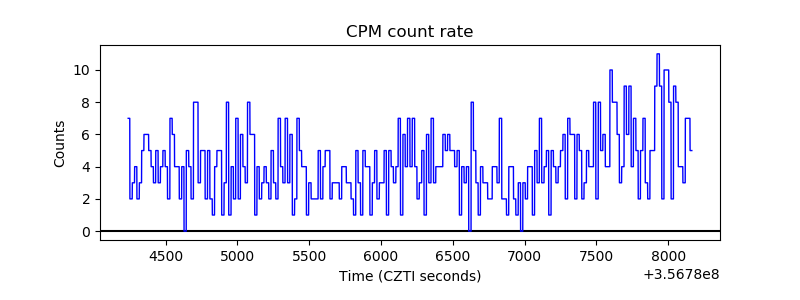 |
| CZT Counter | 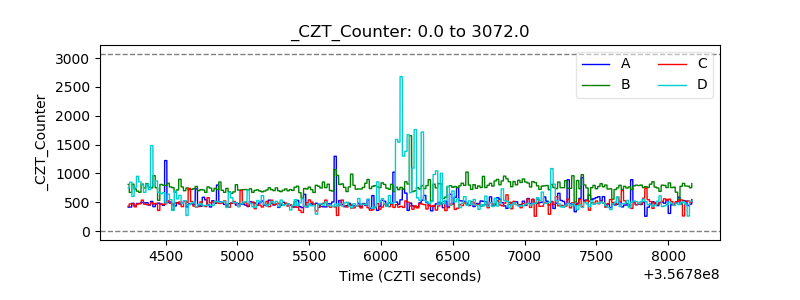 |
| +2.5 Volts monitor |  |
| +5 Volts monitor |  |
| _ROLL_ROT | 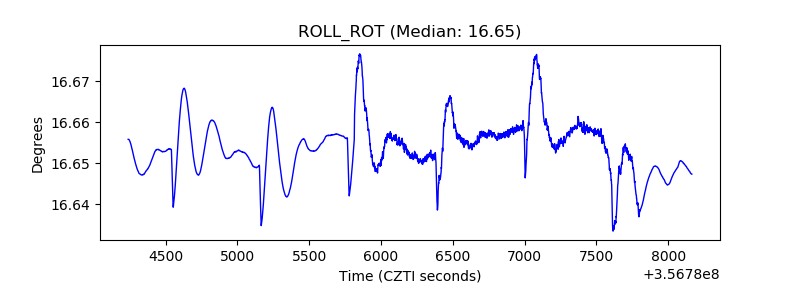 |
| _Roll_DEC | 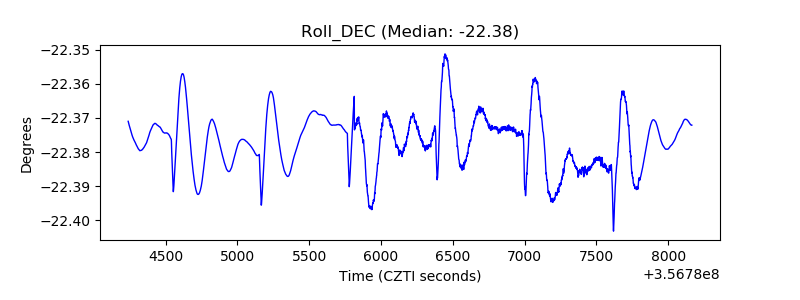 |
| _Roll_RA | 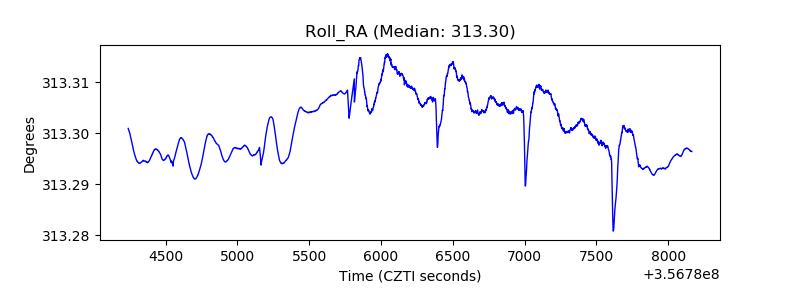 |
| Veto Counter | 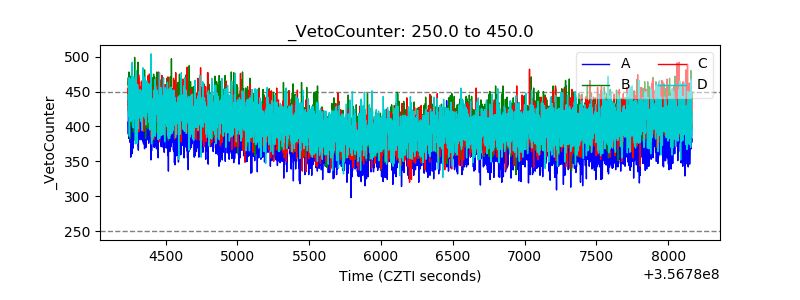 |