| Param | Original file | Final file |
|---|---|---|
| Filename | modeM0/AS1A10_071T10_9000004328cztM0_level2.fits | modeM0/AS1A10_071T10_9000004328cztM0_level2_quad_clean.evt |
| Size (bytes) | 526,688,640 | 413,758,080 |
| Size | 502.3 MB | 394.6 MB |
| Events in quadrant A | 3,355,686 | 2,418,925 |
| Events in quadrant B | 3,153,640 | 2,393,248 |
| Events in quadrant C | 3,181,584 | 2,244,522 |
| Events in quadrant D | 2,744,294 | 1,957,503 |
| Mode M0 | |||
|---|---|---|---|
| Quadrant | BADHDUFLAG | Total packets | Discarded packets |
| A | 0 | 107255 | 0 |
| B | 0 | 156738 | 0 |
| C | 0 | 111027 | 0 |
| D | 0 | 133695 | 0 |
| Mode SS | |||
|---|---|---|---|
| Quadrant | BADHDUFLAG | Total packets | Discarded packets |
| A | 0 | 1046 | 0 |
| B | 0 | 1046 | 0 |
| C | 0 | 1046 | 0 |
| D | 0 | 1046 | 0 |
| Mode M9 | |||
|---|---|---|---|
| Quadrant | BADHDUFLAG | Total packets | Discarded packets |
| A | 0 | 86 | 0 |
| B | 0 | 86 | 0 |
| C | 0 | 86 | 0 |
| D | 0 | 86 | 0 |
| Quadrant | Total seconds | Saturated seconds | Saturation percentage |
|---|---|---|---|
| A | 51210 | 794 | 1.550478% |
| B | 51210 | 1421 | 2.774849% |
| C | 51210 | 1178 | 2.300332% |
| D | 51210 | 3459 | 6.754540% |
Noise dominated data is calculated using 1-second bins in cleaned event files. If a bin has >2000 counts, and if more than 50% of those come from <1% of pixels, then it is considered to be noise-dominated and hence unusable.
| Quadrant | # 1 sec bins | Bins with >0 counts | Bins with >2000 counts | High rate bins dominated by noise | Noise dominated (total time) | Noise dominated (detector-on time) | Marked lightcurve |
|---|---|---|---|---|---|---|---|
| A | 59906 | 51210 | 0 | 0 | 0.00% | 0.00% | 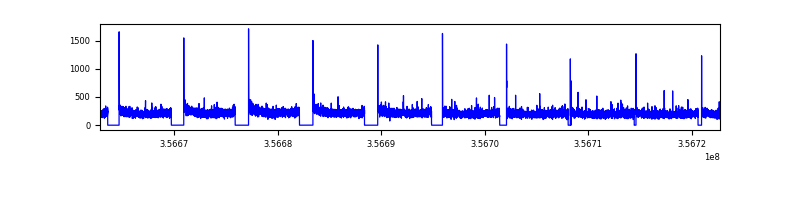 |
| B | 59906 | 51210 | 0 | 0 | 0.00% | 0.00% |  |
| C | 59906 | 51211 | 0 | 0 | 0.00% | 0.00% | 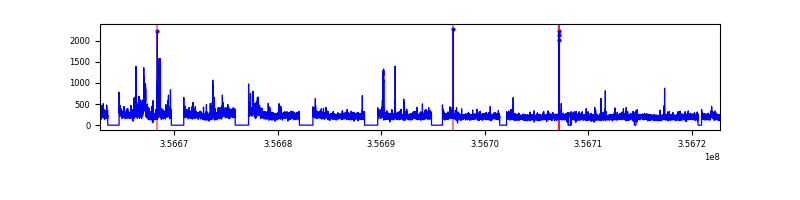 |
| D | 59906 | 51170 | 0 | 0 | 0.00% | 0.00% | 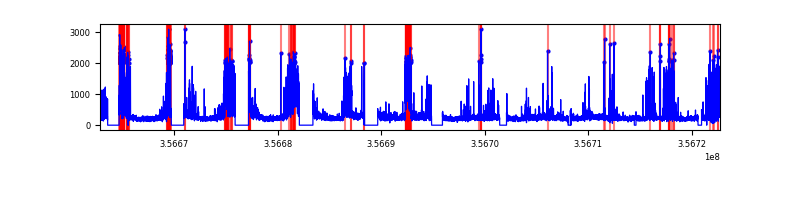 |
Top three noisy pixels from each quadrant. If the there are fewer than three noisy pixels in the level2.evt file, extra rows are filled as -1
| Pixel properties | Quadrant properties | ||||||
|---|---|---|---|---|---|---|---|
| Quadrant | DetID | PixID | Counts | Sigma | Mean | Median | Sigma |
| A | 0 | 29 | 3154 | 11.0 | 873 | 824 | 211.8 |
| A | 7 | 110 | 2578 | 8.28 | 873 | 824 | 211.8 |
| A | 0 | 30 | 2479 | 7.81 | 873 | 824 | 211.8 |
| B | 2 | 9 | 2516 | 10.25 | 833 | 796 | 167.9 |
| B | 5 | 232 | 2148 | 8.05 | 833 | 796 | 167.9 |
| B | 5 | 225 | 2121 | 7.89 | 833 | 796 | 167.9 |
| C | 1 | 80 | 2429 | 7.69 | 840 | 786 | 213.7 |
| C | 1 | 81 | 2411 | 7.6 | 840 | 786 | 213.7 |
| C | 12 | 241 | 2194 | 6.59 | 840 | 786 | 213.7 |
| D | 15 | 46 | 2026 | 6.27 | 783 | 714 | 209.3 |
| D | 3 | 14 | 1944 | 5.88 | 783 | 714 | 209.3 |
| D | 7 | 3 | 1943 | 5.87 | 783 | 714 | 209.3 |
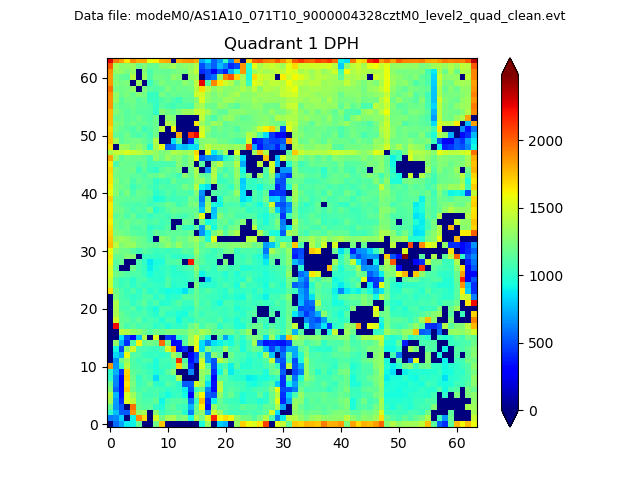
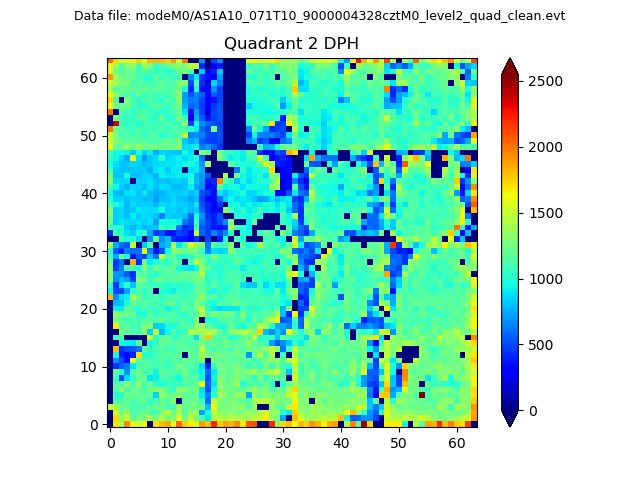
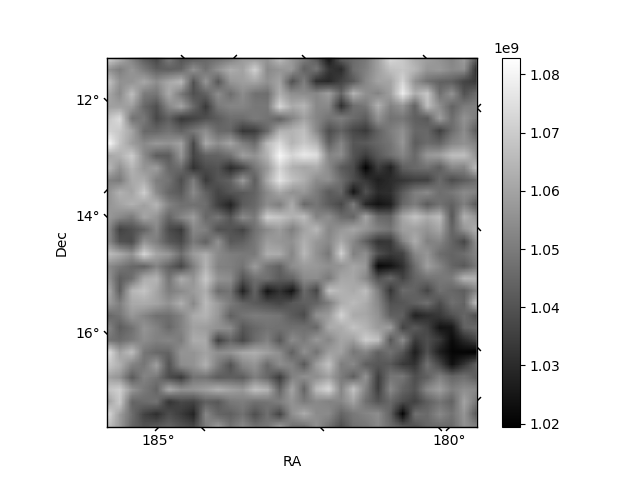
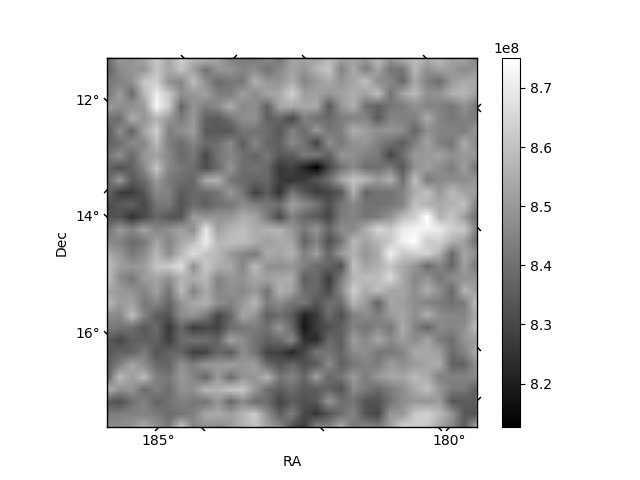
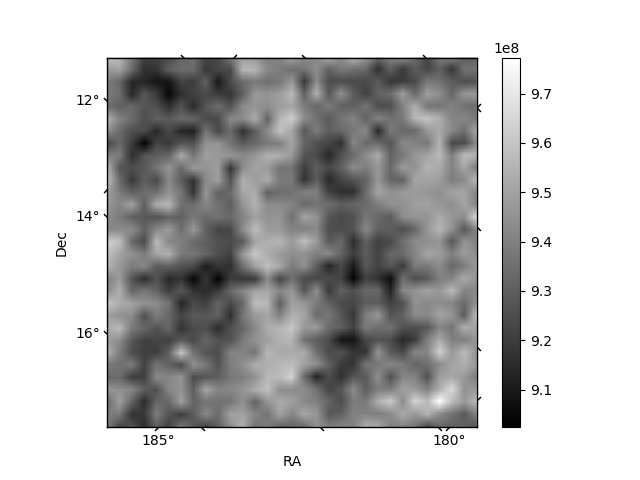
Histogram calculated using DETX and DETY for each event in the final _common_clean file
| Quadrant A | 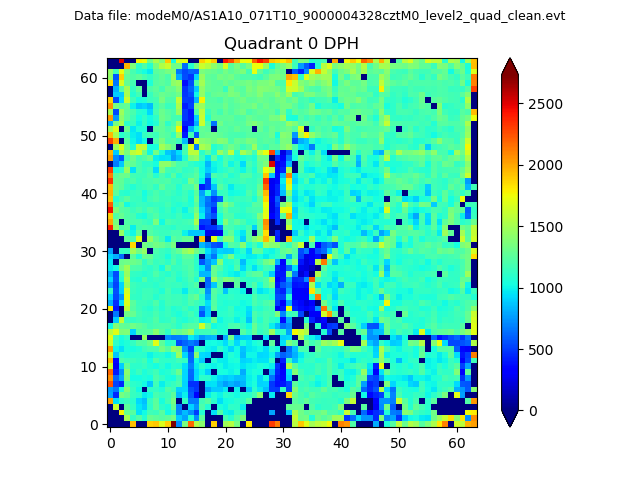 |
 |
Quadrant B |
|---|---|---|---|
| Quadrant D |  |
 |
Quadrant C |
| Plot type | Count rate plots | Images |
|---|---|---|
| Comparison with Poisson distribution Blue bars denote a histogram of data divided into 1 sec bins. Red curve is a Poisson curve with rate = median count rate of data. |
 |
 |
| Quadrant-wise count rates Data is divided into 100 sec bins |
 |
|
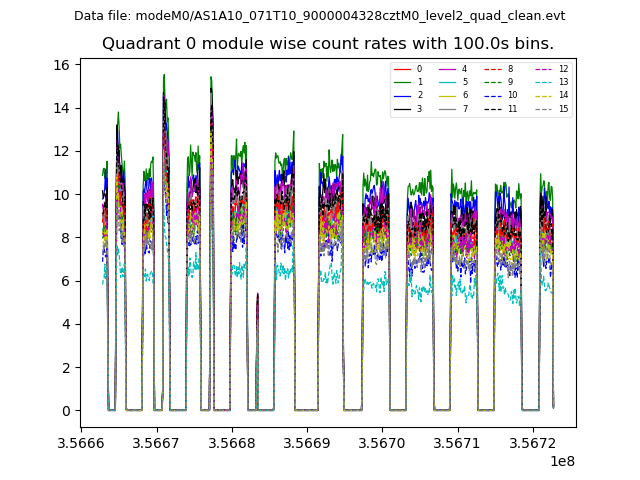
| Module-wise count rates for Quadrant A Data is divided into 100 sec bins |
 |
 |
| Module-wise count rates for Quadrant B Data is divided into 100 sec bins |
 |
 |
| Module-wise count rates for Quadrant C Data is divided into 100 sec bins |
 |
 |
| Module-wise count rates for Quadrant D Data is divided into 100 sec bins |
 |
 |
| Parameter | Plot |
|---|---|
| CZT HV Monitor |  |
| D_VDD |  |
| Temperature 1 | 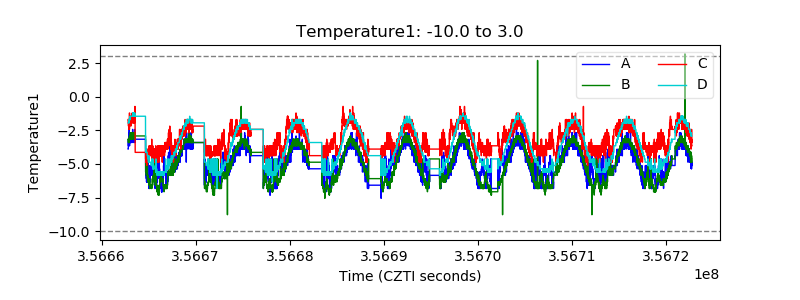 |
| Veto HV Monitor | 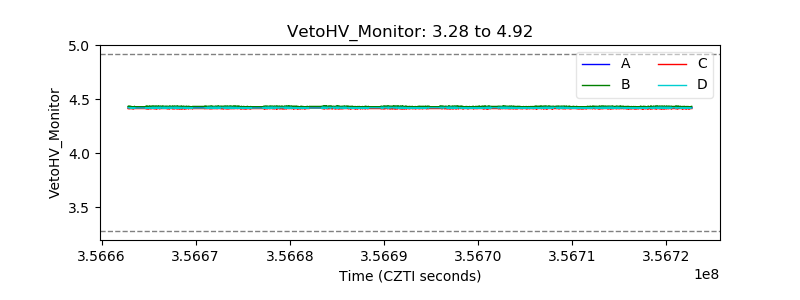 |
| Veto LLD |  |
| Alpha Counter |  |
| _CPM_Rate |  |
| CZT Counter |  |
| +2.5 Volts monitor |  |
| +5 Volts monitor | 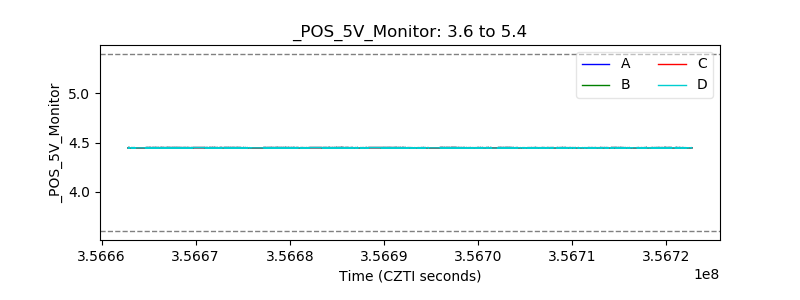 |
| _ROLL_ROT |  |
| _Roll_DEC |  |
| _Roll_RA |  |
| Veto Counter | 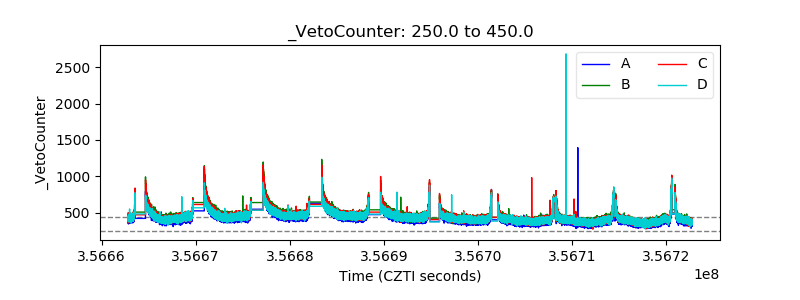 |