| Param | Original file | Final file |
|---|---|---|
| Filename | modeM0/AS1A10_071T10_9000004328_30076cztM0_level2.evt | modeM0/AS1A10_071T10_9000004328_30076cztM0_level2_quad_clean.evt |
| Size (bytes) | 201,395,520 | 43,462,080 |
| Size | 192.1 MB | 41.4 MB |
| Events in quadrant A | 1,096,444 | 302,159 |
| Events in quadrant B | 1,634,485 | 307,361 |
| Events in quadrant C | 1,183,478 | 288,893 |
| Events in quadrant D | 2,043,954 | 268,726 |
| Mode M0 | |||
|---|---|---|---|
| Quadrant | BADHDUFLAG | Total packets | Discarded packets |
| A | 0 | 4411 | 1 |
| B | 0 | 6224 | 1 |
| C | 0 | 4818 | 1 |
| D | 0 | 7448 | 1 |
| Mode SS | |||
|---|---|---|---|
| Quadrant | BADHDUFLAG | Total packets | Discarded packets |
| A | 0 | 44 | 0 |
| B | 0 | 44 | 0 |
| C | 0 | 44 | 0 |
| D | 0 | 44 | 0 |
| Mode M9 | |||
|---|---|---|---|
| Quadrant | BADHDUFLAG | Total packets | Discarded packets |
| A | 0 | 11 | 0 |
| B | 0 | 11 | 0 |
| C | 0 | 11 | 0 |
| D | 0 | 11 | 0 |
| Quadrant | Total seconds | Saturated seconds | Saturation percentage |
|---|---|---|---|
| A | 2044 | 26 | 1.272016% |
| B | 2044 | 43 | 2.103718% |
| C | 2044 | 50 | 2.446184% |
| D | 2044 | 213 | 10.420744% |
Noise dominated data is calculated using 1-second bins in cleaned event files. If a bin has >2000 counts, and if more than 50% of those come from <1% of pixels, then it is considered to be noise-dominated and hence unusable.
| Quadrant | # 1 sec bins | Bins with >0 counts | Bins with >2000 counts | High rate bins dominated by noise | Noise dominated (total time) | Noise dominated (detector-on time) | Marked lightcurve |
|---|---|---|---|---|---|---|---|
| A | 3149 | 2045 | 1 | 1 | 0.03% | 0.05% | 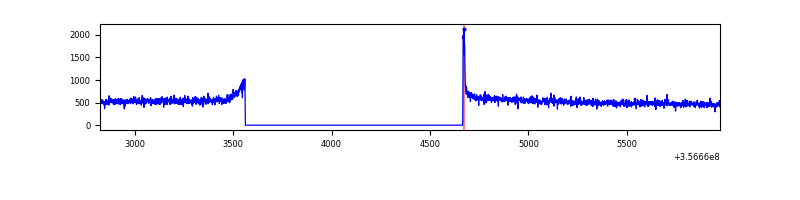 |
| B | 3149 | 2045 | 0 | 0 | 0.00% | 0.00% | 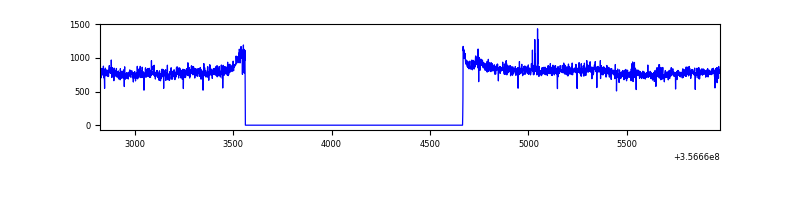 |
| C | 3149 | 2045 | 0 | 0 | 0.00% | 0.00% | 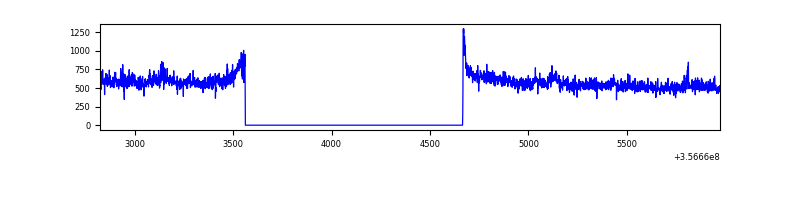 |
| D | 3149 | 2045 | 197 | 197 | 6.26% | 9.63% | 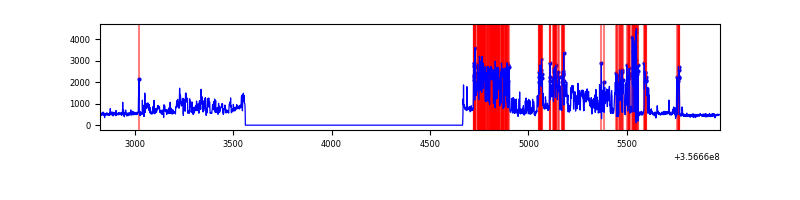 |
Top three noisy pixels from each quadrant. If the there are fewer than three noisy pixels in the level2.evt file, extra rows are filled as -1
| Pixel properties | Quadrant properties | ||||||
|---|---|---|---|---|---|---|---|
| Quadrant | DetID | PixID | Counts | Sigma | Mean | Median | Sigma |
| A | 8 | 192 | 13536 | 229.02 | 280 | 276 | 57.9 |
| A | 13 | 254 | 3772 | 60.38 | 280 | 276 | 57.9 |
| A | 3 | 137 | 2756 | 42.83 | 280 | 276 | 57.9 |
| B | 6 | 159 | 528883 | 9620.72 | 278 | 272 | 54.9 |
| B | 12 | 111 | 6355 | 110.71 | 278 | 272 | 54.9 |
| B | 11 | 111 | 5880 | 102.07 | 278 | 272 | 54.9 |
| C | 3 | 233 | 88117 | 1361.03 | 268 | 270 | 64.5 |
| C | 14 | 238 | 44225 | 681.0 | 268 | 270 | 64.5 |
| C | 2 | 114 | 4788 | 70.0 | 268 | 270 | 64.5 |
| D | 13 | 104 | 854050 | 13284.13 | 261 | 255 | 64.3 |
| D | 2 | 153 | 85014 | 1318.76 | 261 | 255 | 64.3 |
| D | 2 | 250 | 40964 | 633.39 | 261 | 255 | 64.3 |
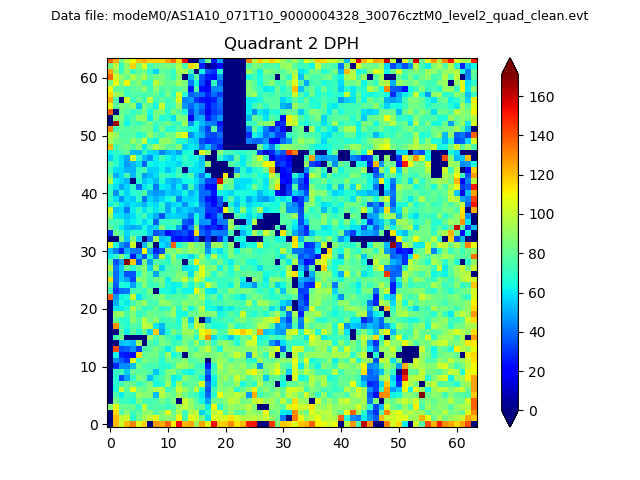
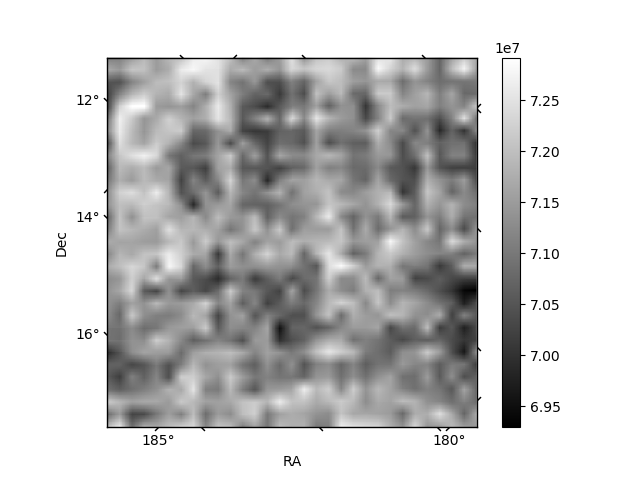
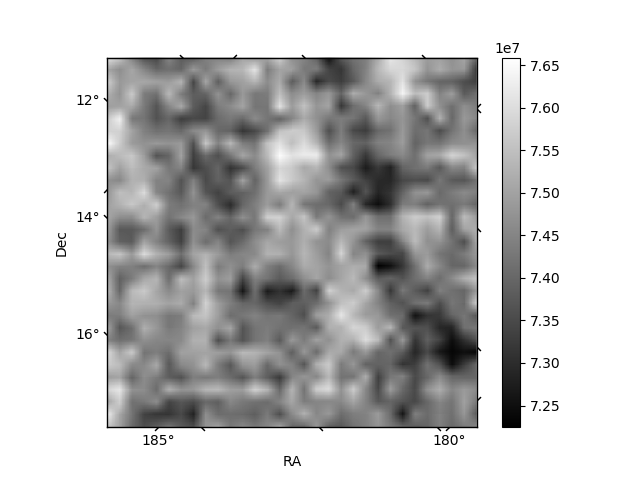
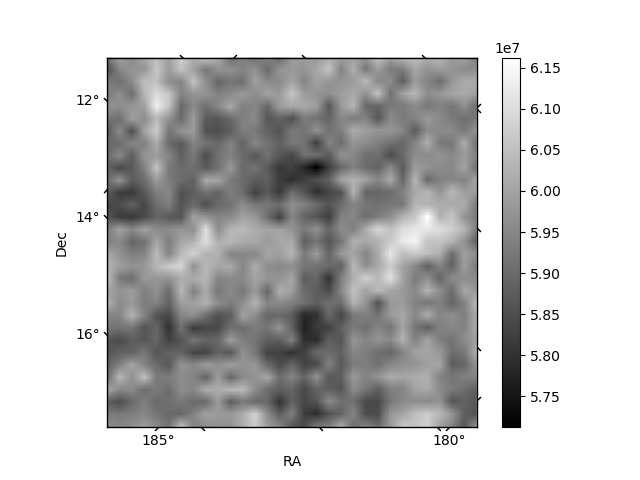
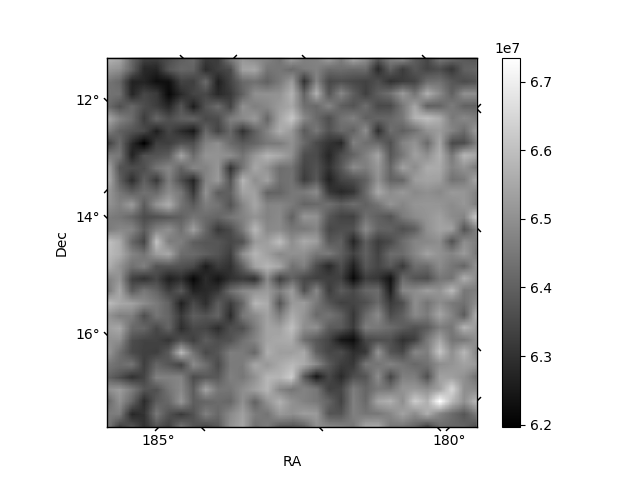
Histogram calculated using DETX and DETY for each event in the final _common_clean file
| Quadrant A | 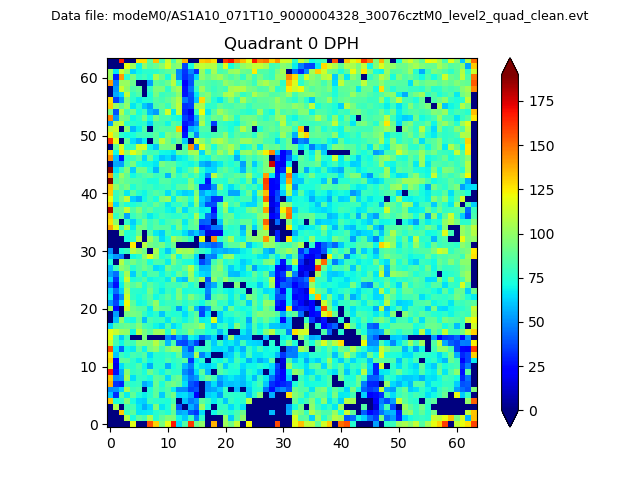 |
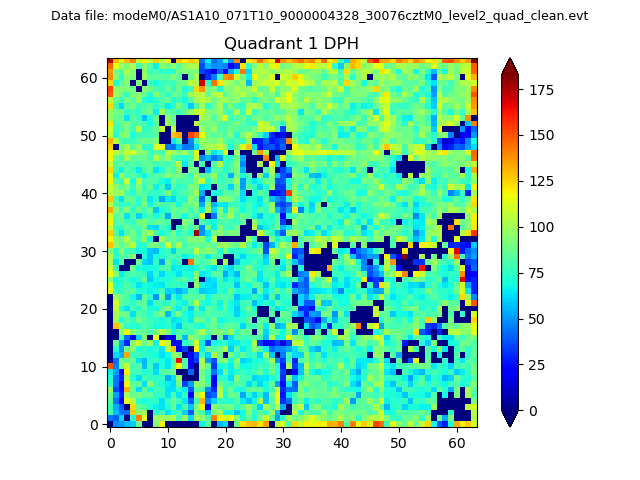 |
Quadrant B |
|---|---|---|---|
| Quadrant D | 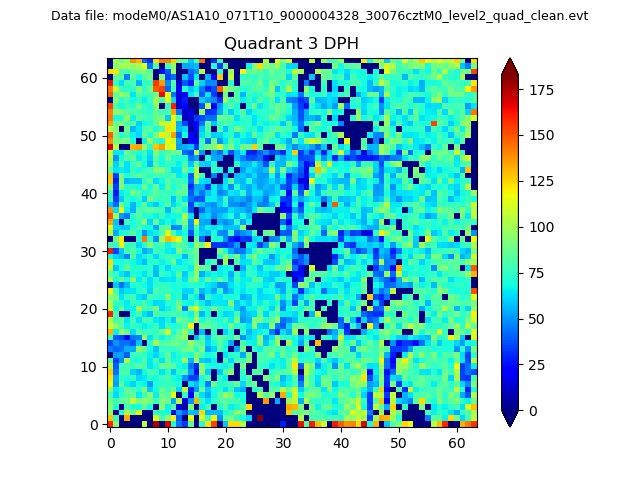 |
 |
Quadrant C |
| Plot type | Count rate plots | Images |
|---|---|---|
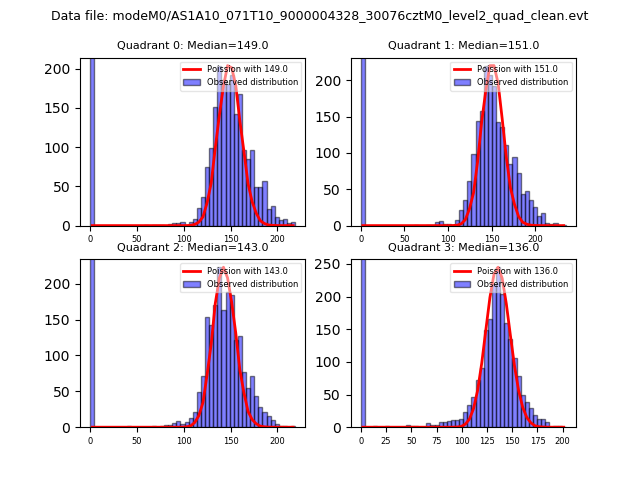
| Comparison with Poisson distribution Blue bars denote a histogram of data divided into 1 sec bins. Red curve is a Poisson curve with rate = median count rate of data. |
 |
 |
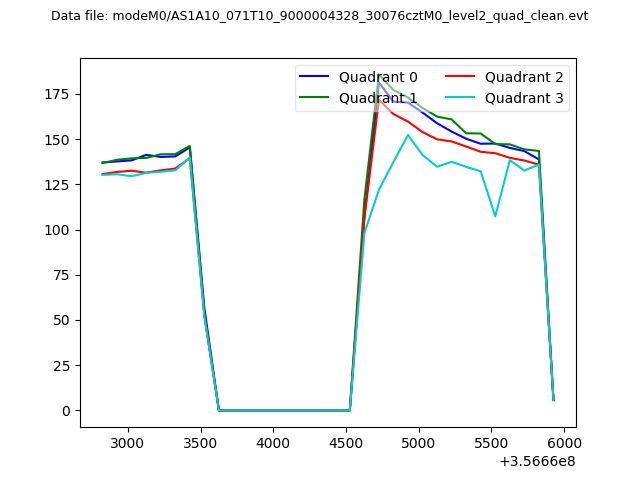
| Quadrant-wise count rates Data is divided into 100 sec bins |
 |
|
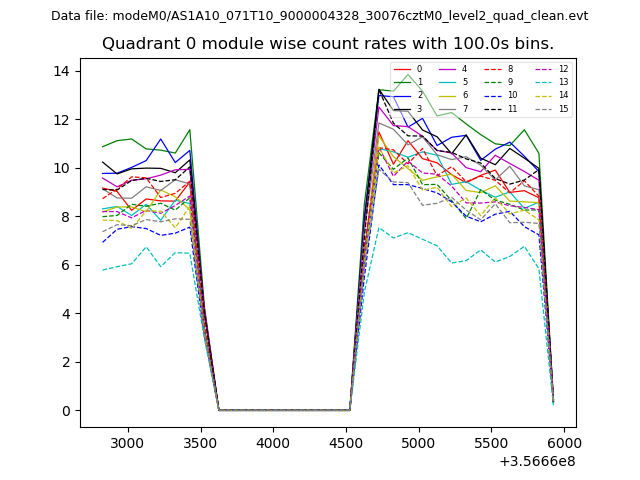
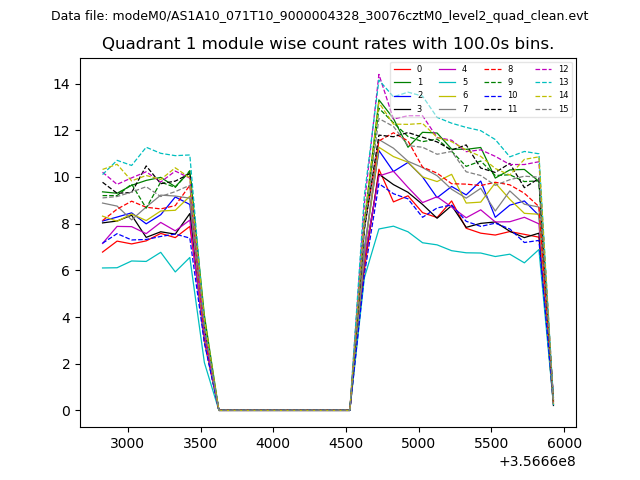
| Module-wise count rates for Quadrant A Data is divided into 100 sec bins |
 |
 |
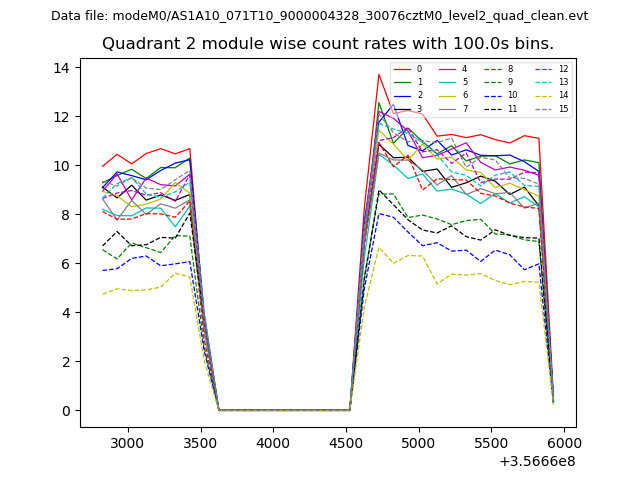
| Module-wise count rates for Quadrant B Data is divided into 100 sec bins |
 |
 |
| Module-wise count rates for Quadrant C Data is divided into 100 sec bins |
 |
 |
| Module-wise count rates for Quadrant D Data is divided into 100 sec bins |
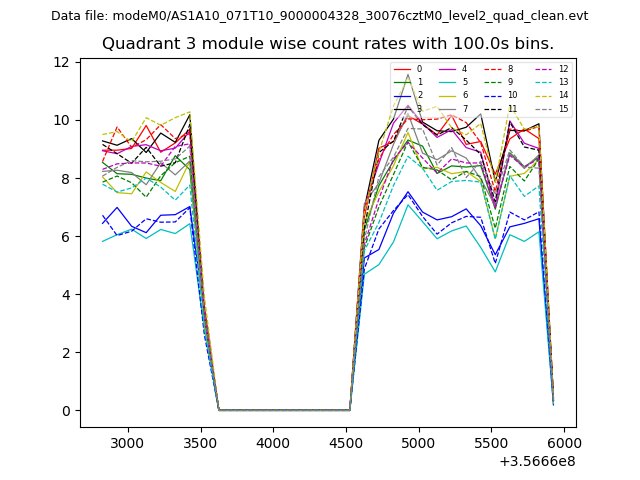 |
 |
| Parameter | Plot |
|---|---|
| CZT HV Monitor | 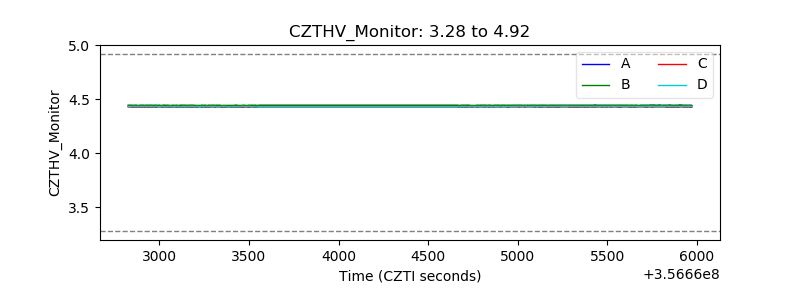 |
| D_VDD | 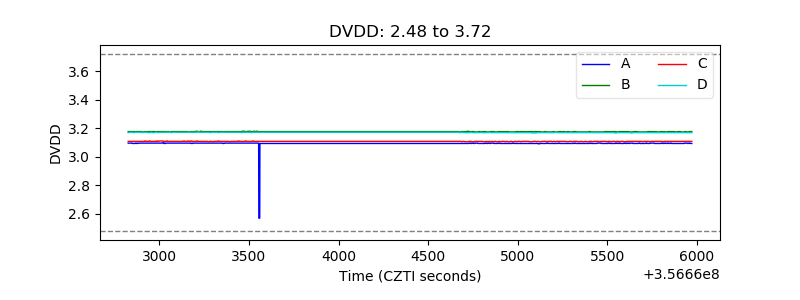 |
| Temperature 1 | 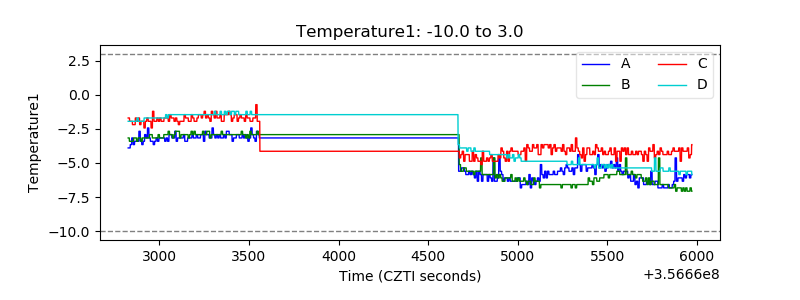 |
| Veto HV Monitor | 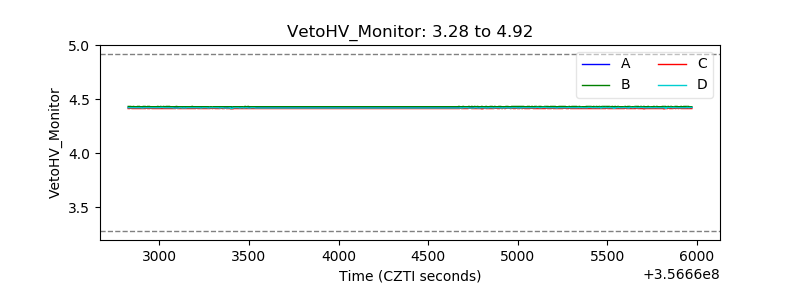 |
| Veto LLD | 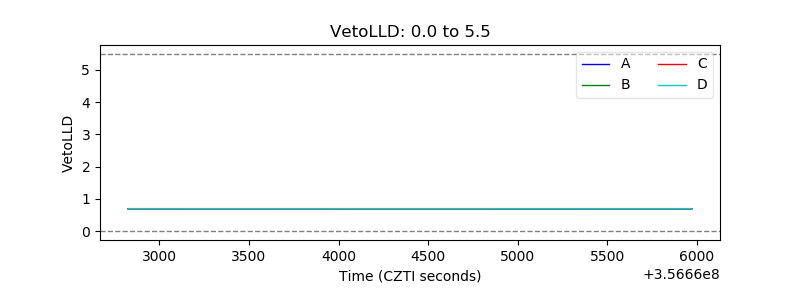 |
| Alpha Counter | 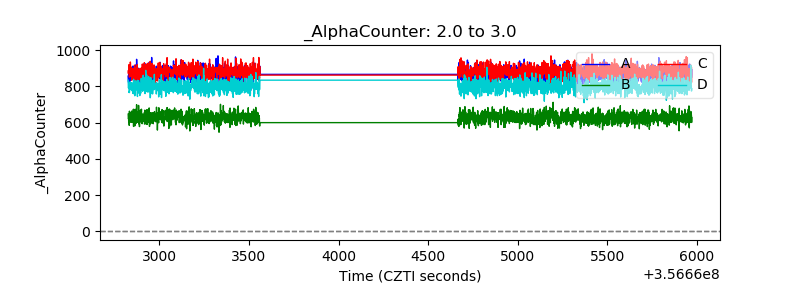 |
| _CPM_Rate | 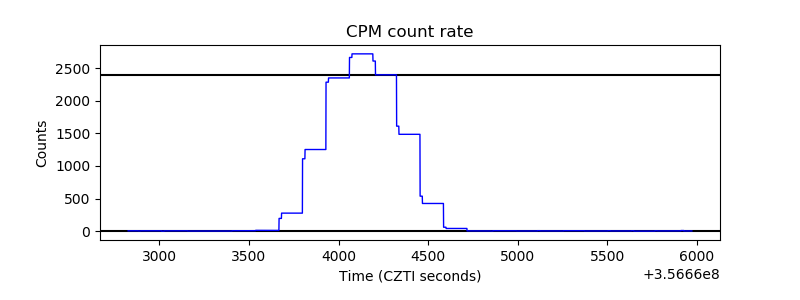 |
| CZT Counter | 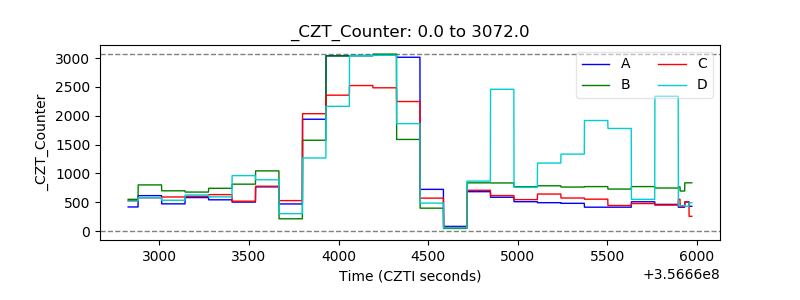 |
| +2.5 Volts monitor |  |
| +5 Volts monitor |  |
| _ROLL_ROT | 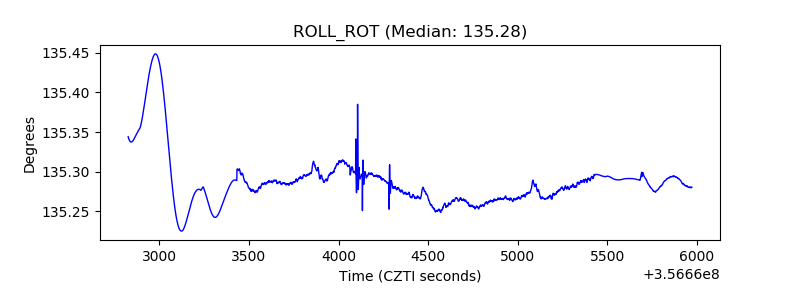 |
| _Roll_DEC |  |
| _Roll_RA | 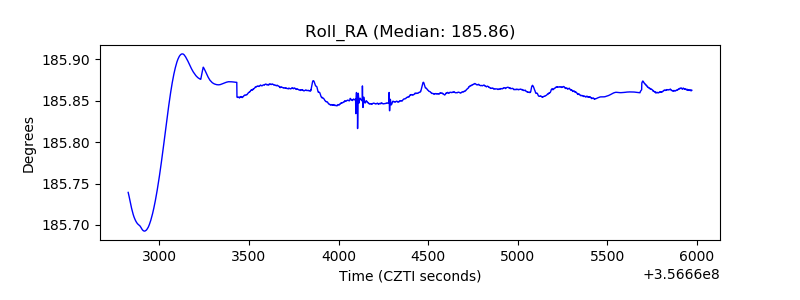 |
| Veto Counter | 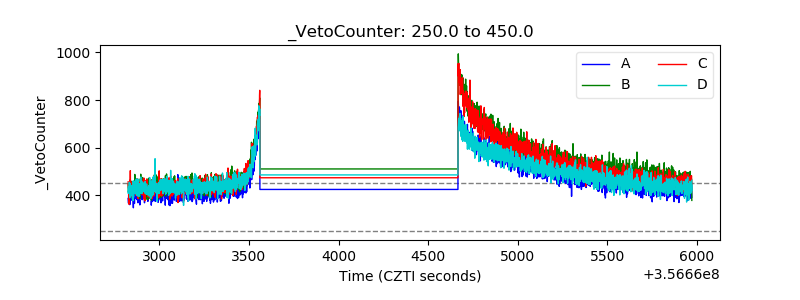 |