| Param | Original file | Final file |
|---|---|---|
| Filename | modeM0/AS1A10_071T10_9000004328_30079cztM0_level2.evt | modeM0/AS1A10_071T10_9000004328_30079cztM0_level2_quad_clean.evt |
| Size (bytes) | 569,687,040 | 68,739,840 |
| Size | 543.3 MB | 65.6 MB |
| Events in quadrant A | 3,355,905 | 434,197 |
| Events in quadrant B | 5,088,586 | 439,070 |
| Events in quadrant C | 3,466,317 | 410,026 |
| Events in quadrant D | 4,927,113 | 369,287 |
| Mode M0 | |||
|---|---|---|---|
| Quadrant | BADHDUFLAG | Total packets | Discarded packets |
| A | 0 | 13386 | 2 |
| B | 0 | 19037 | 2 |
| C | 0 | 13914 | 2 |
| D | 0 | 18419 | 2 |
| Mode SS | |||
|---|---|---|---|
| Quadrant | BADHDUFLAG | Total packets | Discarded packets |
| A | 0 | 124 | 0 |
| B | 0 | 124 | 0 |
| C | 0 | 124 | 0 |
| D | 0 | 124 | 0 |
| Mode M9 | |||
|---|---|---|---|
| Quadrant | BADHDUFLAG | Total packets | Discarded packets |
| A | 0 | 21 | 0 |
| B | 0 | 22 | 0 |
| C | 0 | 22 | 0 |
| D | 0 | 22 | 0 |
| Quadrant | Total seconds | Saturated seconds | Saturation percentage |
|---|---|---|---|
| A | 6137 | 54 | 0.879909% |
| B | 6137 | 119 | 1.939058% |
| C | 6137 | 81 | 1.319863% |
| D | 6137 | 698 | 11.373635% |
Noise dominated data is calculated using 1-second bins in cleaned event files. If a bin has >2000 counts, and if more than 50% of those come from <1% of pixels, then it is considered to be noise-dominated and hence unusable.
| Quadrant | # 1 sec bins | Bins with >0 counts | Bins with >2000 counts | High rate bins dominated by noise | Noise dominated (total time) | Noise dominated (detector-on time) | Marked lightcurve |
|---|---|---|---|---|---|---|---|
| A | 7447 | 6138 | 2 | 2 | 0.03% | 0.03% | 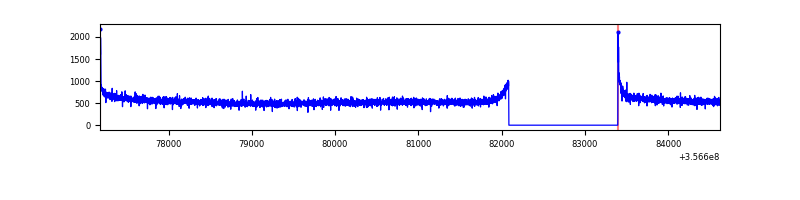 |
| B | 7447 | 6138 | 2 | 2 | 0.03% | 0.03% | 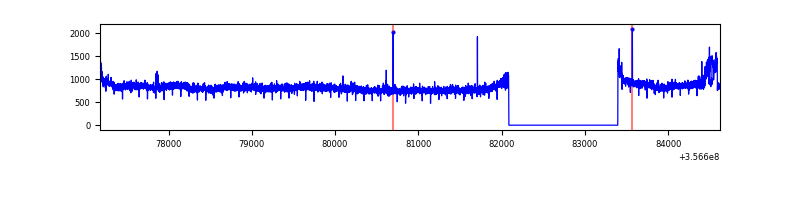 |
| C | 7447 | 6138 | 0 | 0 | 0.00% | 0.00% | 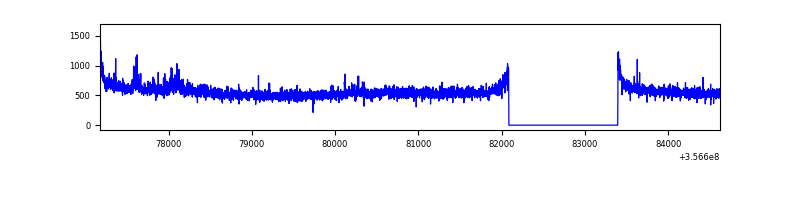 |
| D | 7447 | 6138 | 500 | 500 | 6.71% | 8.15% | 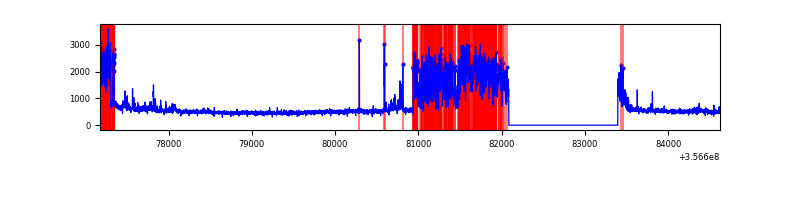 |
Top three noisy pixels from each quadrant. If the there are fewer than three noisy pixels in the level2.evt file, extra rows are filled as -1
| Pixel properties | Quadrant properties | ||||||
|---|---|---|---|---|---|---|---|
| Quadrant | DetID | PixID | Counts | Sigma | Mean | Median | Sigma |
| A | 8 | 192 | 23356 | 131.51 | 864 | 850 | 171.1 |
| A | 13 | 254 | 11755 | 63.72 | 864 | 850 | 171.1 |
| A | 3 | 137 | 8001 | 41.79 | 864 | 850 | 171.1 |
| B | 6 | 159 | 1642021 | 10128.4 | 856 | 837 | 162.0 |
| B | 0 | 229 | 84714 | 517.64 | 856 | 837 | 162.0 |
| B | 12 | 111 | 19390 | 114.5 | 856 | 837 | 162.0 |
| C | 3 | 233 | 151970 | 803.42 | 812 | 821 | 188.1 |
| C | 14 | 238 | 136672 | 722.11 | 812 | 821 | 188.1 |
| C | 2 | 114 | 14315 | 71.73 | 812 | 821 | 188.1 |
| D | 13 | 104 | 1643449 | 8899.64 | 788 | 772 | 184.6 |
| D | 8 | 195 | 158116 | 852.45 | 788 | 772 | 184.6 |
| D | 1 | 52 | 68624 | 367.61 | 788 | 772 | 184.6 |
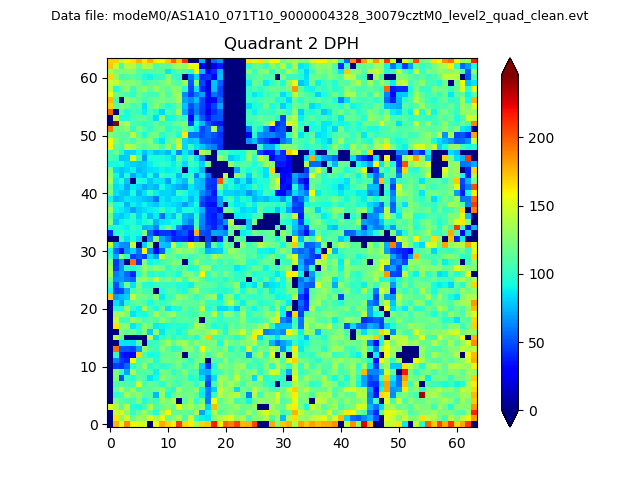
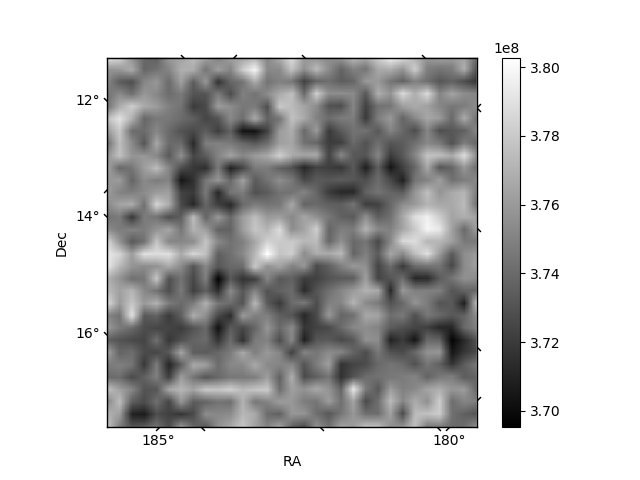
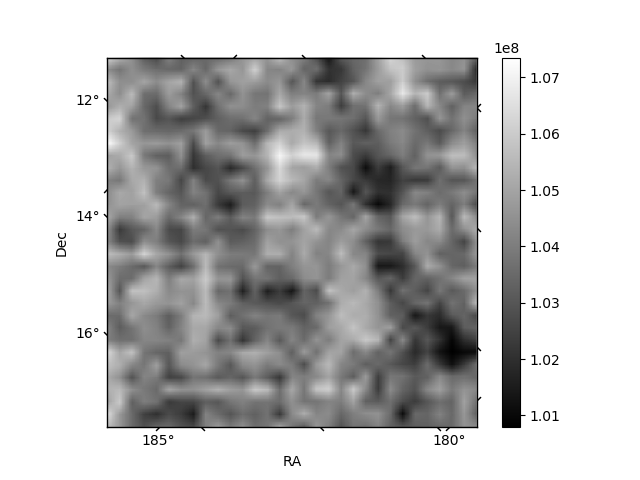
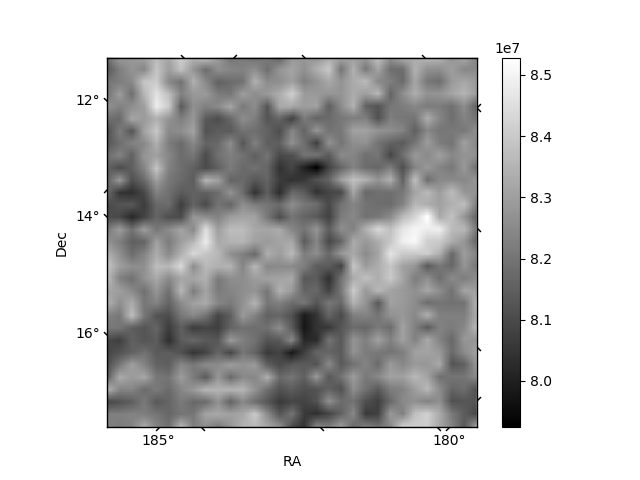
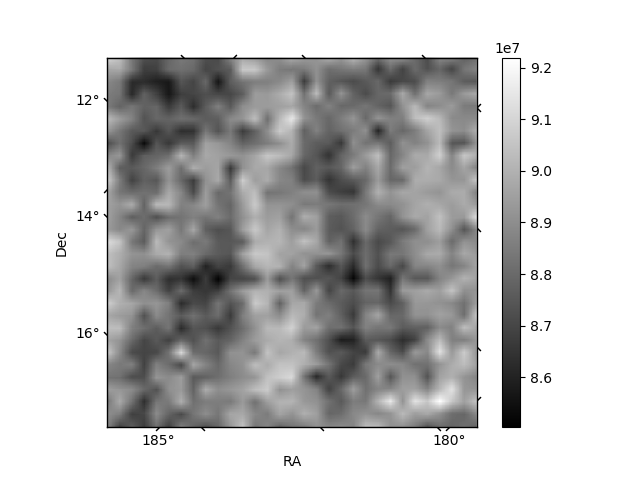
Histogram calculated using DETX and DETY for each event in the final _common_clean file
| Quadrant A | 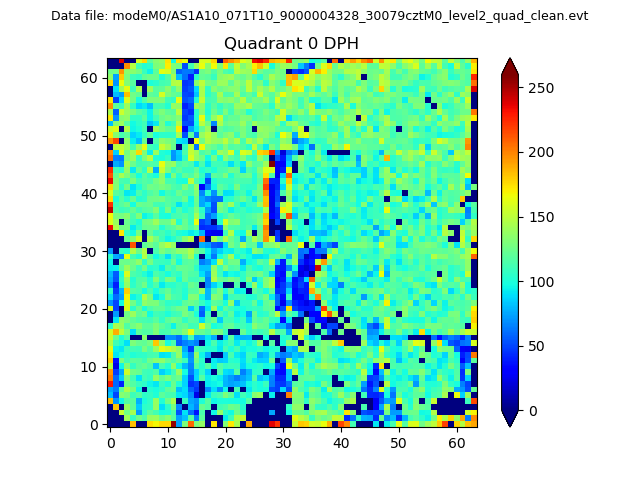 |
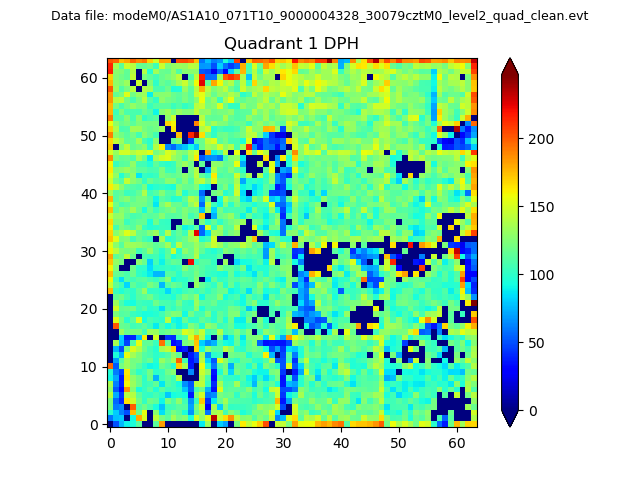 |
Quadrant B |
|---|---|---|---|
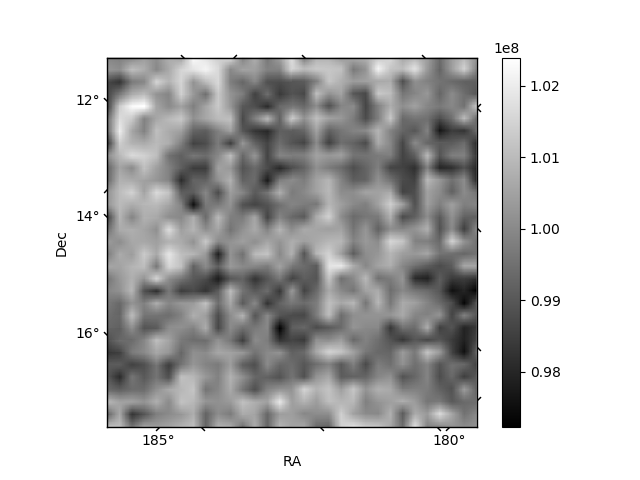
| Quadrant D | 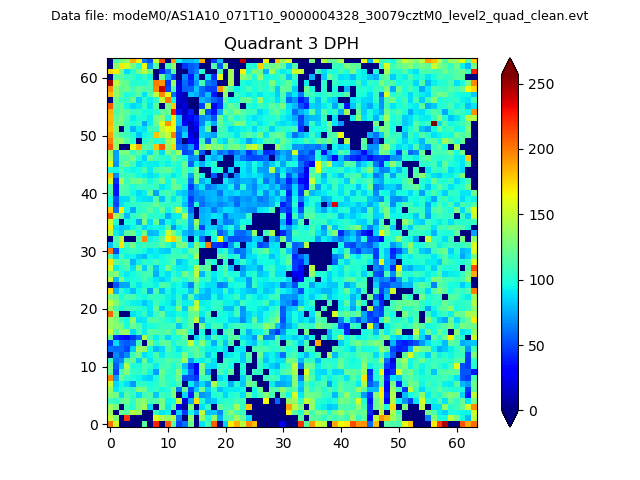 |
 |
Quadrant C |
| Plot type | Count rate plots | Images |
|---|---|---|
| Comparison with Poisson distribution Blue bars denote a histogram of data divided into 1 sec bins. Red curve is a Poisson curve with rate = median count rate of data. |
 |
 |
| Quadrant-wise count rates Data is divided into 100 sec bins |
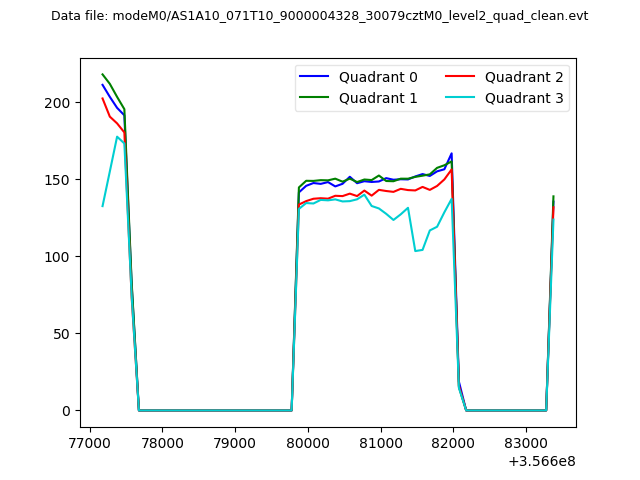 |
|
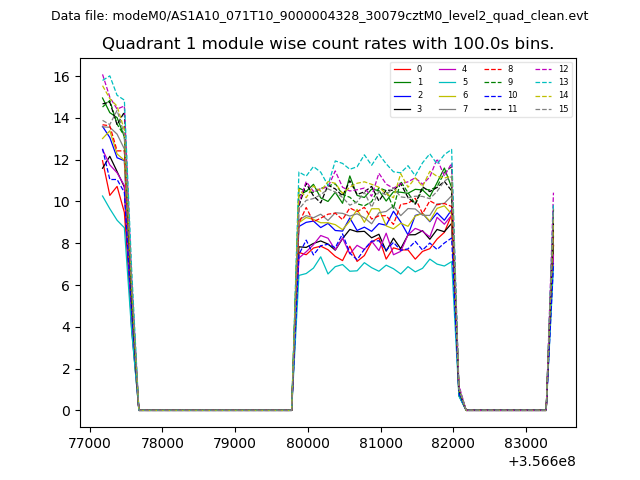
| Module-wise count rates for Quadrant A Data is divided into 100 sec bins |
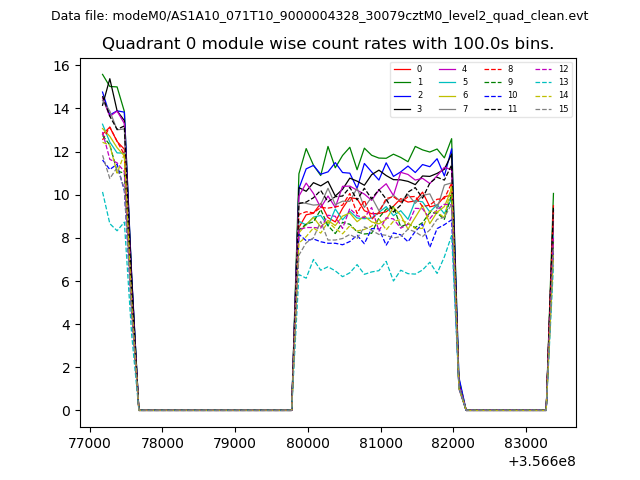 |
 |
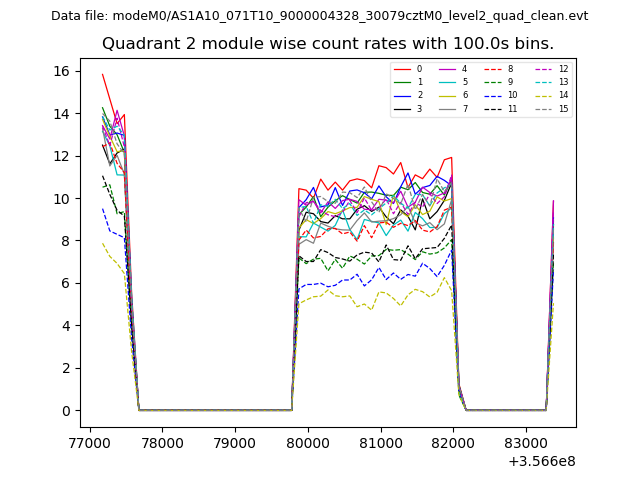
| Module-wise count rates for Quadrant B Data is divided into 100 sec bins |
 |
 |
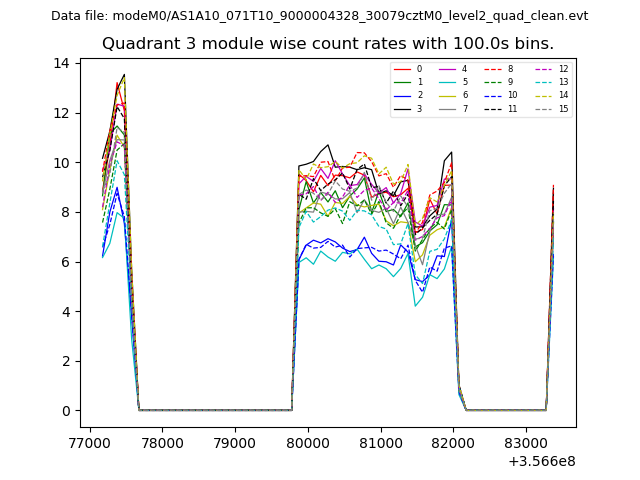
| Module-wise count rates for Quadrant C Data is divided into 100 sec bins |
 |
 |
| Module-wise count rates for Quadrant D Data is divided into 100 sec bins |
 |
 |
| Parameter | Plot |
|---|---|
| CZT HV Monitor | 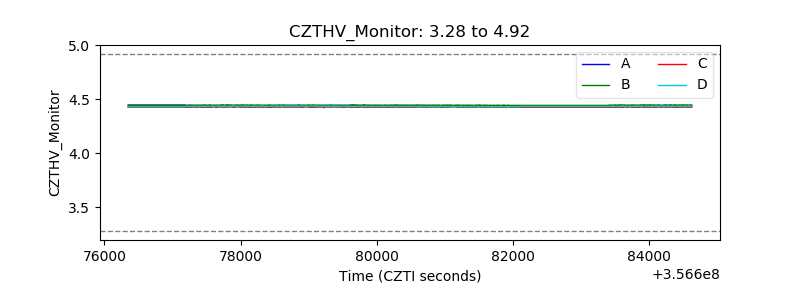 |
| D_VDD | 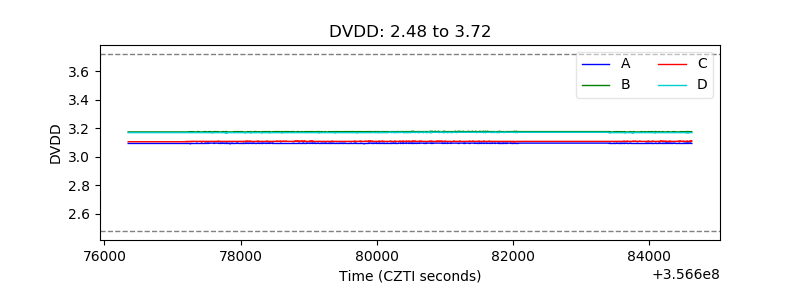 |
| Temperature 1 | 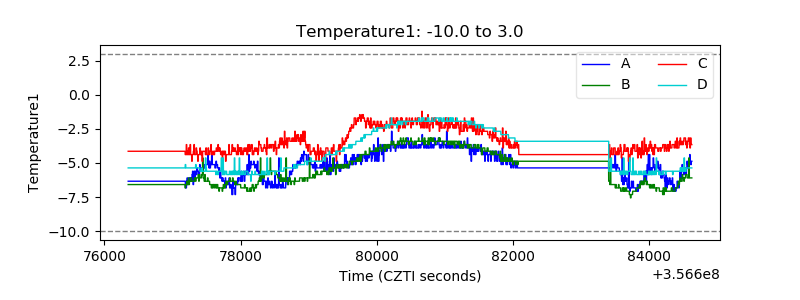 |
| Veto HV Monitor |  |
| Veto LLD | 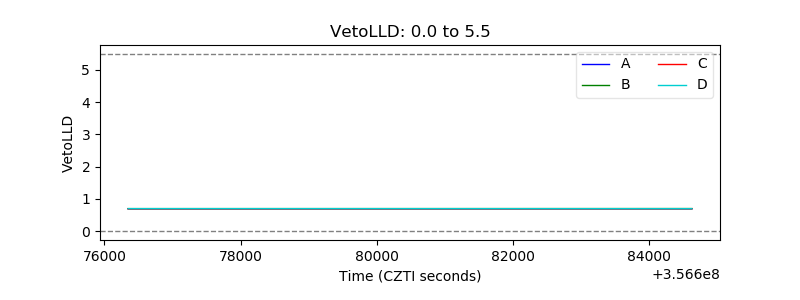 |
| Alpha Counter | 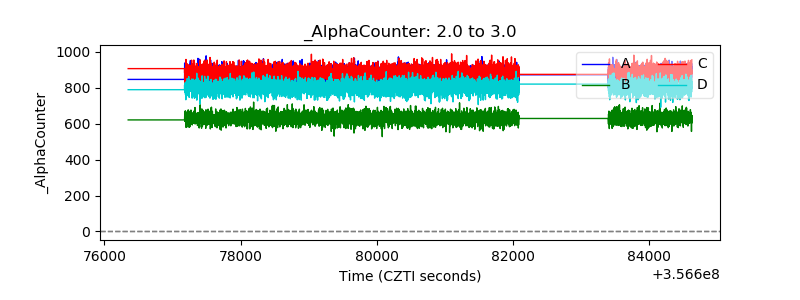 |
| _CPM_Rate | 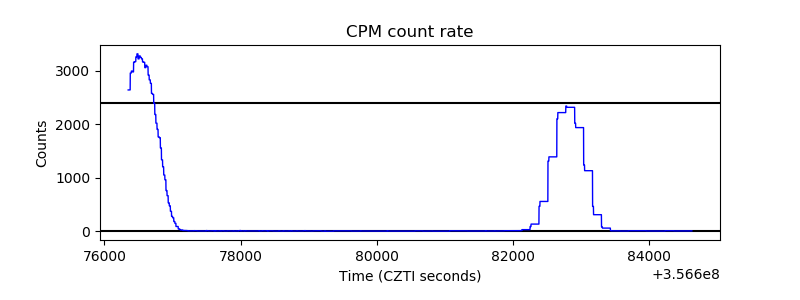 |
| CZT Counter | 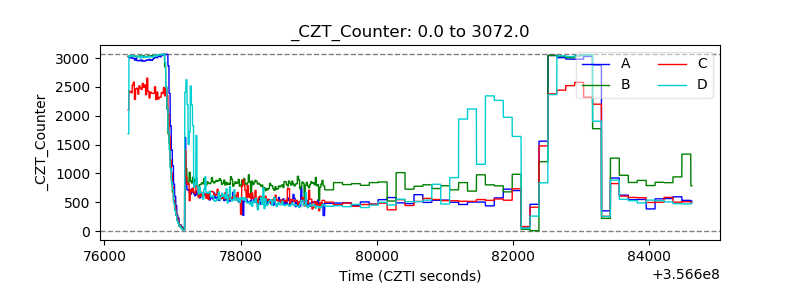 |
| +2.5 Volts monitor |  |
| +5 Volts monitor |  |
| _ROLL_ROT | 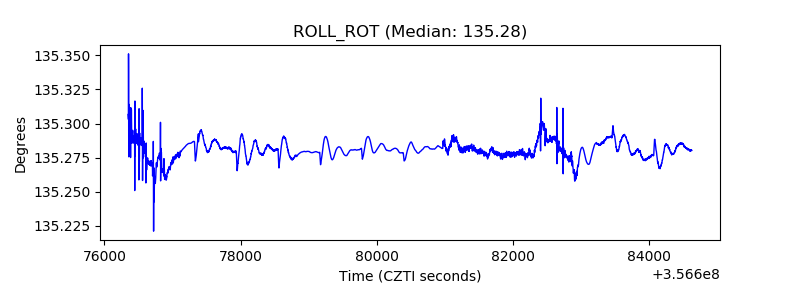 |
| _Roll_DEC | 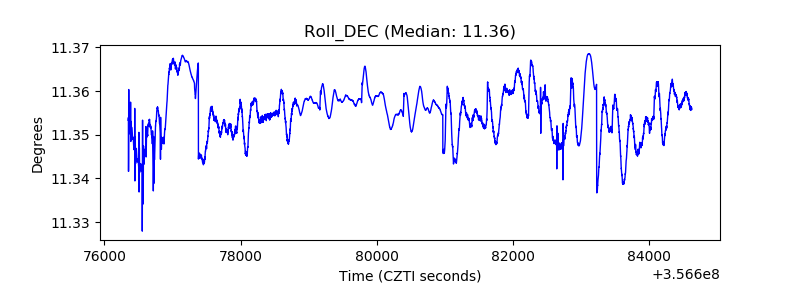 |
| _Roll_RA | 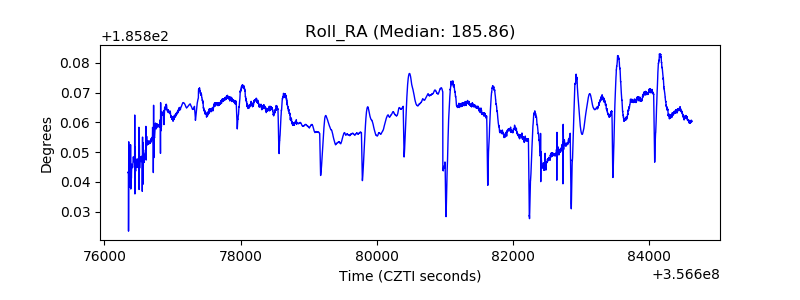 |
| Veto Counter | 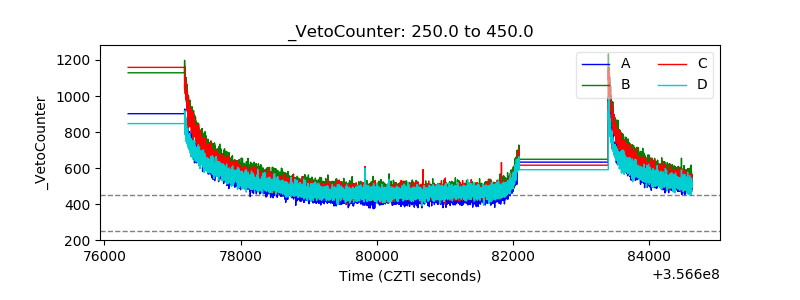 |