| Param | Original file | Final file |
|---|---|---|
| Filename | modeM0/AS1A10_071T10_9000004328_30081cztM0_level2.evt | modeM0/AS1A10_071T10_9000004328_30081cztM0_level2_quad_clean.evt |
| Size (bytes) | 563,777,280 | 74,410,560 |
| Size | 537.7 MB | 71.0 MB |
| Events in quadrant A | 3,409,791 | 473,215 |
| Events in quadrant B | 5,221,188 | 469,909 |
| Events in quadrant C | 3,516,840 | 445,835 |
| Events in quadrant D | 4,482,789 | 407,513 |
| Mode M0 | |||
|---|---|---|---|
| Quadrant | BADHDUFLAG | Total packets | Discarded packets |
| A | 0 | 13807 | 2 |
| B | 0 | 20008 | 3 |
| C | 0 | 14124 | 2 |
| D | 0 | 17168 | 2 |
| Mode SS | |||
|---|---|---|---|
| Quadrant | BADHDUFLAG | Total packets | Discarded packets |
| A | 0 | 134 | 0 |
| B | 0 | 134 | 0 |
| C | 0 | 134 | 0 |
| D | 0 | 134 | 0 |
| Mode M9 | |||
|---|---|---|---|
| Quadrant | BADHDUFLAG | Total packets | Discarded packets |
| A | 0 | 17 | 0 |
| B | 0 | 18 | 0 |
| C | 0 | 18 | 0 |
| D | 0 | 18 | 0 |
| Quadrant | Total seconds | Saturated seconds | Saturation percentage |
|---|---|---|---|
| A | 6540 | 101 | 1.544343% |
| B | 6539 | 175 | 2.676250% |
| C | 6539 | 149 | 2.278636% |
| D | 6539 | 597 | 9.129836% |
Noise dominated data is calculated using 1-second bins in cleaned event files. If a bin has >2000 counts, and if more than 50% of those come from <1% of pixels, then it is considered to be noise-dominated and hence unusable.
| Quadrant | # 1 sec bins | Bins with >0 counts | Bins with >2000 counts | High rate bins dominated by noise | Noise dominated (total time) | Noise dominated (detector-on time) | Marked lightcurve |
|---|---|---|---|---|---|---|---|
| A | 7596 | 6542 | 1 | 1 | 0.01% | 0.02% |  |
| B | 7595 | 6541 | 2 | 2 | 0.03% | 0.03% |  |
| C | 7595 | 6541 | 11 | 11 | 0.14% | 0.17% |  |
| D | 7595 | 6541 | 473 | 473 | 6.23% | 7.23% |  |
Top three noisy pixels from each quadrant. If the there are fewer than three noisy pixels in the level2.evt file, extra rows are filled as -1
| Pixel properties | Quadrant properties | ||||||
|---|---|---|---|---|---|---|---|
| Quadrant | DetID | PixID | Counts | Sigma | Mean | Median | Sigma |
| A | 8 | 192 | 27607 | 151.66 | 877 | 860 | 176.4 |
| A | 13 | 254 | 11316 | 59.29 | 877 | 860 | 176.4 |
| A | 3 | 137 | 8626 | 44.03 | 877 | 860 | 176.4 |
| B | 6 | 159 | 1792725 | 10868.64 | 862 | 843 | 164.9 |
| B | 0 | 229 | 31815 | 187.86 | 862 | 843 | 164.9 |
| B | 12 | 111 | 20647 | 120.12 | 862 | 843 | 164.9 |
| C | 14 | 238 | 139011 | 711.5 | 828 | 835 | 194.2 |
| C | 3 | 233 | 115334 | 589.58 | 828 | 835 | 194.2 |
| C | 2 | 114 | 15083 | 73.37 | 828 | 835 | 194.2 |
| D | 13 | 104 | 1181156 | 6202.14 | 804 | 789 | 190.3 |
| D | 8 | 195 | 167093 | 873.83 | 804 | 789 | 190.3 |
| D | 2 | 250 | 49580 | 256.37 | 804 | 789 | 190.3 |
Histogram calculated using DETX and DETY for each event in the final _common_clean file
| Quadrant A |  |
 |
Quadrant B |
|---|---|---|---|
| Quadrant D |  |
 |
Quadrant C |
| Plot type | Count rate plots | Images |
|---|---|---|
| Comparison with Poisson distribution Blue bars denote a histogram of data divided into 1 sec bins. Red curve is a Poisson curve with rate = median count rate of data. |
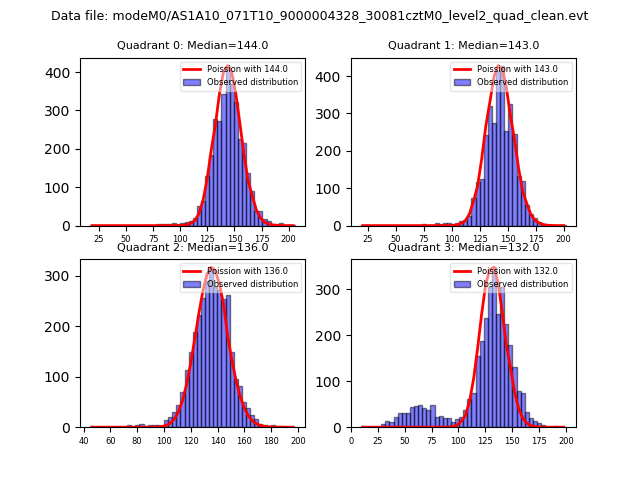 |
 |
| Quadrant-wise count rates Data is divided into 100 sec bins |
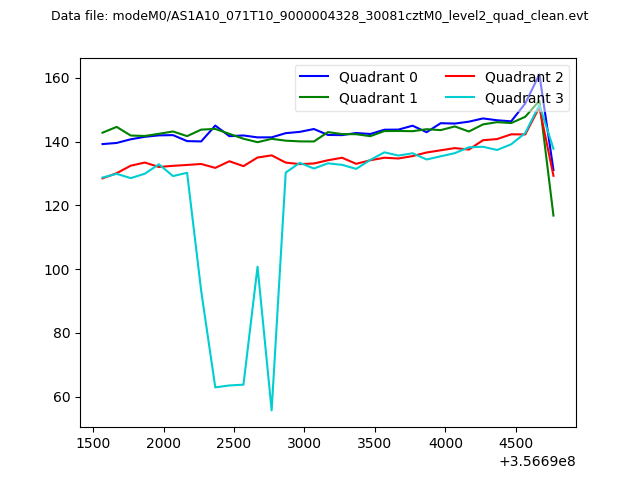 |
|
| Module-wise count rates for Quadrant A Data is divided into 100 sec bins |
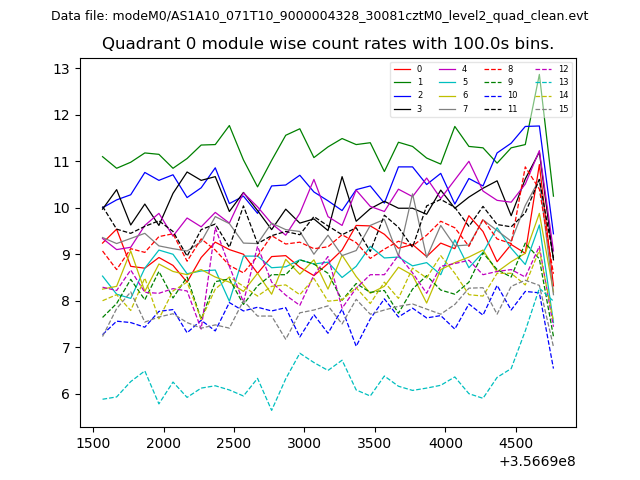 |
 |
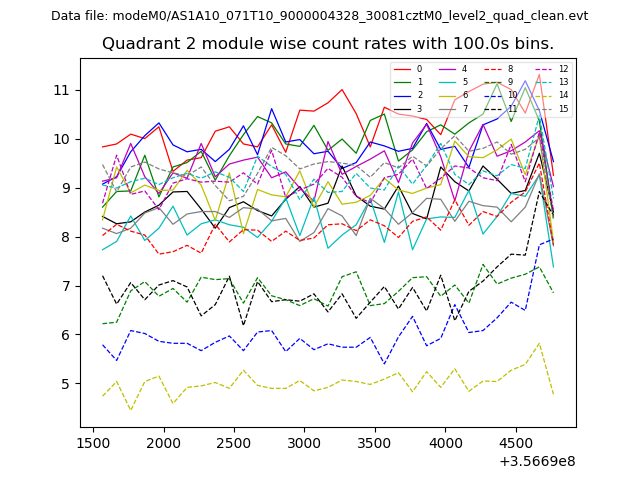
| Module-wise count rates for Quadrant B Data is divided into 100 sec bins |
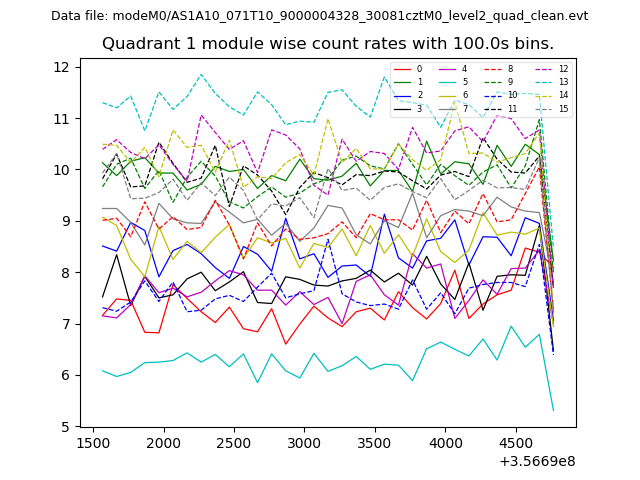 |
 |
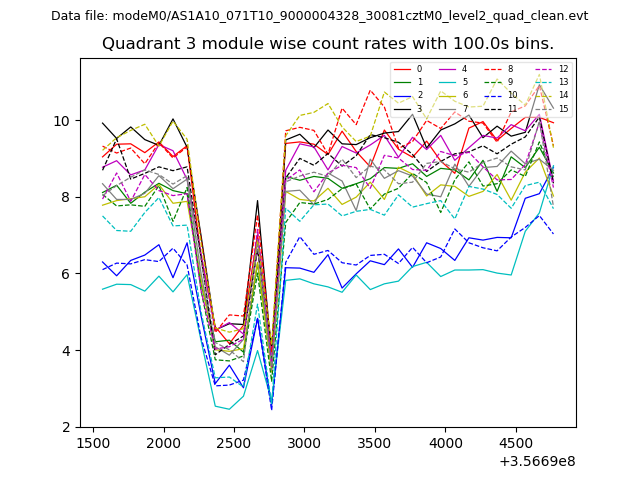
| Module-wise count rates for Quadrant C Data is divided into 100 sec bins |
 |
 |
| Module-wise count rates for Quadrant D Data is divided into 100 sec bins |
 |
 |
| Parameter | Plot |
|---|---|
| CZT HV Monitor | 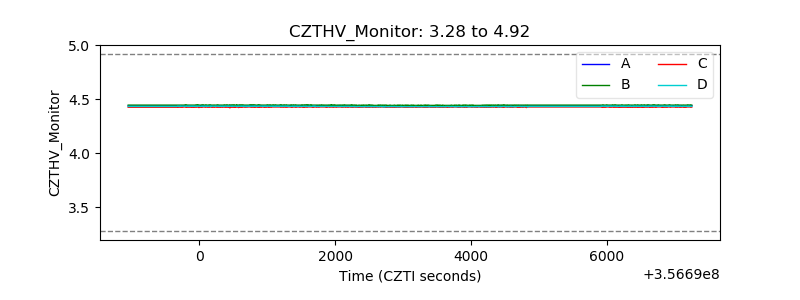 |
| D_VDD |  |
| Temperature 1 |  |
| Veto HV Monitor | 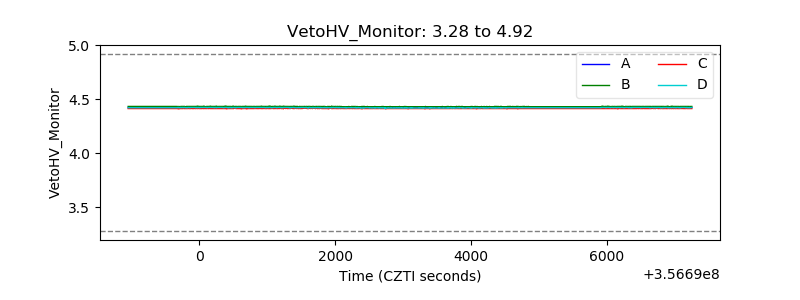 |
| Veto LLD |  |
| Alpha Counter | 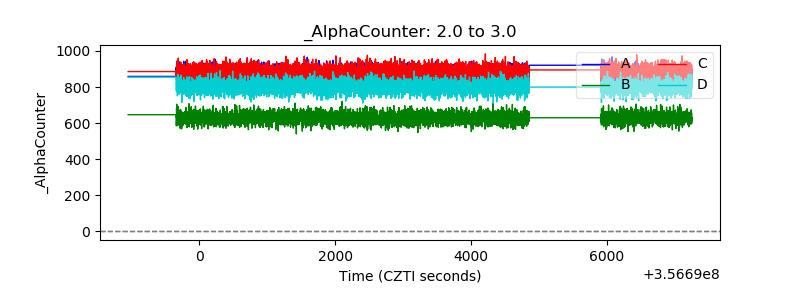 |
| _CPM_Rate | 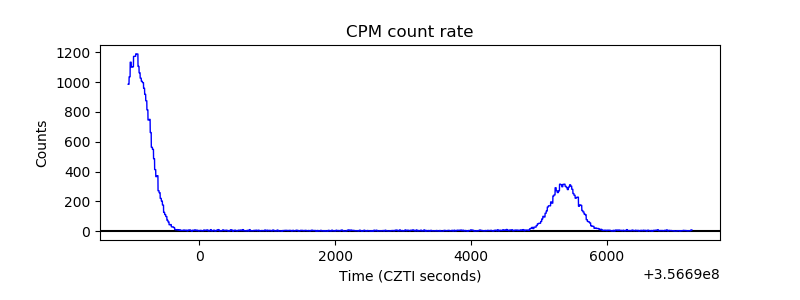 |
| CZT Counter |  |
| +2.5 Volts monitor |  |
| +5 Volts monitor |  |
| _ROLL_ROT | 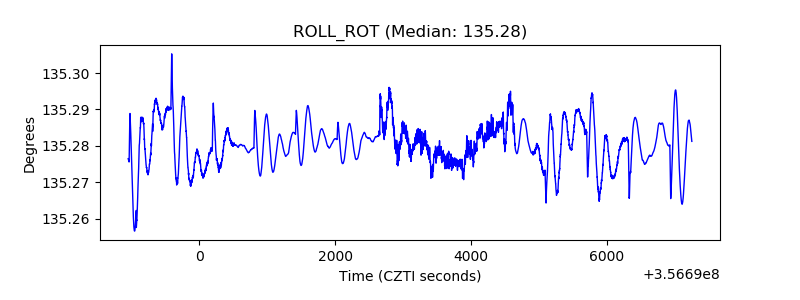 |
| _Roll_DEC | 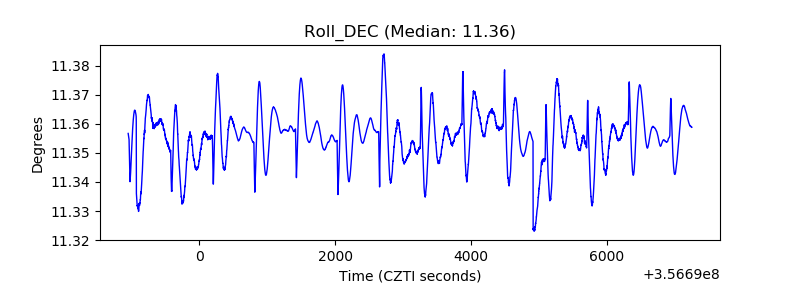 |
| _Roll_RA |  |
| Veto Counter | 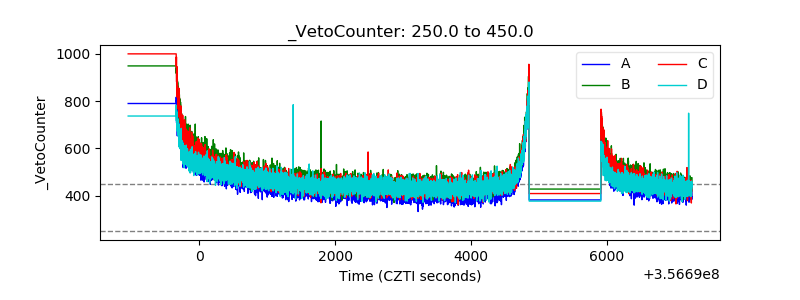 |