| Param | Original file | Final file |
|---|---|---|
| Filename | modeM0/AS1A10_071T10_9000004328_30083cztM0_level2.evt | modeM0/AS1A10_071T10_9000004328_30083cztM0_level2_quad_clean.evt |
| Size (bytes) | 625,023,360 | 92,862,720 |
| Size | 596.1 MB | 88.6 MB |
| Events in quadrant A | 3,981,638 | 578,510 |
| Events in quadrant B | 6,264,059 | 578,341 |
| Events in quadrant C | 4,030,814 | 550,434 |
| Events in quadrant D | 4,109,331 | 547,815 |
| Mode M0 | |||
|---|---|---|---|
| Quadrant | BADHDUFLAG | Total packets | Discarded packets |
| A | 0 | 16771 | 2 |
| B | 0 | 24506 | 2 |
| C | 0 | 16870 | 2 |
| D | 0 | 17014 | 2 |
| Mode SS | |||
|---|---|---|---|
| Quadrant | BADHDUFLAG | Total packets | Discarded packets |
| A | 0 | 166 | 0 |
| B | 0 | 166 | 0 |
| C | 0 | 166 | 0 |
| D | 0 | 166 | 0 |
| Mode M9 | |||
|---|---|---|---|
| Quadrant | BADHDUFLAG | Total packets | Discarded packets |
| A | 0 | 9 | 0 |
| B | 0 | 9 | 0 |
| C | 0 | 9 | 0 |
| D | 0 | 9 | 0 |
| Quadrant | Total seconds | Saturated seconds | Saturation percentage |
|---|---|---|---|
| A | 8005 | 270 | 3.372892% |
| B | 8006 | 401 | 5.008743% |
| C | 8006 | 346 | 4.321759% |
| D | 8006 | 191 | 2.385711% |
Noise dominated data is calculated using 1-second bins in cleaned event files. If a bin has >2000 counts, and if more than 50% of those come from <1% of pixels, then it is considered to be noise-dominated and hence unusable.
| Quadrant | # 1 sec bins | Bins with >0 counts | Bins with >2000 counts | High rate bins dominated by noise | Noise dominated (total time) | Noise dominated (detector-on time) | Marked lightcurve |
|---|---|---|---|---|---|---|---|
| A | 8930 | 8008 | 0 | 0 | 0.00% | 0.00% |  |
| B | 8931 | 8009 | 6 | 6 | 0.07% | 0.07% |  |
| C | 8931 | 8009 | 4 | 4 | 0.04% | 0.05% |  |
| D | 8931 | 8009 | 7 | 7 | 0.08% | 0.09% |  |
Top three noisy pixels from each quadrant. If the there are fewer than three noisy pixels in the level2.evt file, extra rows are filled as -1
| Pixel properties | Quadrant properties | ||||||
|---|---|---|---|---|---|---|---|
| Quadrant | DetID | PixID | Counts | Sigma | Mean | Median | Sigma |
| A | 8 | 192 | 24256 | 112.17 | 1026 | 1003 | 207.3 |
| A | 13 | 254 | 13373 | 59.67 | 1026 | 1003 | 207.3 |
| A | 3 | 137 | 10970 | 48.08 | 1026 | 1003 | 207.3 |
| B | 6 | 159 | 2226975 | 11469.78 | 1002 | 977 | 194.1 |
| B | 0 | 229 | 71557 | 363.67 | 1002 | 977 | 194.1 |
| B | 12 | 111 | 25213 | 124.88 | 1002 | 977 | 194.1 |
| C | 14 | 238 | 168854 | 732.03 | 974 | 977 | 229.3 |
| C | 14 | 254 | 19770 | 81.95 | 974 | 977 | 229.3 |
| C | 2 | 114 | 18922 | 78.25 | 974 | 977 | 229.3 |
| D | 8 | 195 | 150109 | 625.76 | 989 | 964 | 238.3 |
| D | 7 | 223 | 101953 | 423.72 | 989 | 964 | 238.3 |
| D | 13 | 104 | 52141 | 214.72 | 989 | 964 | 238.3 |
Histogram calculated using DETX and DETY for each event in the final _common_clean file
| Quadrant A |  |
 |
Quadrant B |
|---|---|---|---|
| Quadrant D |  |
 |
Quadrant C |
| Plot type | Count rate plots | Images |
|---|---|---|
| Comparison with Poisson distribution Blue bars denote a histogram of data divided into 1 sec bins. Red curve is a Poisson curve with rate = median count rate of data. |
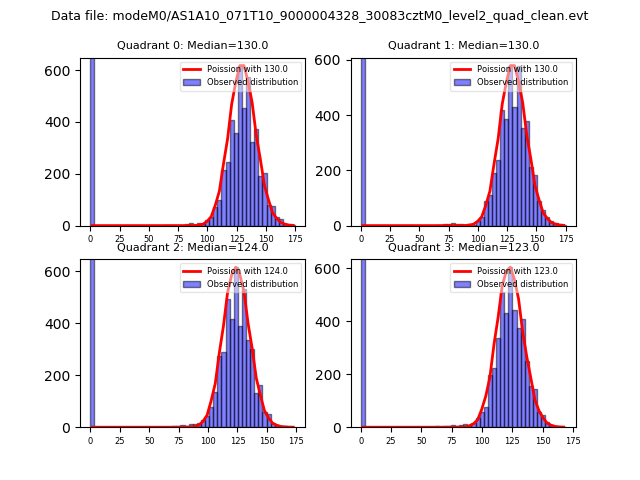 |
 |
| Quadrant-wise count rates Data is divided into 100 sec bins |
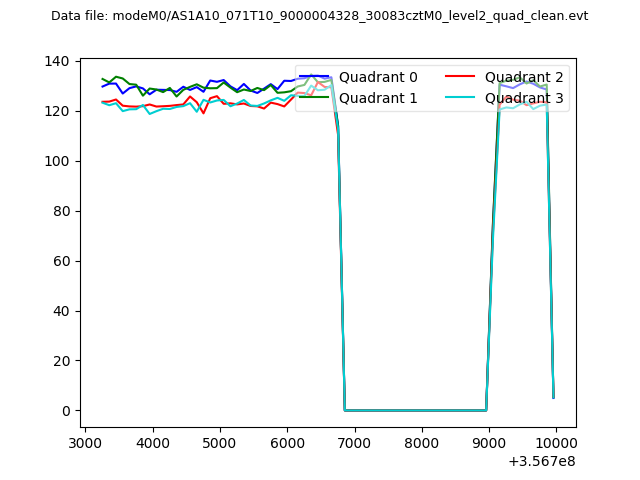 |
|
| Module-wise count rates for Quadrant A Data is divided into 100 sec bins |
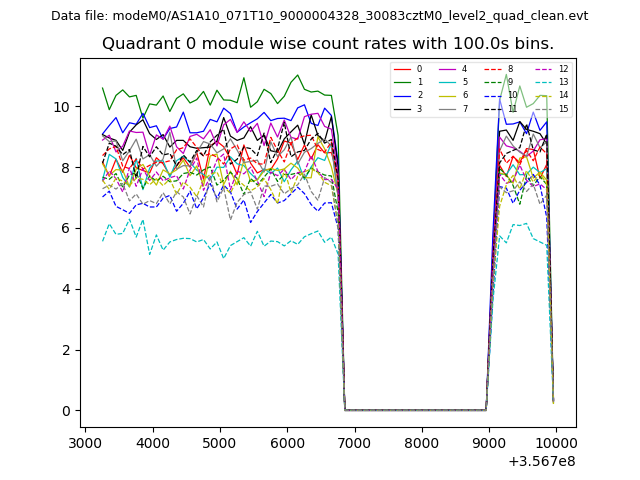 |
 |
| Module-wise count rates for Quadrant B Data is divided into 100 sec bins |
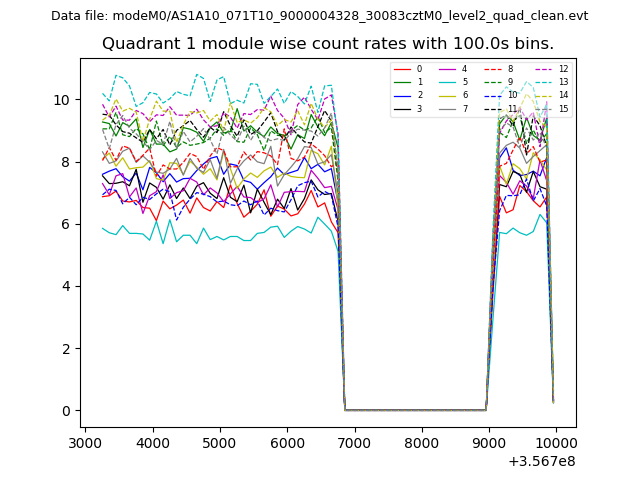 |
 |
| Module-wise count rates for Quadrant C Data is divided into 100 sec bins |
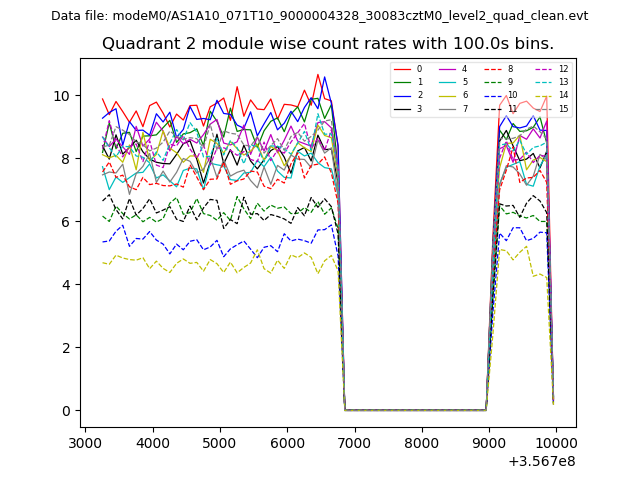 |
 |
| Module-wise count rates for Quadrant D Data is divided into 100 sec bins |
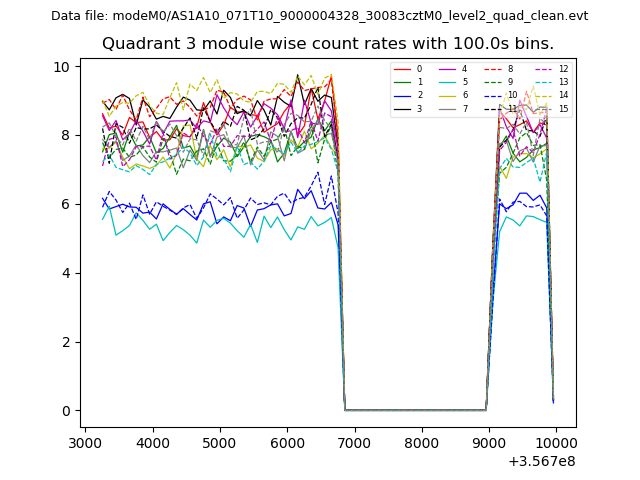 |
 |
| Parameter | Plot |
|---|---|
| CZT HV Monitor | 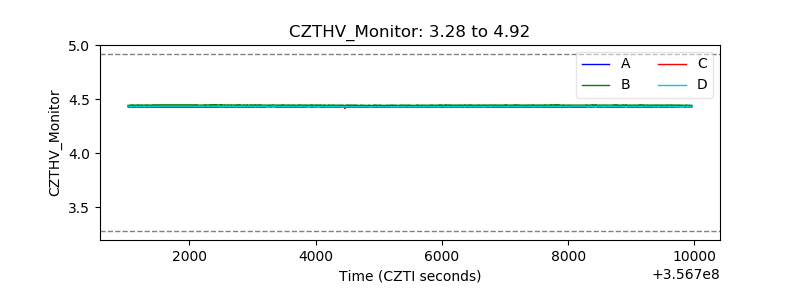 |
| D_VDD |  |
| Temperature 1 |  |
| Veto HV Monitor | 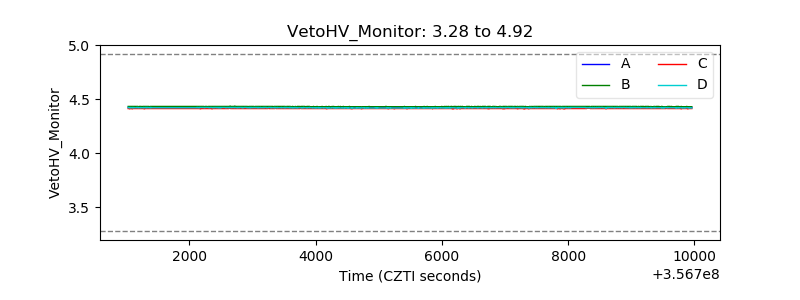 |
| Veto LLD |  |
| Alpha Counter | 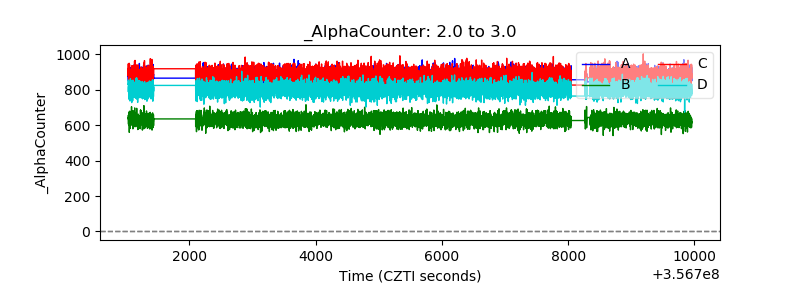 |
| _CPM_Rate | 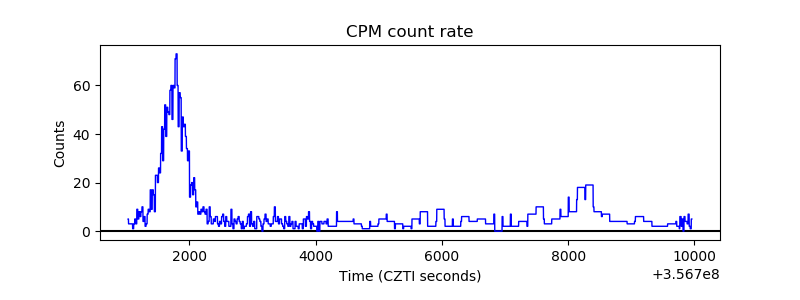 |
| CZT Counter |  |
| +2.5 Volts monitor |  |
| +5 Volts monitor |  |
| _ROLL_ROT | 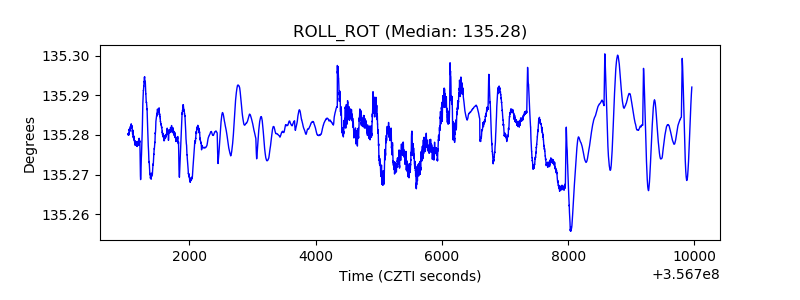 |
| _Roll_DEC | 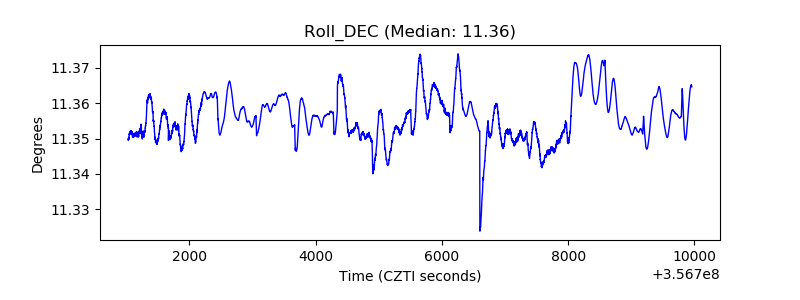 |
| _Roll_RA |  |
| Veto Counter | 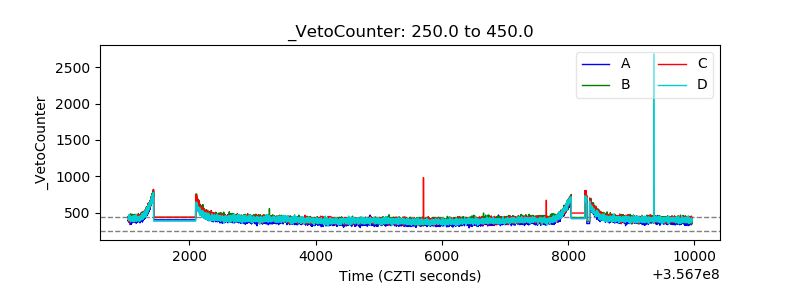 |