| Param | Original file | Final file |
|---|---|---|
| Filename | modeM0/AS1A10_071T10_9000004328_30084cztM0_level2.evt | modeM0/AS1A10_071T10_9000004328_30084cztM0_level2_quad_clean.evt |
| Size (bytes) | 613,356,480 | 99,336,960 |
| Size | 584.9 MB | 94.7 MB |
| Events in quadrant A | 3,889,200 | 632,372 |
| Events in quadrant B | 5,983,545 | 630,214 |
| Events in quadrant C | 3,909,998 | 601,360 |
| Events in quadrant D | 4,259,728 | 597,579 |
| Mode M0 | |||
|---|---|---|---|
| Quadrant | BADHDUFLAG | Total packets | Discarded packets |
| A | 0 | 16490 | 2 |
| B | 0 | 23932 | 4 |
| C | 0 | 16489 | 2 |
| D | 0 | 17346 | 2 |
| Mode SS | |||
|---|---|---|---|
| Quadrant | BADHDUFLAG | Total packets | Discarded packets |
| A | 0 | 162 | 0 |
| B | 0 | 162 | 0 |
| C | 0 | 162 | 0 |
| D | 0 | 162 | 0 |
| Mode M9 | |||
|---|---|---|---|
| Quadrant | BADHDUFLAG | Total packets | Discarded packets |
| A | 0 | 4 | 0 |
| B | 0 | 4 | 0 |
| C | 0 | 4 | 0 |
| D | 0 | 4 | 0 |
| Quadrant | Total seconds | Saturated seconds | Saturation percentage |
|---|---|---|---|
| A | 7863 | 252 | 3.204884% |
| B | 7862 | 409 | 5.202239% |
| C | 7863 | 316 | 4.018822% |
| D | 7863 | 233 | 2.963246% |
Noise dominated data is calculated using 1-second bins in cleaned event files. If a bin has >2000 counts, and if more than 50% of those come from <1% of pixels, then it is considered to be noise-dominated and hence unusable.
| Quadrant | # 1 sec bins | Bins with >0 counts | Bins with >2000 counts | High rate bins dominated by noise | Noise dominated (total time) | Noise dominated (detector-on time) | Marked lightcurve |
|---|---|---|---|---|---|---|---|
| A | 8293 | 7866 | 0 | 0 | 0.00% | 0.00% |  |
| B | 8292 | 7865 | 5 | 5 | 0.06% | 0.06% | 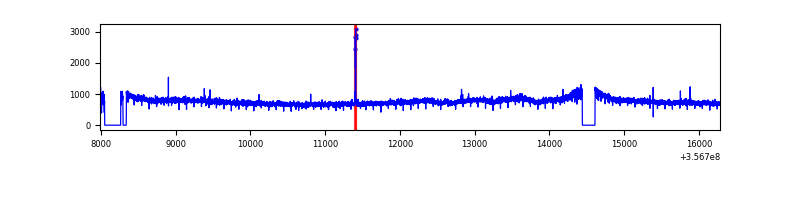 |
| C | 8293 | 7866 | 0 | 0 | 0.00% | 0.00% | 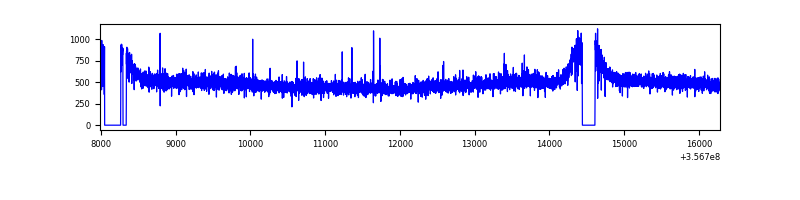 |
| D | 8293 | 7866 | 28 | 28 | 0.34% | 0.36% | 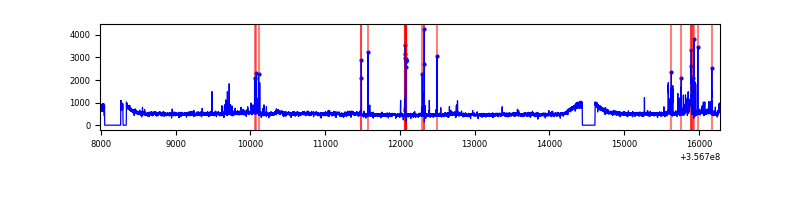 |
Top three noisy pixels from each quadrant. If the there are fewer than three noisy pixels in the level2.evt file, extra rows are filled as -1
| Pixel properties | Quadrant properties | ||||||
|---|---|---|---|---|---|---|---|
| Quadrant | DetID | PixID | Counts | Sigma | Mean | Median | Sigma |
| A | 8 | 192 | 22694 | 106.83 | 1002 | 978 | 203.3 |
| A | 13 | 254 | 13136 | 59.81 | 1002 | 978 | 203.3 |
| A | 3 | 137 | 10335 | 46.03 | 1002 | 978 | 203.3 |
| B | 6 | 159 | 2101547 | 10993.13 | 978 | 952 | 191.1 |
| B | 12 | 111 | 24428 | 122.86 | 978 | 952 | 191.1 |
| B | 11 | 111 | 22725 | 113.95 | 978 | 952 | 191.1 |
| C | 14 | 238 | 156532 | 692.85 | 953 | 957 | 224.5 |
| C | 2 | 114 | 18861 | 79.74 | 953 | 957 | 224.5 |
| C | 3 | 233 | 9137 | 36.43 | 953 | 957 | 224.5 |
| D | 13 | 104 | 173035 | 746.79 | 968 | 946 | 230.4 |
| D | 8 | 195 | 159692 | 688.89 | 968 | 946 | 230.4 |
| D | 7 | 223 | 146135 | 630.06 | 968 | 946 | 230.4 |
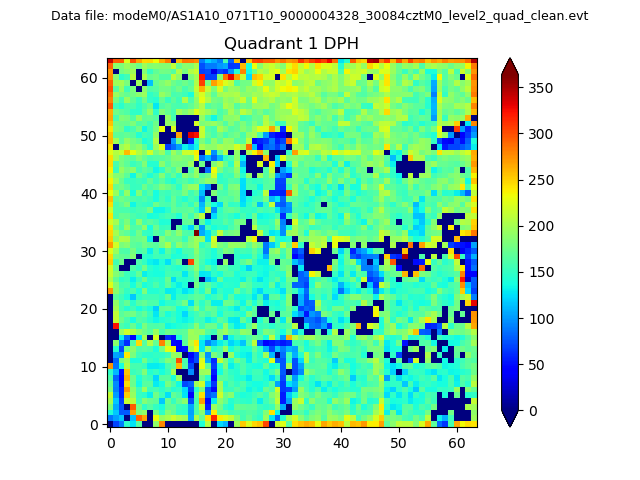
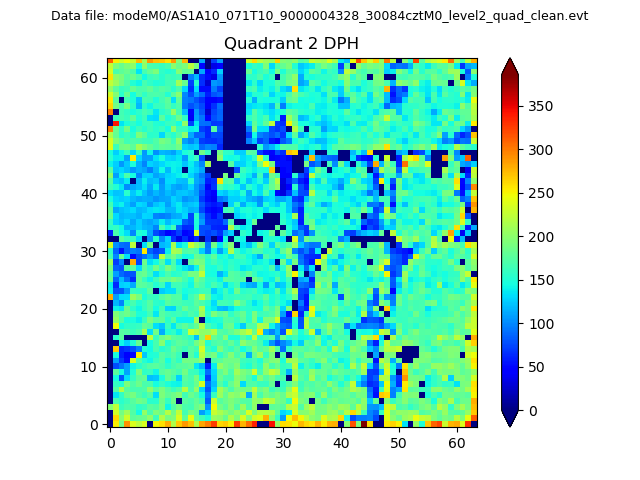
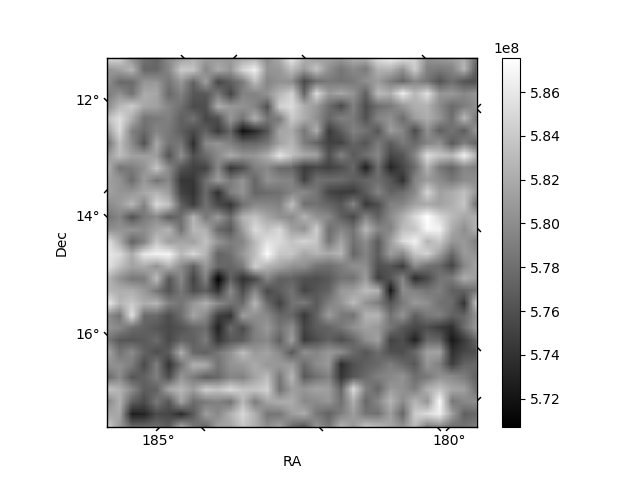
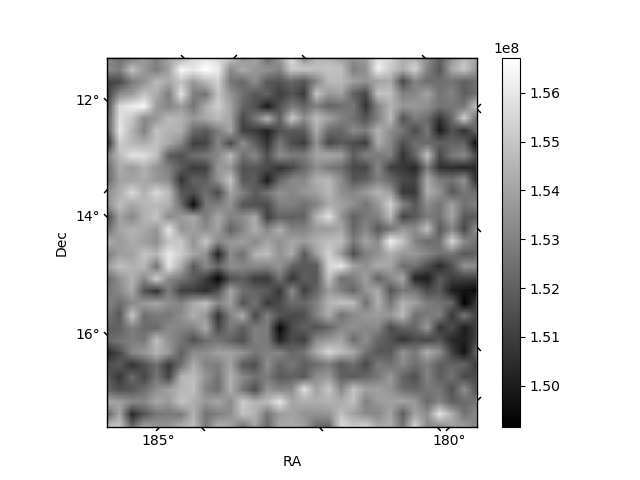
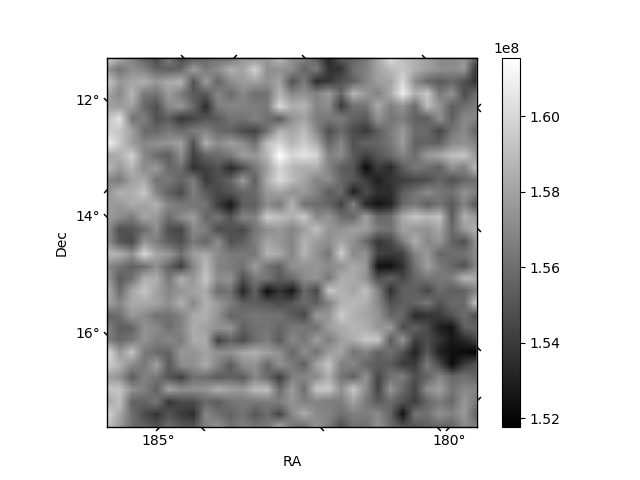
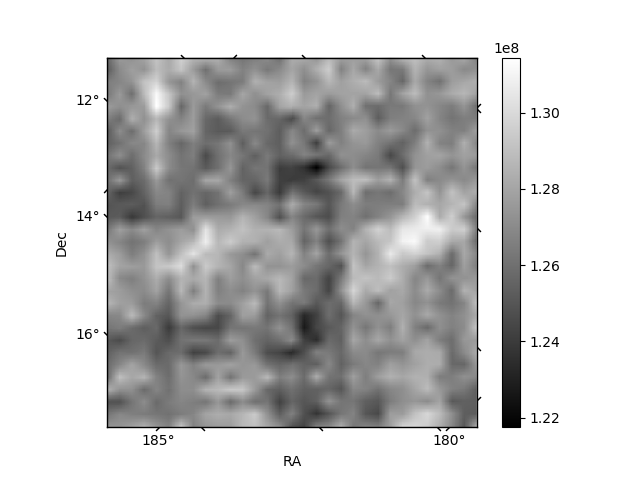
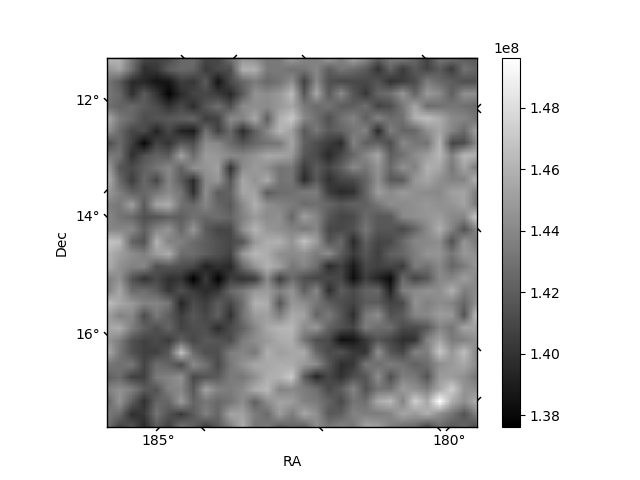
Histogram calculated using DETX and DETY for each event in the final _common_clean file
| Quadrant A | 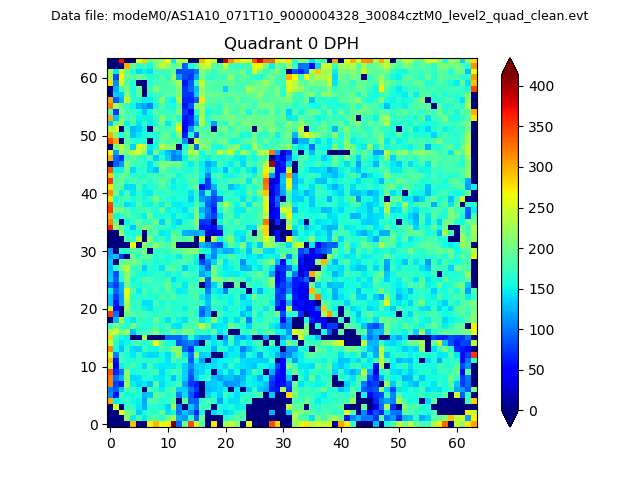 |
 |
Quadrant B |
|---|---|---|---|
| Quadrant D | 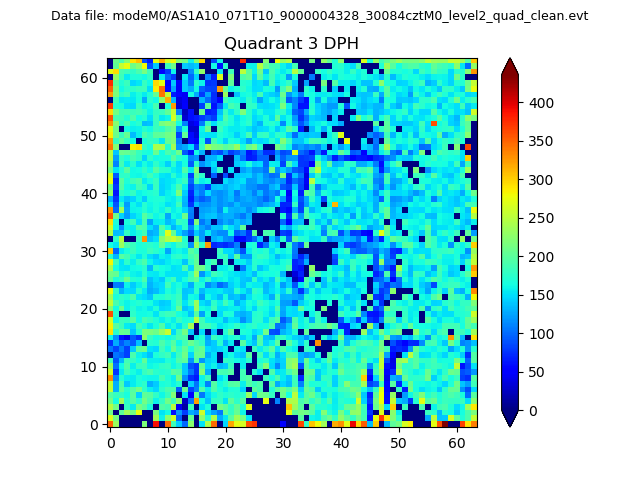 |
 |
Quadrant C |
| Plot type | Count rate plots | Images |
|---|---|---|
| Comparison with Poisson distribution Blue bars denote a histogram of data divided into 1 sec bins. Red curve is a Poisson curve with rate = median count rate of data. |
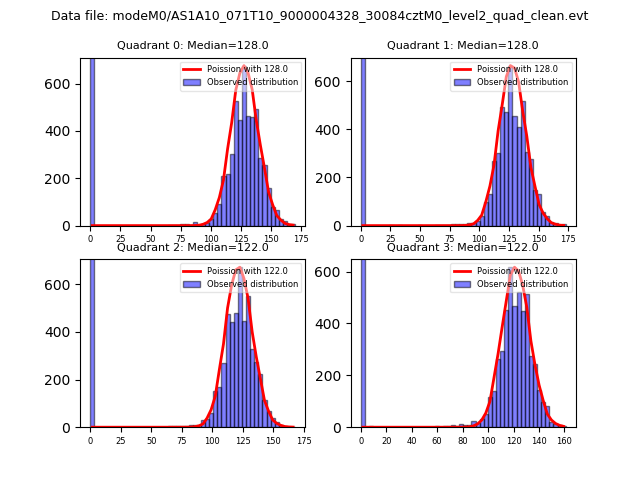 |
 |
| Quadrant-wise count rates Data is divided into 100 sec bins |
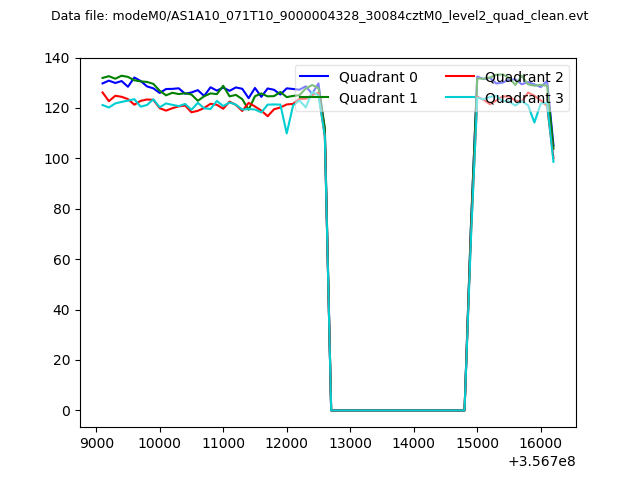 |
|
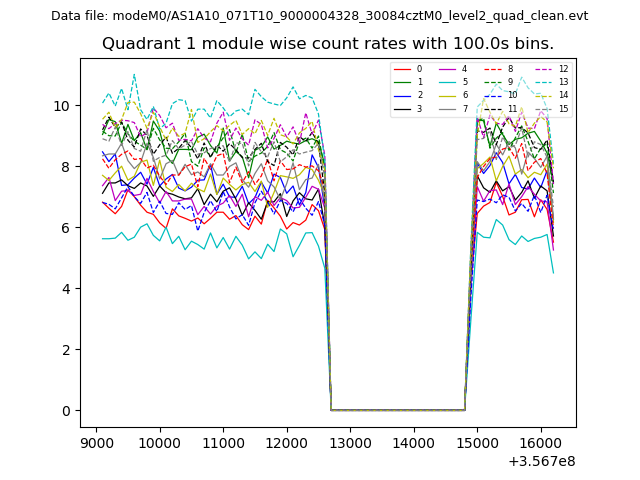
| Module-wise count rates for Quadrant A Data is divided into 100 sec bins |
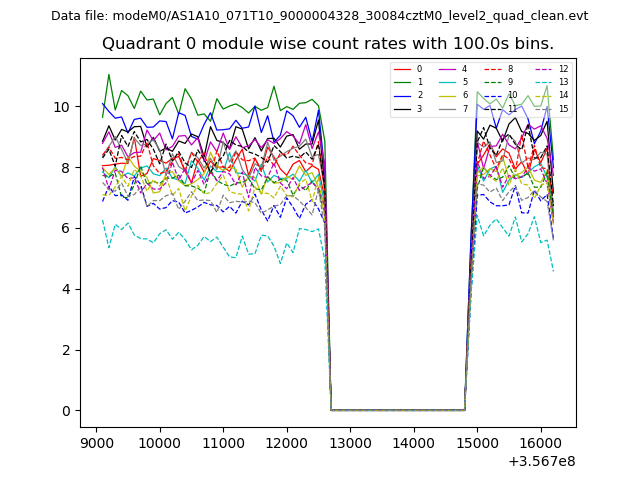 |
 |
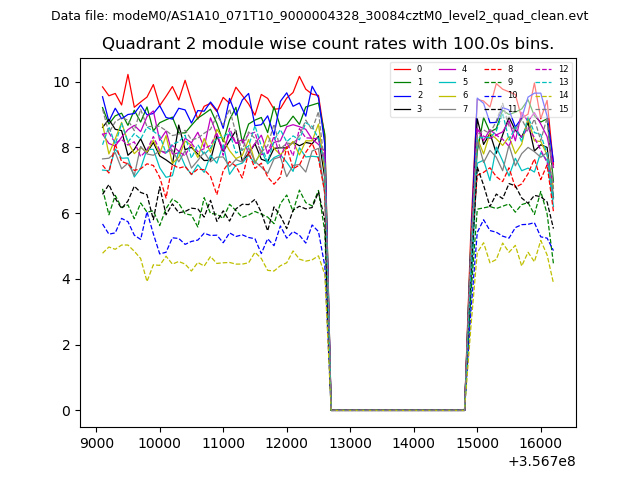
| Module-wise count rates for Quadrant B Data is divided into 100 sec bins |
 |
 |
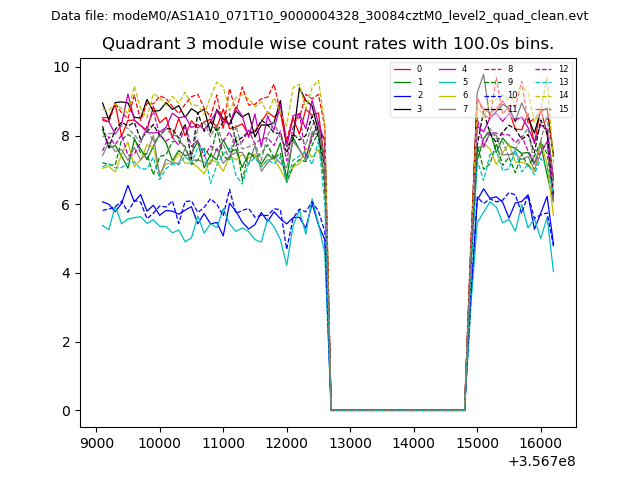
| Module-wise count rates for Quadrant C Data is divided into 100 sec bins |
 |
 |
| Module-wise count rates for Quadrant D Data is divided into 100 sec bins |
 |
 |
| Parameter | Plot |
|---|---|
| CZT HV Monitor | 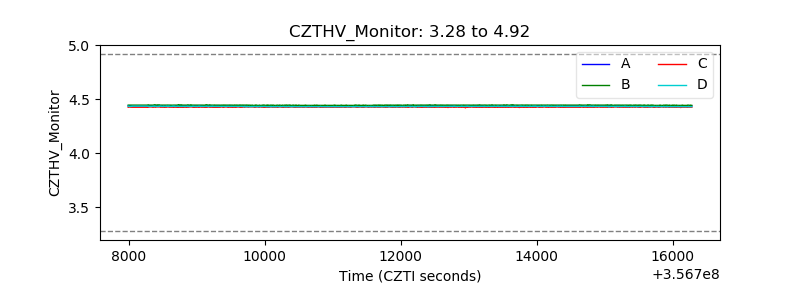 |
| D_VDD | 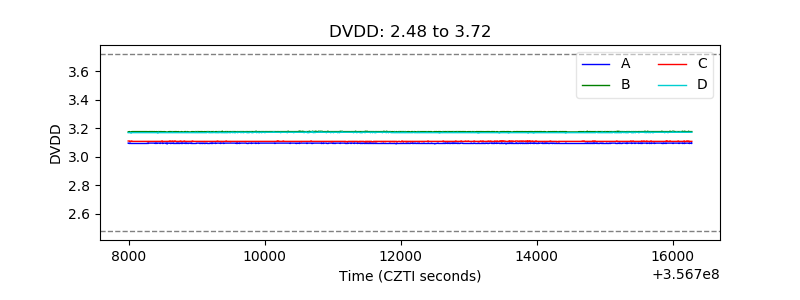 |
| Temperature 1 | 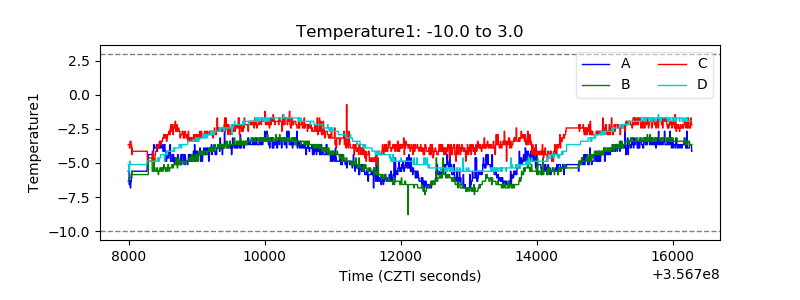 |
| Veto HV Monitor | 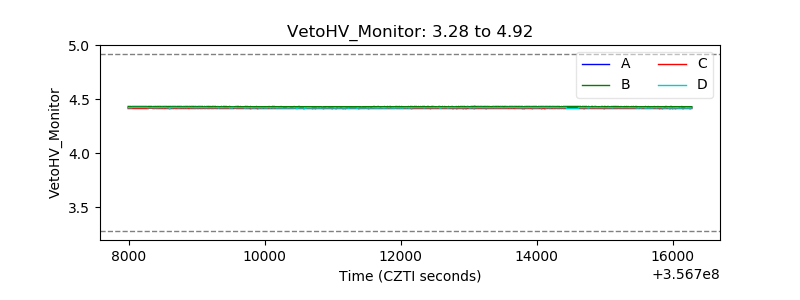 |
| Veto LLD | 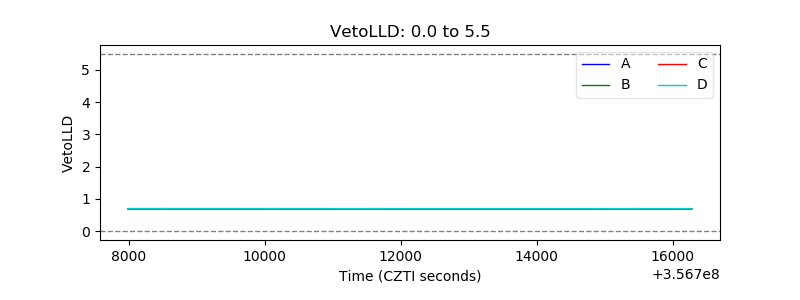 |
| Alpha Counter | 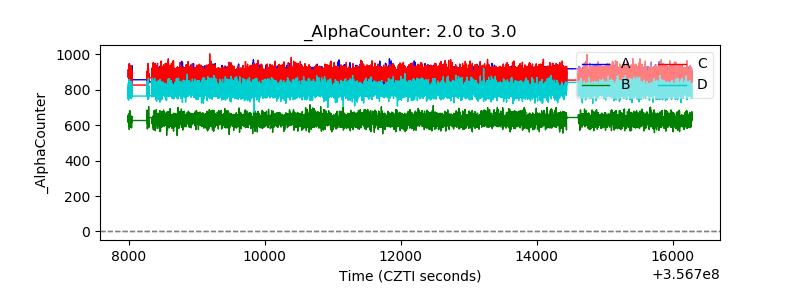 |
| _CPM_Rate | 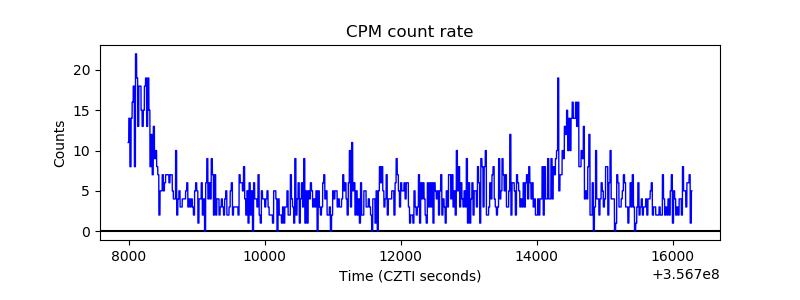 |
| CZT Counter | 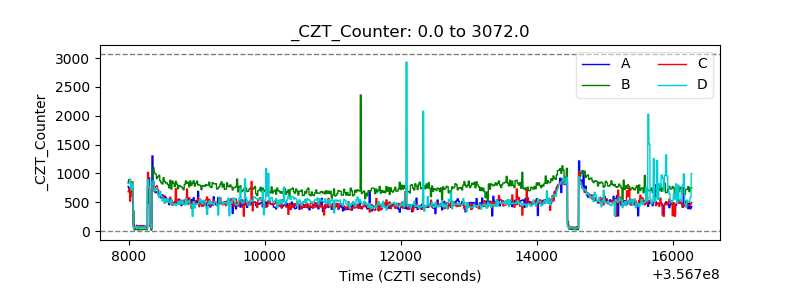 |
| +2.5 Volts monitor |  |
| +5 Volts monitor |  |
| _ROLL_ROT |  |
| _Roll_DEC | 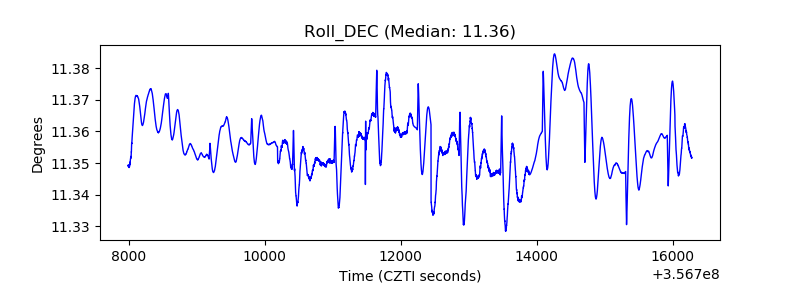 |
| _Roll_RA | 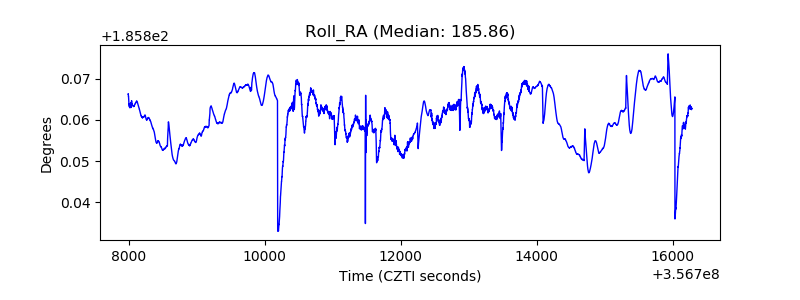 |
| Veto Counter | 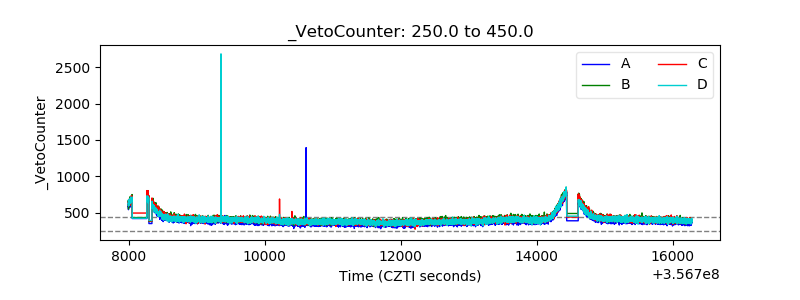 |