| Param | Original file | Final file |
|---|---|---|
| Filename | modeM0/AS1A10_071T10_9000004328_30087cztM0_level2.evt | modeM0/AS1A10_071T10_9000004328_30087cztM0_level2_quad_clean.evt |
| Size (bytes) | 140,912,640 | 27,184,320 |
| Size | 134.4 MB | 25.9 MB |
| Events in quadrant A | 700,077 | 189,874 |
| Events in quadrant B | 1,076,573 | 189,739 |
| Events in quadrant C | 740,436 | 181,236 |
| Events in quadrant D | 1,648,369 | 153,033 |
| Mode M0 | |||
|---|---|---|---|
| Quadrant | BADHDUFLAG | Total packets | Discarded packets |
| A | 0 | 2959 | 0 |
| B | 0 | 4460 | 0 |
| C | 0 | 3000 | 0 |
| D | 0 | 5835 | 0 |
| Mode SS | |||
|---|---|---|---|
| Quadrant | BADHDUFLAG | Total packets | Discarded packets |
| A | 0 | 28 | 0 |
| B | 0 | 28 | 0 |
| C | 0 | 28 | 0 |
| D | 0 | 28 | 0 |
| Quadrant | Total seconds | Saturated seconds | Saturation percentage |
|---|---|---|---|
| A | 1467 | 2 | 0.136333% |
| B | 1468 | 15 | 1.021798% |
| C | 1468 | 10 | 0.681199% |
| D | 1468 | 400 | 27.247956% |
Noise dominated data is calculated using 1-second bins in cleaned event files. If a bin has >2000 counts, and if more than 50% of those come from <1% of pixels, then it is considered to be noise-dominated and hence unusable.
| Quadrant | # 1 sec bins | Bins with >0 counts | Bins with >2000 counts | High rate bins dominated by noise | Noise dominated (total time) | Noise dominated (detector-on time) | Marked lightcurve |
|---|---|---|---|---|---|---|---|
| A | 1467 | 1467 | 0 | 0 | 0.00% | 0.00% | 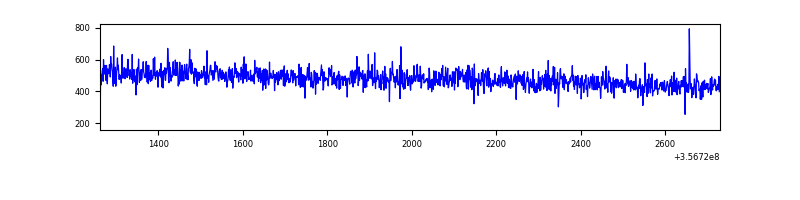 |
| B | 1468 | 1468 | 7 | 7 | 0.48% | 0.48% | 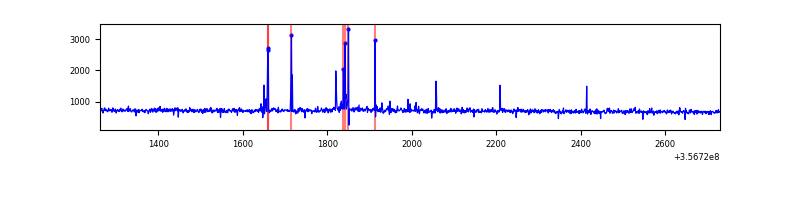 |
| C | 1468 | 1468 | 0 | 0 | 0.00% | 0.00% | 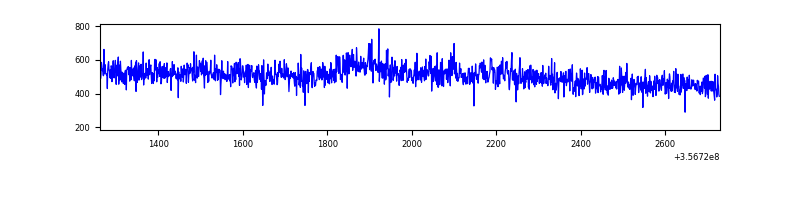 |
| D | 1468 | 1468 | 276 | 276 | 18.80% | 18.80% | 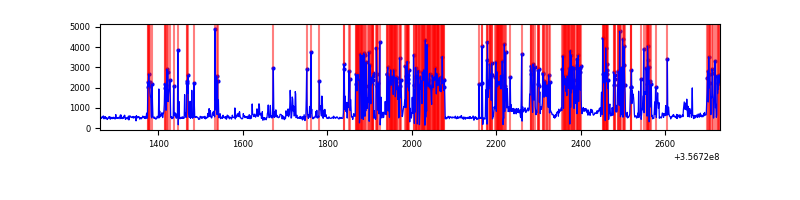 |
Top three noisy pixels from each quadrant. If the there are fewer than three noisy pixels in the level2.evt file, extra rows are filled as -1
| Pixel properties | Quadrant properties | ||||||
|---|---|---|---|---|---|---|---|
| Quadrant | DetID | PixID | Counts | Sigma | Mean | Median | Sigma |
| A | 13 | 254 | 2780 | 66.65 | 181 | 176 | 39.1 |
| A | 3 | 137 | 1873 | 43.44 | 181 | 176 | 39.1 |
| A | 0 | 226 | 1540 | 34.91 | 181 | 176 | 39.1 |
| B | 6 | 159 | 342577 | 9453.63 | 176 | 171 | 36.2 |
| B | 4 | 171 | 38266 | 1051.78 | 176 | 171 | 36.2 |
| B | 12 | 111 | 4190 | 110.96 | 176 | 171 | 36.2 |
| C | 3 | 233 | 29152 | 676.83 | 174 | 175 | 42.8 |
| C | 14 | 238 | 28004 | 650.01 | 174 | 175 | 42.8 |
| C | 2 | 114 | 3486 | 77.34 | 174 | 175 | 42.8 |
| D | 13 | 104 | 982754 | 23385.09 | 154 | 151 | 42.0 |
| D | 2 | 250 | 28056 | 664.11 | 154 | 151 | 42.0 |
| D | 8 | 195 | 26972 | 638.32 | 154 | 151 | 42.0 |
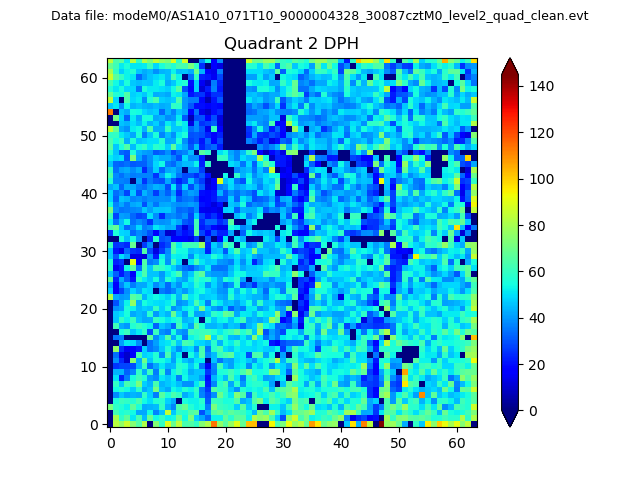
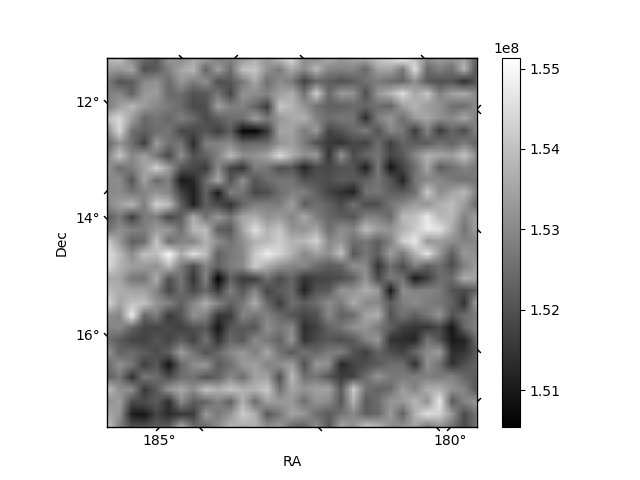
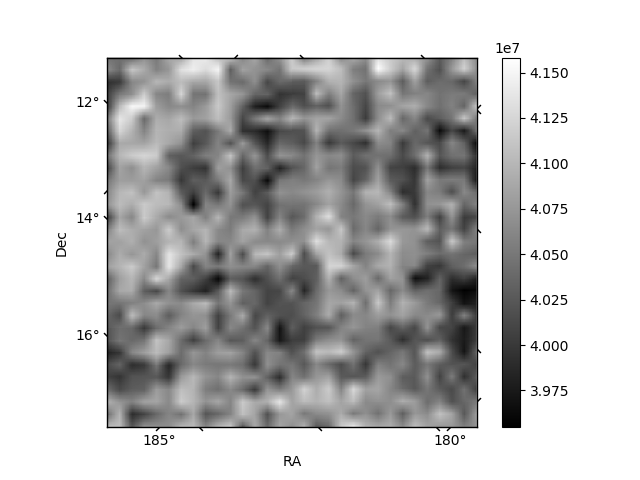
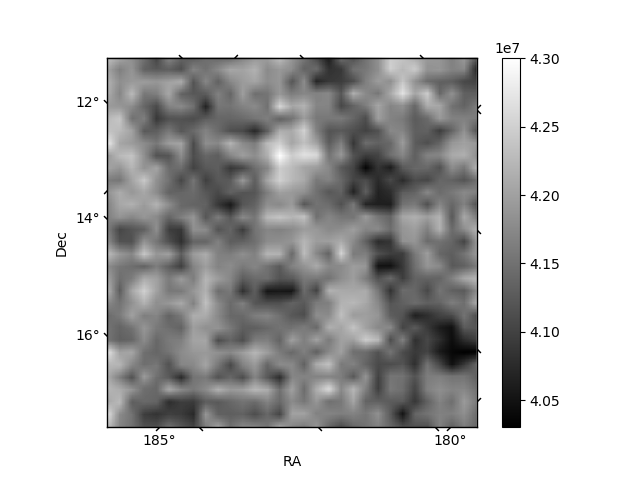
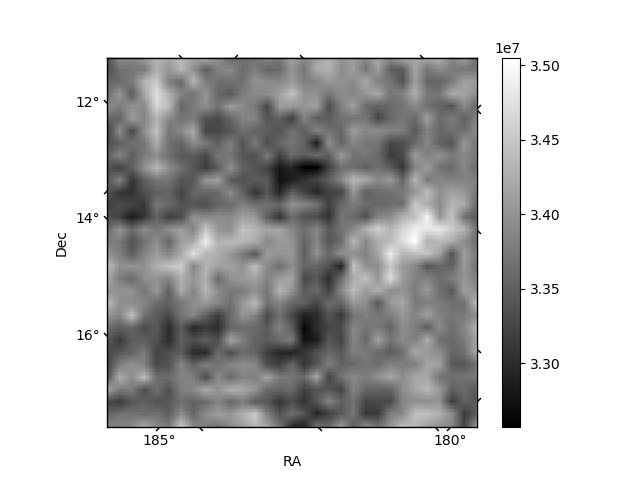
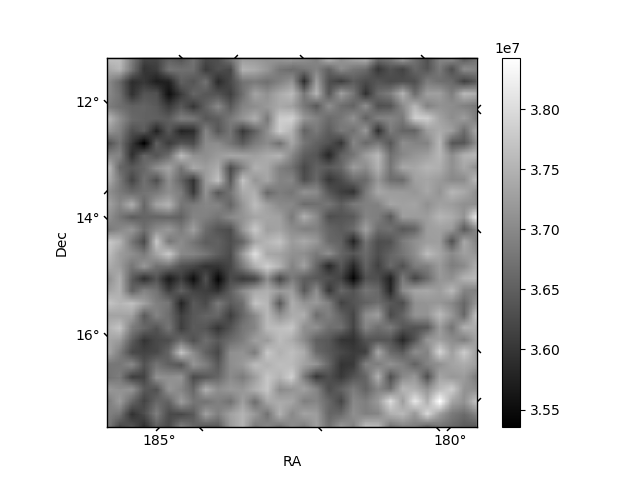
Histogram calculated using DETX and DETY for each event in the final _common_clean file
| Quadrant A | 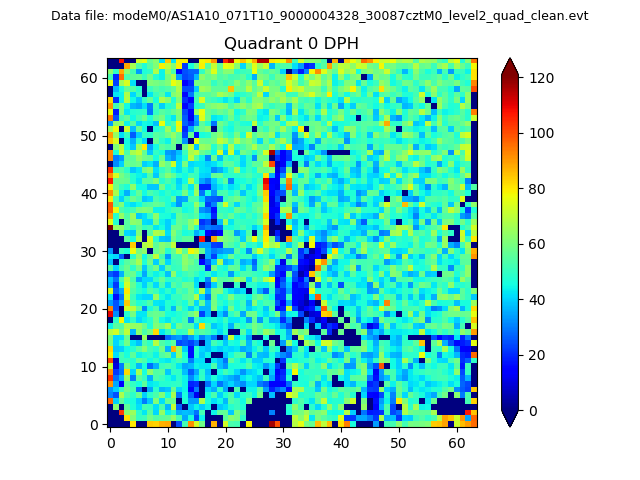 |
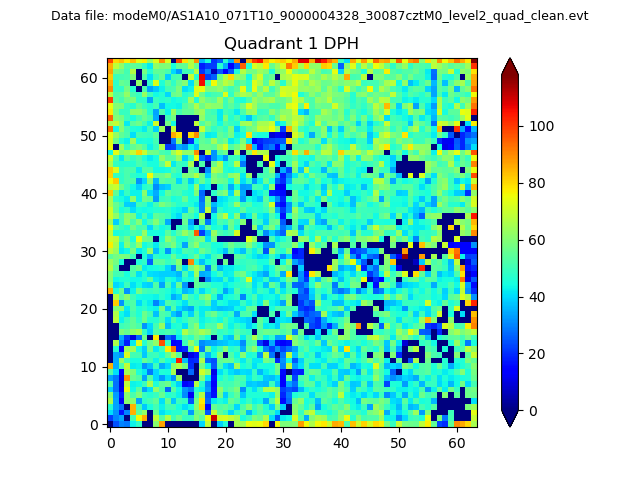 |
Quadrant B |
|---|---|---|---|
| Quadrant D | 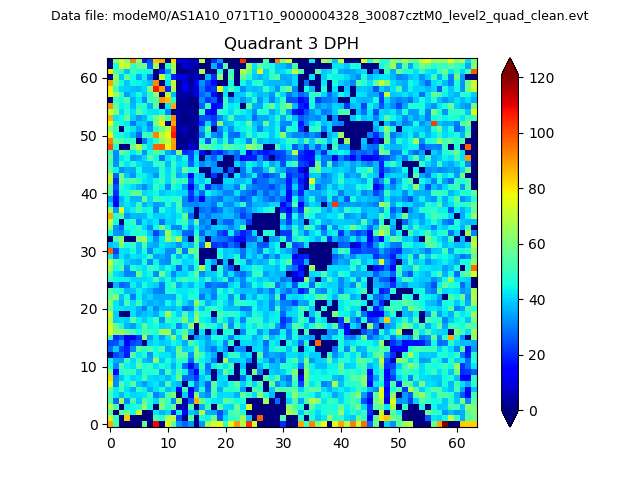 |
 |
Quadrant C |
| Plot type | Count rate plots | Images |
|---|---|---|
| Comparison with Poisson distribution Blue bars denote a histogram of data divided into 1 sec bins. Red curve is a Poisson curve with rate = median count rate of data. |
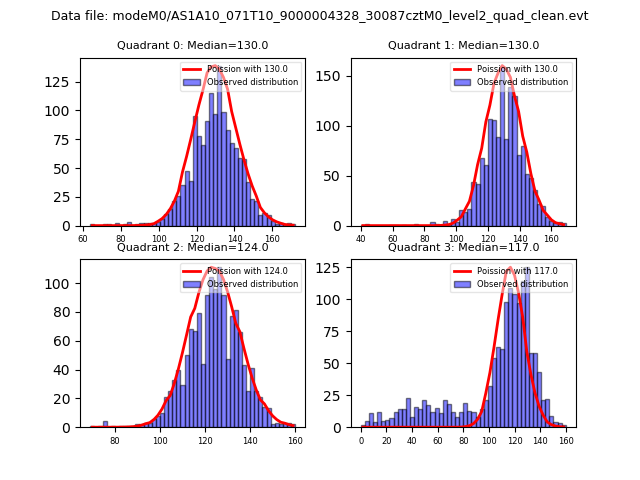 |
 |
| Quadrant-wise count rates Data is divided into 100 sec bins |
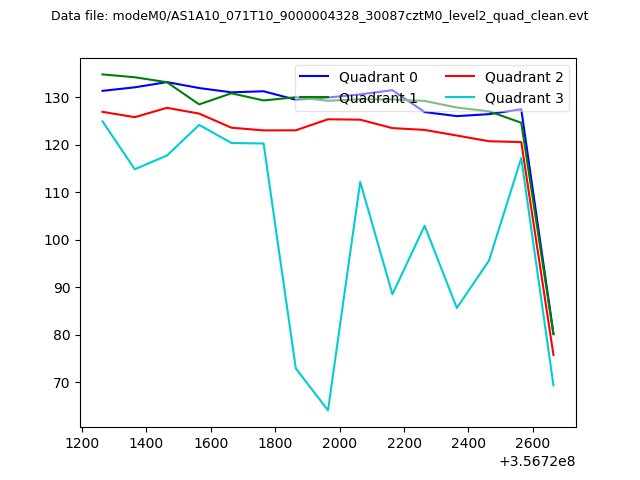 |
|
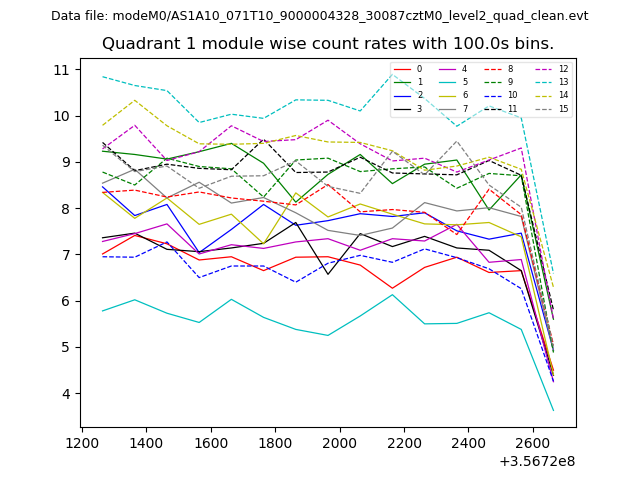
| Module-wise count rates for Quadrant A Data is divided into 100 sec bins |
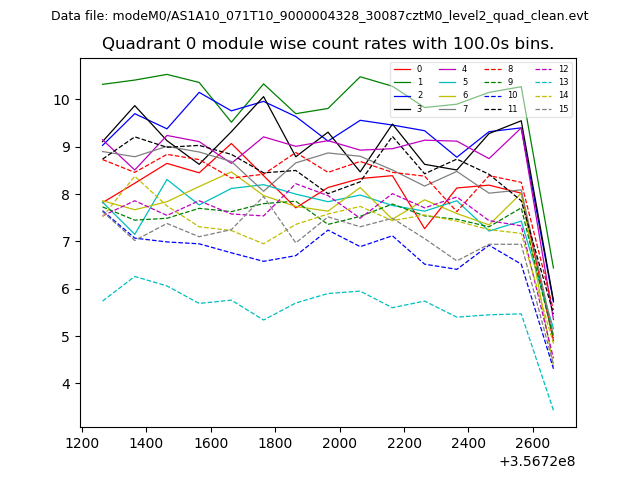 |
 |
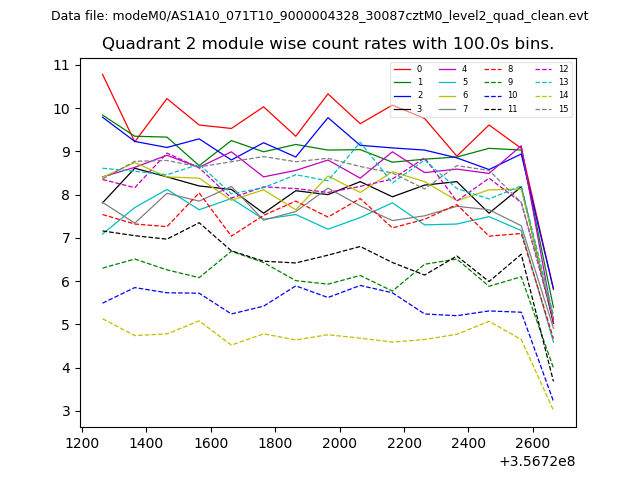
| Module-wise count rates for Quadrant B Data is divided into 100 sec bins |
 |
 |
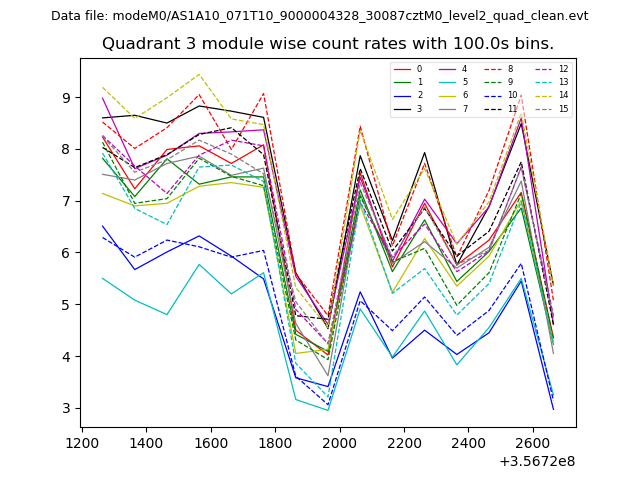
| Module-wise count rates for Quadrant C Data is divided into 100 sec bins |
 |
 |
| Module-wise count rates for Quadrant D Data is divided into 100 sec bins |
 |
 |
| Parameter | Plot |
|---|---|
| CZT HV Monitor | 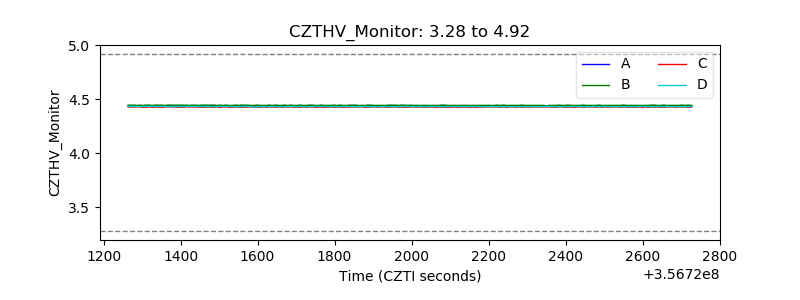 |
| D_VDD | 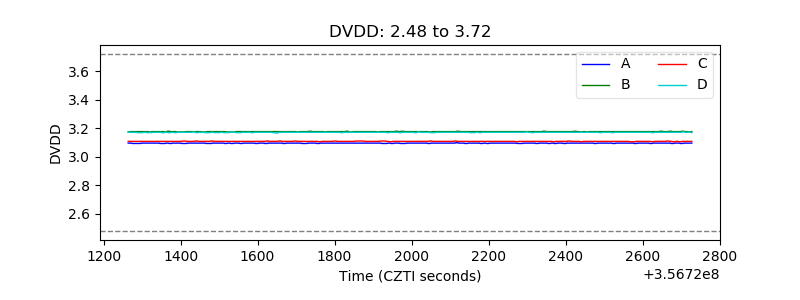 |
| Temperature 1 |  |
| Veto HV Monitor | 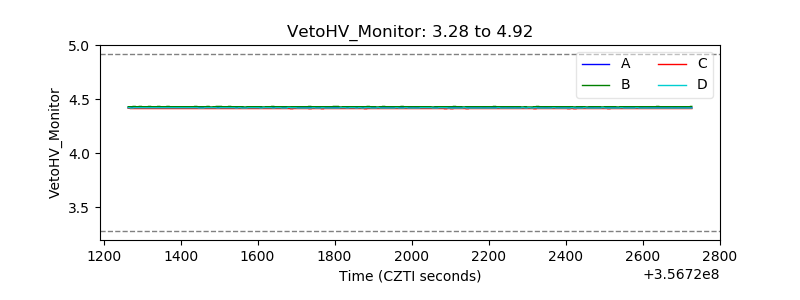 |
| Veto LLD |  |
| Alpha Counter | 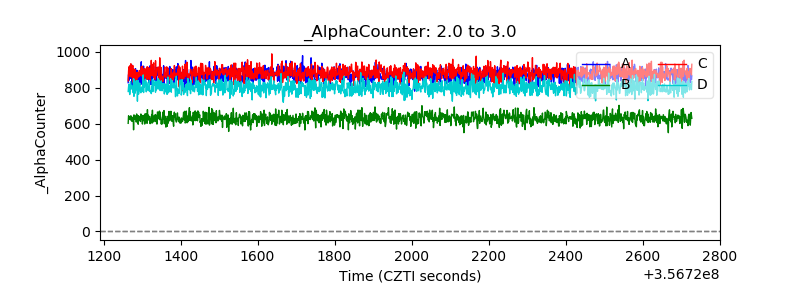 |
| _CPM_Rate | 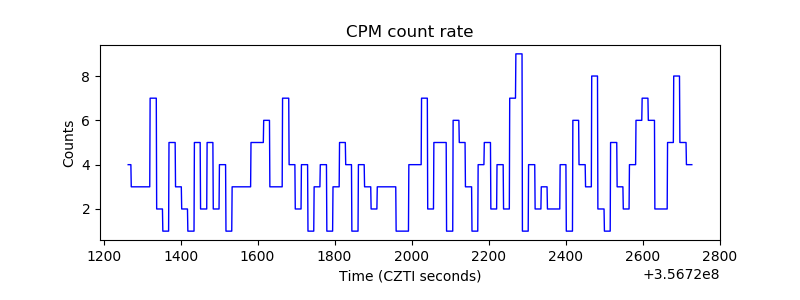 |
| CZT Counter | 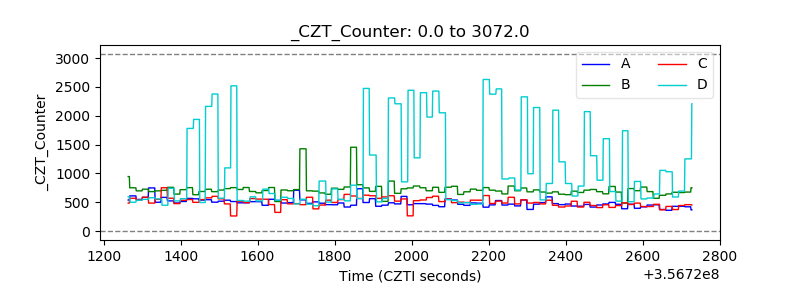 |
| +2.5 Volts monitor |  |
| +5 Volts monitor |  |
| _ROLL_ROT | 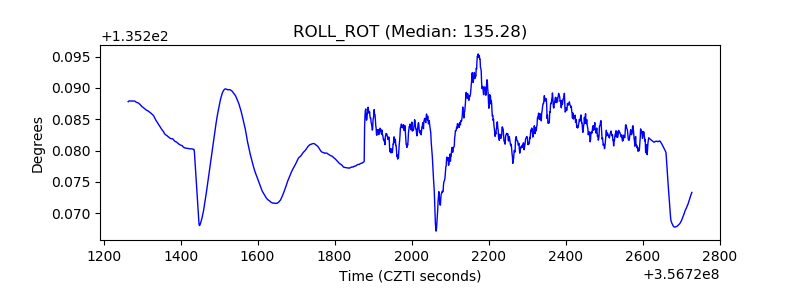 |
| _Roll_DEC | 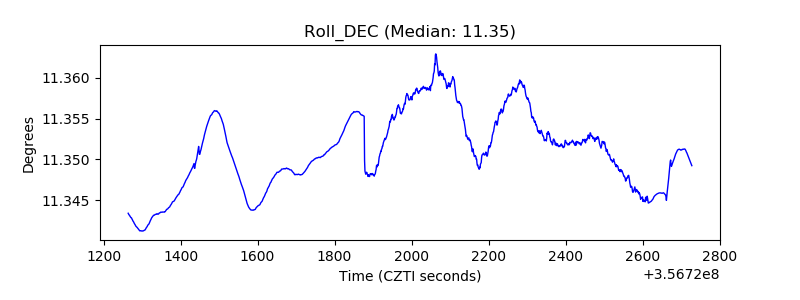 |
| _Roll_RA | 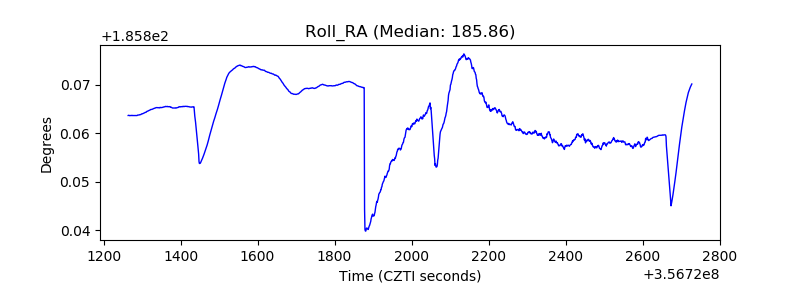 |
| Veto Counter | 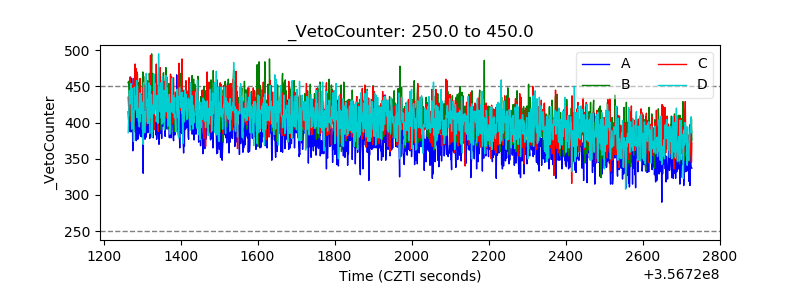 |