| Param | Original file | Final file |
|---|---|---|
| Filename | modeM0/AS1C05_019T01_9000004332cztM0_level2.fits | modeM0/AS1C05_019T01_9000004332cztM0_level2_quad_clean.evt |
| Size (bytes) | 821,534,400 | 1,074,032,640 |
| Size | 783.5 MB | 1.0 GB |
| Events in quadrant A | 5,101,868 | 7,042,478 |
| Events in quadrant B | 4,783,716 | 6,947,978 |
| Events in quadrant C | 4,862,106 | 6,592,653 |
| Events in quadrant D | 4,277,150 | 6,093,217 |
| Mode M9 | |||
|---|---|---|---|
| Quadrant | BADHDUFLAG | Total packets | Discarded packets |
| A | 0 | 123 | 0 |
| B | 0 | 123 | 0 |
| C | 0 | 123 | 0 |
| D | 0 | 123 | 0 |
| Mode M0 | |||
|---|---|---|---|
| Quadrant | BADHDUFLAG | Total packets | Discarded packets |
| A | 0 | 176640 | 0 |
| B | 0 | 259382 | 0 |
| C | 0 | 180001 | 0 |
| D | 0 | 213010 | 0 |
| Mode SS | |||
|---|---|---|---|
| Quadrant | BADHDUFLAG | Total packets | Discarded packets |
| A | 0 | 1738 | 0 |
| B | 0 | 1738 | 0 |
| C | 0 | 1738 | 0 |
| D | 0 | 1738 | 0 |
| Quadrant | Total seconds | Saturated seconds | Saturation percentage |
|---|---|---|---|
| A | 85400 | 888 | 1.039813% |
| B | 85400 | 1893 | 2.216628% |
| C | 85400 | 2323 | 2.720141% |
| D | 85400 | 2552 | 2.988290% |
Noise dominated data is calculated using 1-second bins in cleaned event files. If a bin has >2000 counts, and if more than 50% of those come from <1% of pixels, then it is considered to be noise-dominated and hence unusable.
| Quadrant | # 1 sec bins | Bins with >0 counts | Bins with >2000 counts | High rate bins dominated by noise | Noise dominated (total time) | Noise dominated (detector-on time) | Marked lightcurve |
|---|---|---|---|---|---|---|---|
| A | 97510 | 85399 | 0 | 0 | 0.00% | 0.00% | 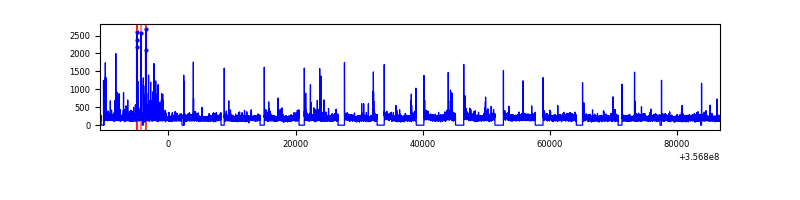 |
| B | 97510 | 85398 | 0 | 0 | 0.00% | 0.00% |  |
| C | 97510 | 85396 | 0 | 0 | 0.00% | 0.00% | 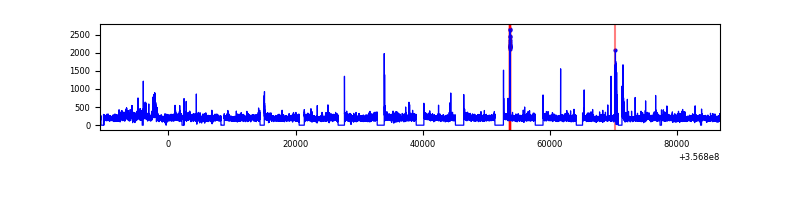 |
| D | 97510 | 85378 | 0 | 0 | 0.00% | 0.00% |  |
Top three noisy pixels from each quadrant. If the there are fewer than three noisy pixels in the level2.evt file, extra rows are filled as -1
| Pixel properties | Quadrant properties | ||||||
|---|---|---|---|---|---|---|---|
| Quadrant | DetID | PixID | Counts | Sigma | Mean | Median | Sigma |
| A | 0 | 29 | 4270 | 9.3 | 1329 | 1253 | 324.4 |
| A | 7 | 110 | 4049 | 8.62 | 1329 | 1253 | 324.4 |
| A | 9 | 19 | 3765 | 7.74 | 1329 | 1253 | 324.4 |
| B | 2 | 9 | 3897 | 10.91 | 1266 | 1213 | 246.1 |
| B | 2 | 8 | 3240 | 8.24 | 1266 | 1213 | 246.1 |
| B | 5 | 255 | 3176 | 7.98 | 1266 | 1213 | 246.1 |
| C | 1 | 81 | 3760 | 7.97 | 1284 | 1209 | 320.2 |
| C | 1 | 80 | 3742 | 7.91 | 1284 | 1209 | 320.2 |
| C | 12 | 241 | 3505 | 7.17 | 1284 | 1209 | 320.2 |
| D | 15 | 46 | 3265 | 6.57 | 1220 | 1107 | 328.6 |
| D | 3 | 14 | 3143 | 6.2 | 1220 | 1107 | 328.6 |
| D | 6 | 67 | 3092 | 6.04 | 1220 | 1107 | 328.6 |
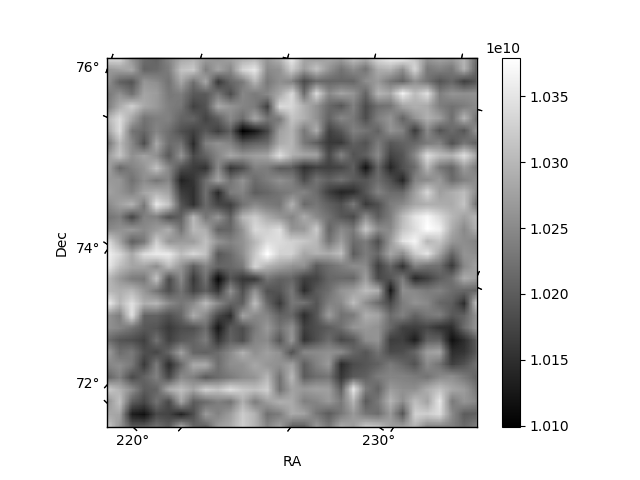
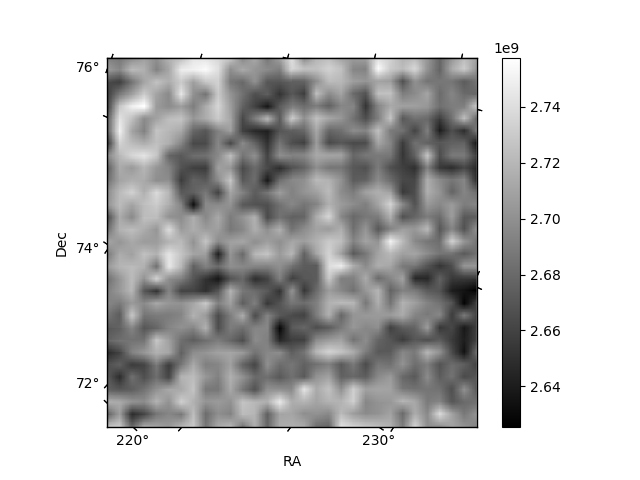
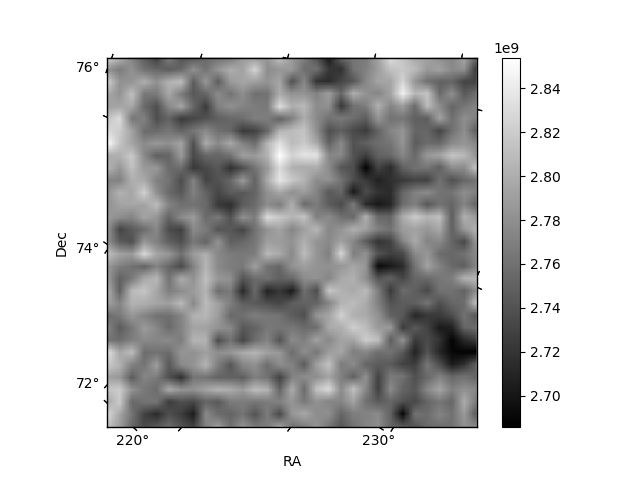
Histogram calculated using DETX and DETY for each event in the final _common_clean file
| Quadrant A | 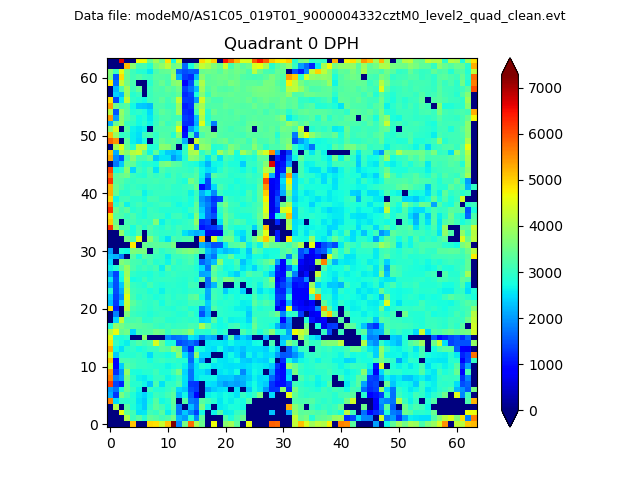 |
 |
Quadrant B |
|---|---|---|---|
| Quadrant D |  |
 |
Quadrant C |
| Plot type | Count rate plots | Images |
|---|---|---|
| Comparison with Poisson distribution Blue bars denote a histogram of data divided into 1 sec bins. Red curve is a Poisson curve with rate = median count rate of data. |
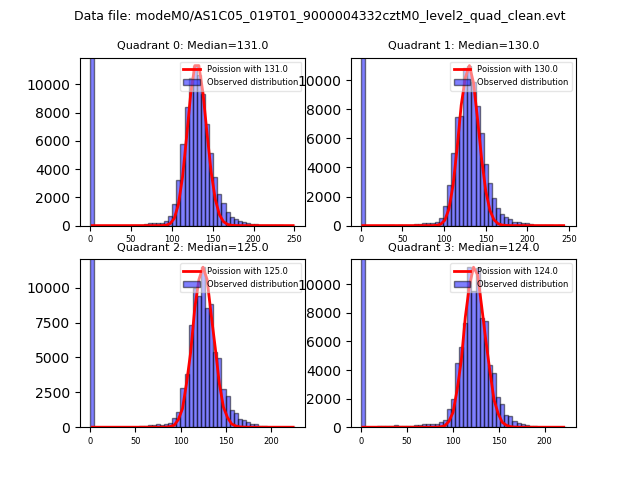 |
 |
| Quadrant-wise count rates Data is divided into 100 sec bins |
 |
|
| Module-wise count rates for Quadrant A Data is divided into 100 sec bins |
 |
 |
| Module-wise count rates for Quadrant B Data is divided into 100 sec bins |
 |
 |
| Module-wise count rates for Quadrant C Data is divided into 100 sec bins |
 |
 |
| Module-wise count rates for Quadrant D Data is divided into 100 sec bins |
 |
 |
| Parameter | Plot |
|---|---|
| CZT HV Monitor |  |
| D_VDD | 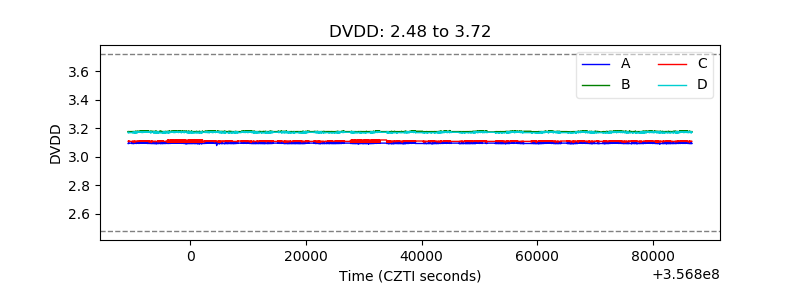 |
| Temperature 1 |  |
| Veto HV Monitor |  |
| Veto LLD | 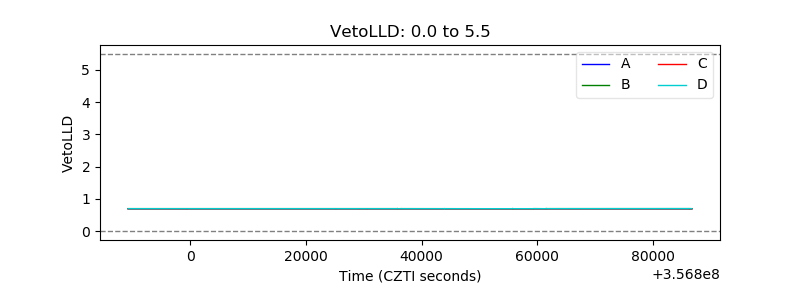 |
| Alpha Counter |  |
| _CPM_Rate | 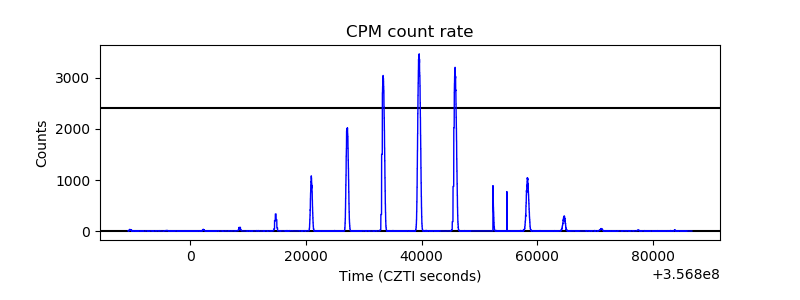 |
| CZT Counter |  |
| +2.5 Volts monitor | 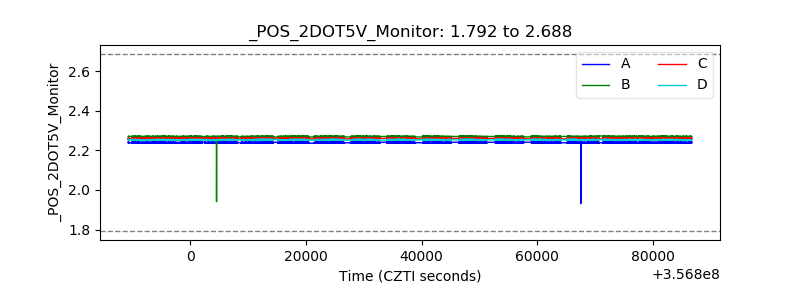 |
| +5 Volts monitor | 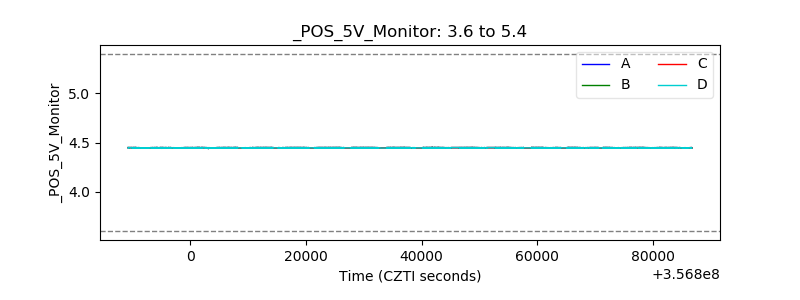 |
| _ROLL_ROT |  |
| _Roll_DEC | 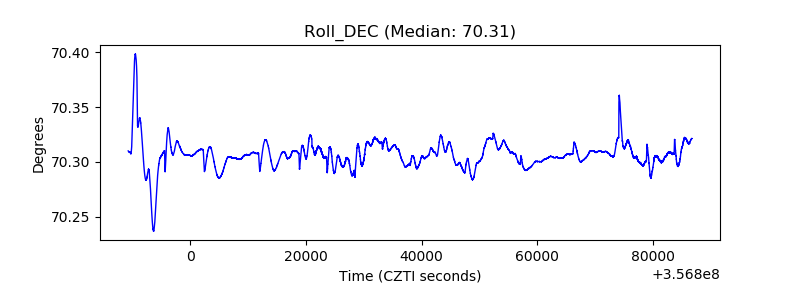 |
| _Roll_RA | 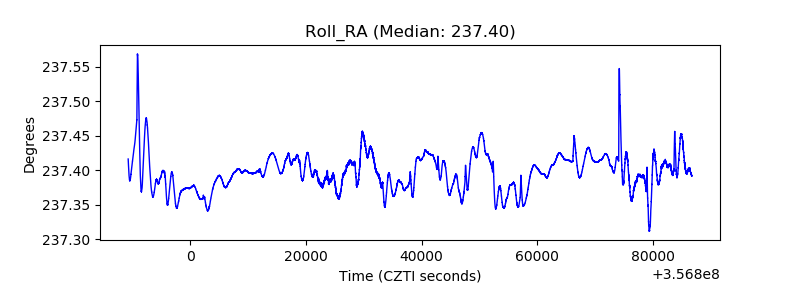 |
| Veto Counter | 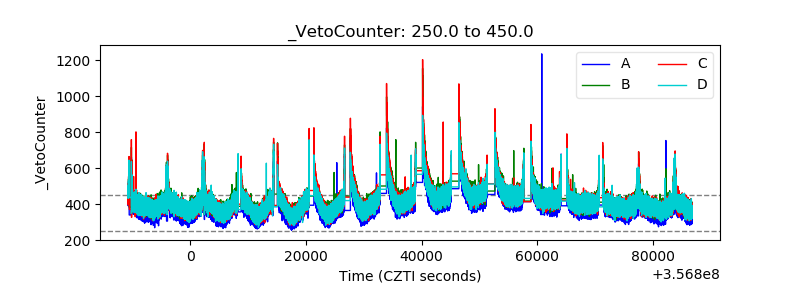 |