| Param | Original file | Final file |
|---|---|---|
| Filename | modeM0/AS1C05_019T01_9000004332_30099cztM0_level2.evt | modeM0/AS1C05_019T01_9000004332_30099cztM0_level2_quad_clean.evt |
| Size (bytes) | 535,800,960 | 127,679,040 |
| Size | 511.0 MB | 121.8 MB |
| Events in quadrant A | 3,272,451 | 868,167 |
| Events in quadrant B | 5,243,573 | 864,007 |
| Events in quadrant C | 3,536,289 | 826,734 |
| Events in quadrant D | 3,709,216 | 829,943 |
| Mode M9 | |||
|---|---|---|---|
| Quadrant | BADHDUFLAG | Total packets | Discarded packets |
| A | 0 | 4 | 0 |
| B | 0 | 4 | 0 |
| C | 0 | 4 | 0 |
| D | 0 | 4 | 0 |
| Mode M0 | |||
|---|---|---|---|
| Quadrant | BADHDUFLAG | Total packets | Discarded packets |
| A | 0 | 14245 | 1 |
| B | 0 | 20757 | 1 |
| C | 0 | 14814 | 1 |
| D | 0 | 15414 | 1 |
| Mode SS | |||
|---|---|---|---|
| Quadrant | BADHDUFLAG | Total packets | Discarded packets |
| A | 0 | 138 | 0 |
| B | 0 | 138 | 0 |
| C | 0 | 138 | 0 |
| D | 0 | 138 | 0 |
| Quadrant | Total seconds | Saturated seconds | Saturation percentage |
|---|---|---|---|
| A | 6876 | 51 | 0.741710% |
| B | 6876 | 123 | 1.788831% |
| C | 6876 | 158 | 2.297848% |
| D | 6876 | 84 | 1.221640% |
Noise dominated data is calculated using 1-second bins in cleaned event files. If a bin has >2000 counts, and if more than 50% of those come from <1% of pixels, then it is considered to be noise-dominated and hence unusable.
| Quadrant | # 1 sec bins | Bins with >0 counts | Bins with >2000 counts | High rate bins dominated by noise | Noise dominated (total time) | Noise dominated (detector-on time) | Marked lightcurve |
|---|---|---|---|---|---|---|---|
| A | 7191 | 6878 | 2 | 2 | 0.03% | 0.03% | 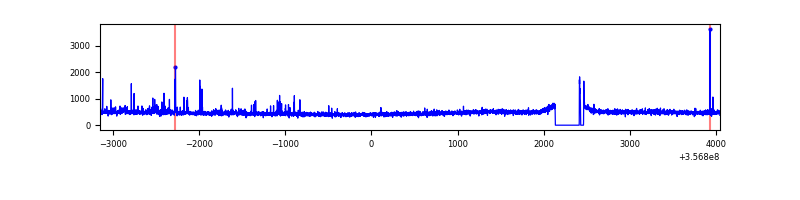 |
| B | 7191 | 6878 | 3 | 3 | 0.04% | 0.04% | 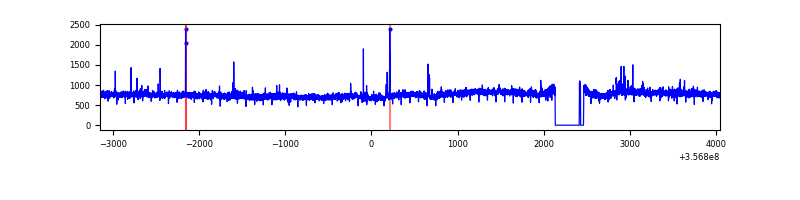 |
| C | 7191 | 6878 | 0 | 0 | 0.00% | 0.00% | 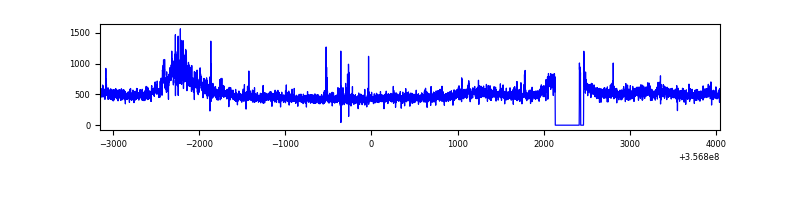 |
| D | 7191 | 6878 | 20 | 20 | 0.28% | 0.29% | 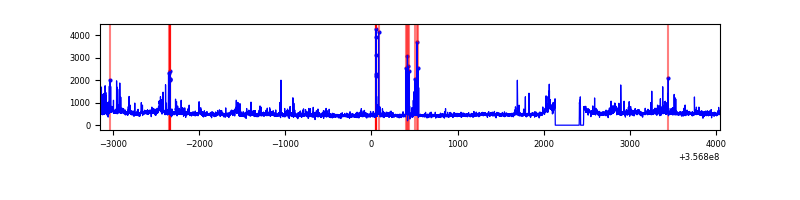 |
Top three noisy pixels from each quadrant. If the there are fewer than three noisy pixels in the level2.evt file, extra rows are filled as -1
| Pixel properties | Quadrant properties | ||||||
|---|---|---|---|---|---|---|---|
| Quadrant | DetID | PixID | Counts | Sigma | Mean | Median | Sigma |
| A | 0 | 13 | 113978 | 692.17 | 812 | 794 | 163.5 |
| A | 8 | 192 | 16702 | 97.28 | 812 | 794 | 163.5 |
| A | 13 | 254 | 13935 | 80.36 | 812 | 794 | 163.5 |
| B | 6 | 159 | 2030662 | 13179.38 | 801 | 780 | 154.0 |
| B | 4 | 171 | 41055 | 261.49 | 801 | 780 | 154.0 |
| B | 12 | 111 | 18748 | 116.66 | 801 | 780 | 154.0 |
| C | 3 | 233 | 320223 | 1776.39 | 774 | 779 | 179.8 |
| C | 14 | 238 | 141509 | 782.58 | 774 | 779 | 179.8 |
| C | 14 | 254 | 25334 | 136.55 | 774 | 779 | 179.8 |
| D | 1 | 52 | 263724 | 1370.63 | 784 | 763 | 191.9 |
| D | 13 | 104 | 181307 | 941.04 | 784 | 763 | 191.9 |
| D | 8 | 195 | 170595 | 885.21 | 784 | 763 | 191.9 |
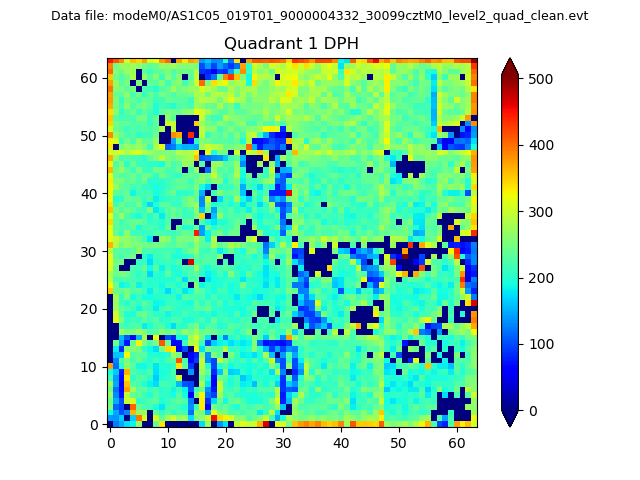
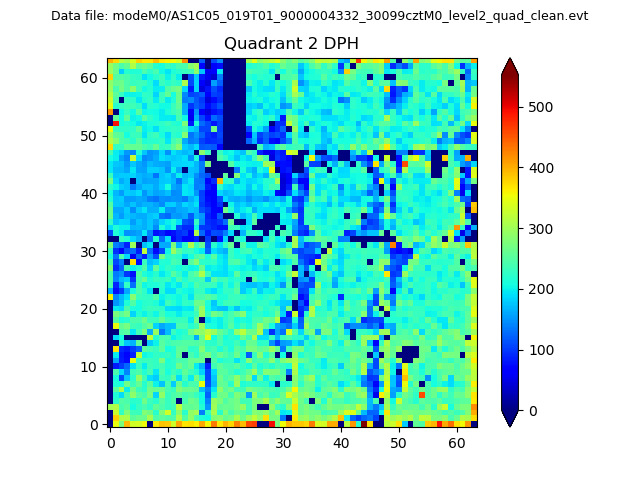
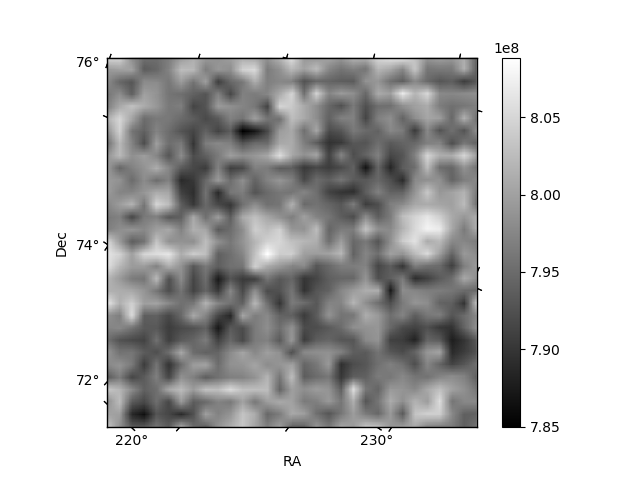
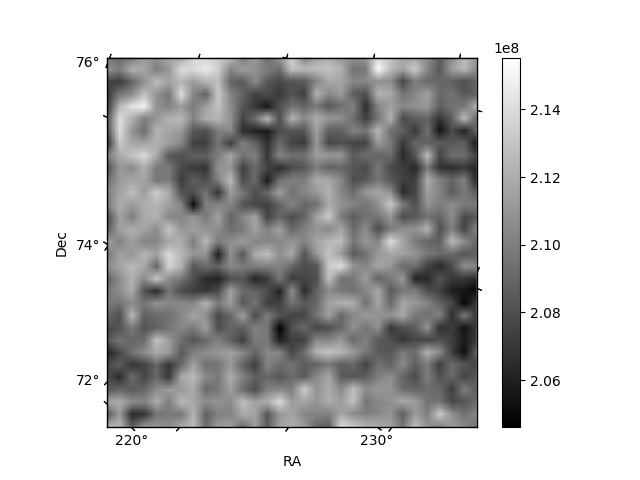
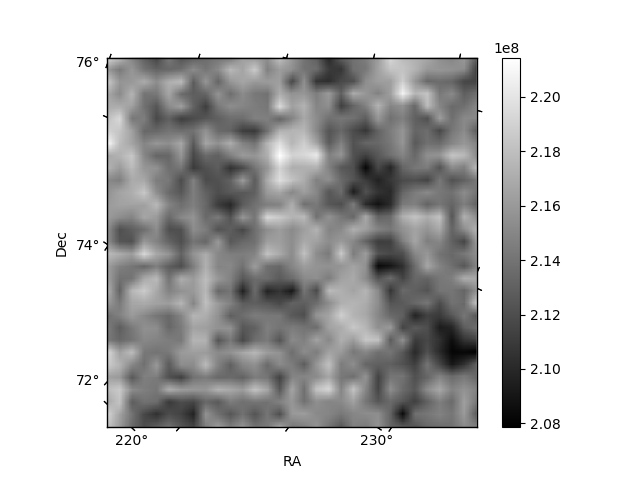
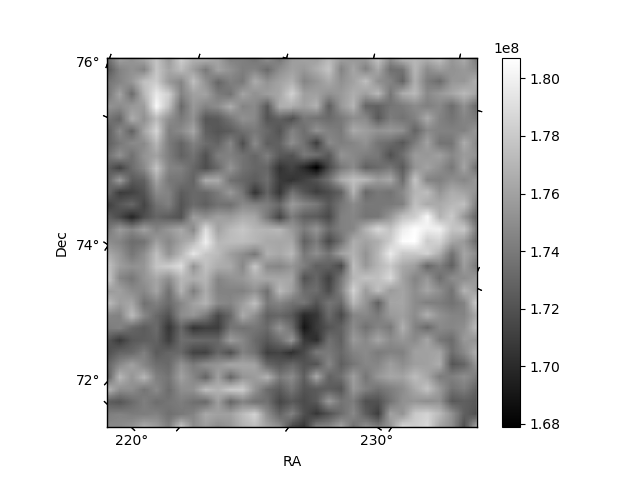
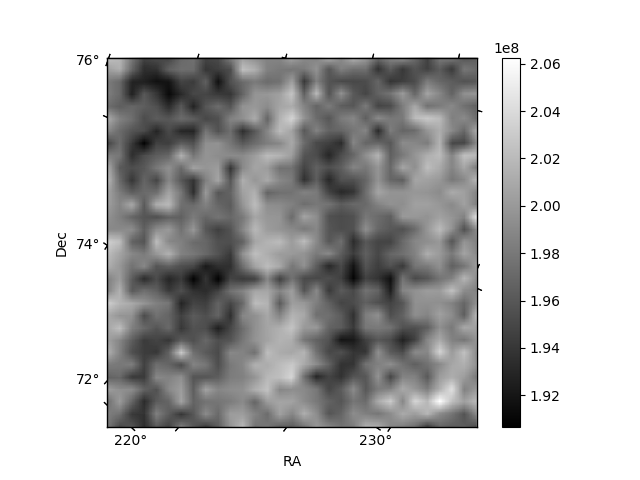
Histogram calculated using DETX and DETY for each event in the final _common_clean file
| Quadrant A |  |
 |
Quadrant B |
|---|---|---|---|
| Quadrant D | 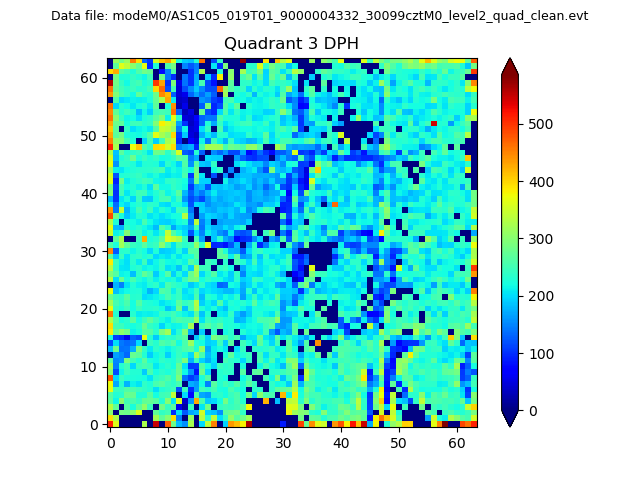 |
 |
Quadrant C |
| Plot type | Count rate plots | Images |
|---|---|---|
| Comparison with Poisson distribution Blue bars denote a histogram of data divided into 1 sec bins. Red curve is a Poisson curve with rate = median count rate of data. |
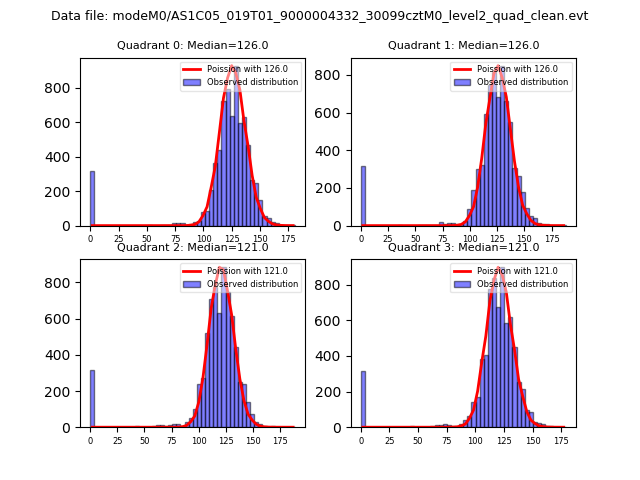 |
 |
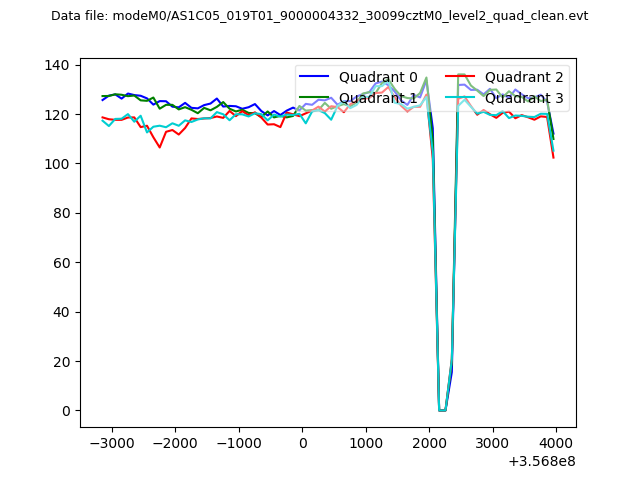
| Quadrant-wise count rates Data is divided into 100 sec bins |
 |
|
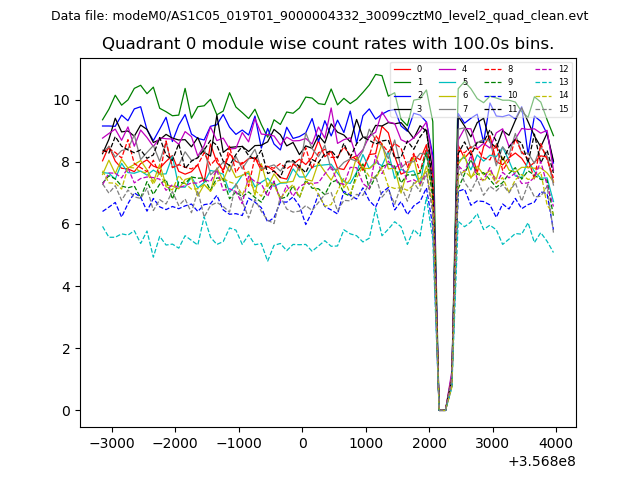
| Module-wise count rates for Quadrant A Data is divided into 100 sec bins |
 |
 |
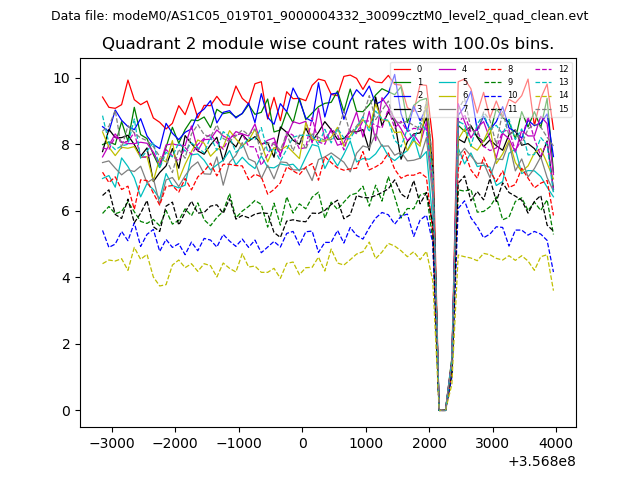
| Module-wise count rates for Quadrant B Data is divided into 100 sec bins |
 |
 |
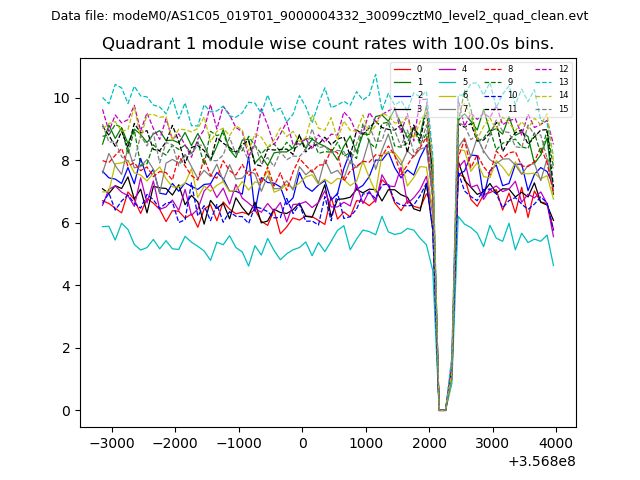
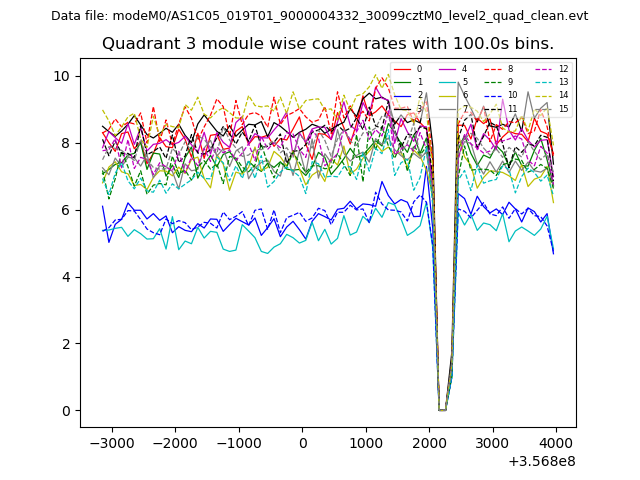
| Module-wise count rates for Quadrant C Data is divided into 100 sec bins |
 |
 |
| Module-wise count rates for Quadrant D Data is divided into 100 sec bins |
 |
 |
| Parameter | Plot |
|---|---|
| CZT HV Monitor | 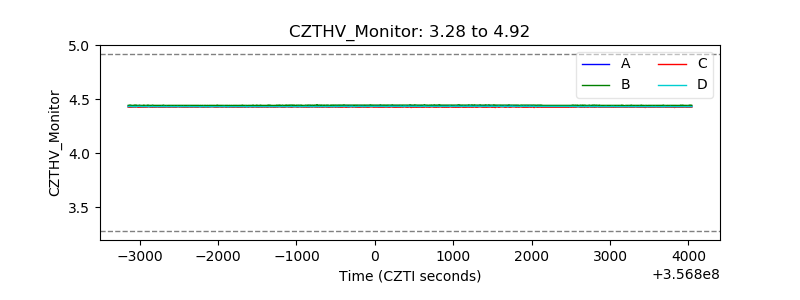 |
| D_VDD | 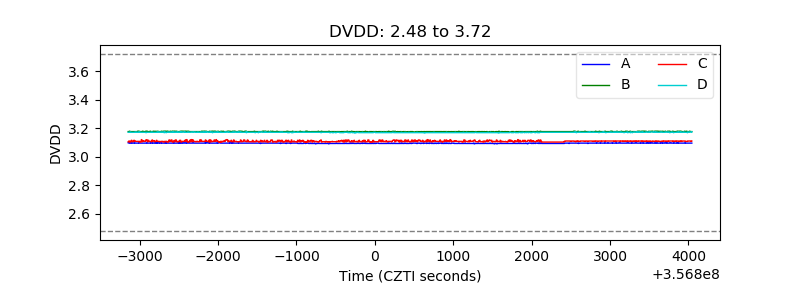 |
| Temperature 1 | 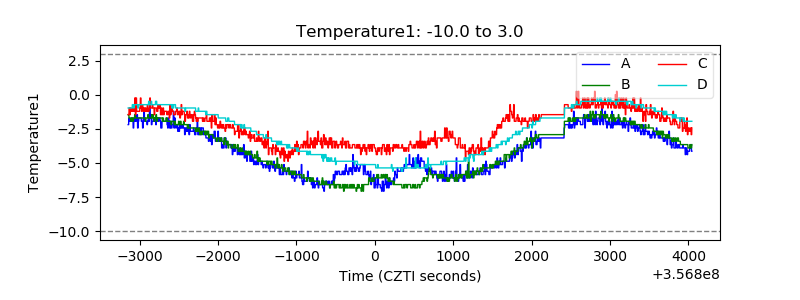 |
| Veto HV Monitor | 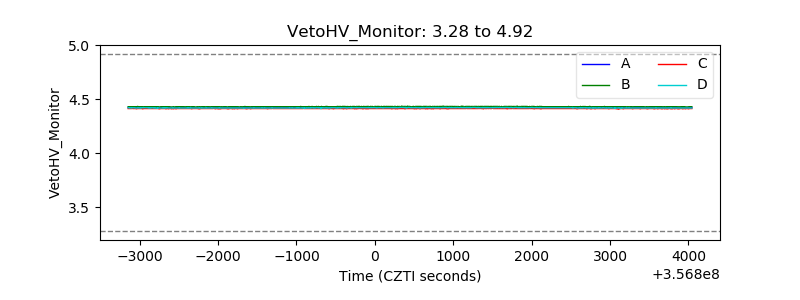 |
| Veto LLD | 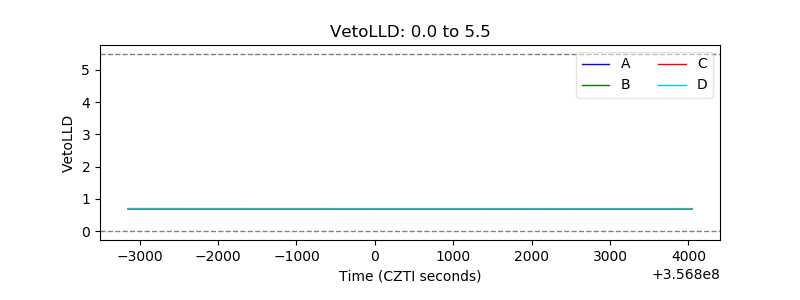 |
| Alpha Counter | 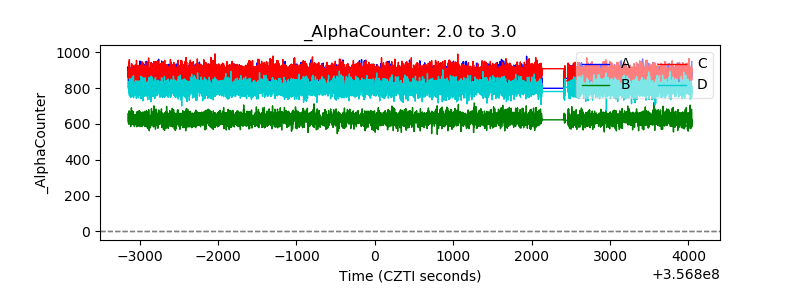 |
| _CPM_Rate | 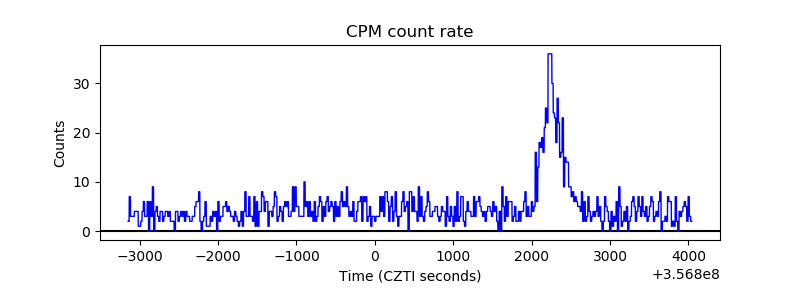 |
| CZT Counter | 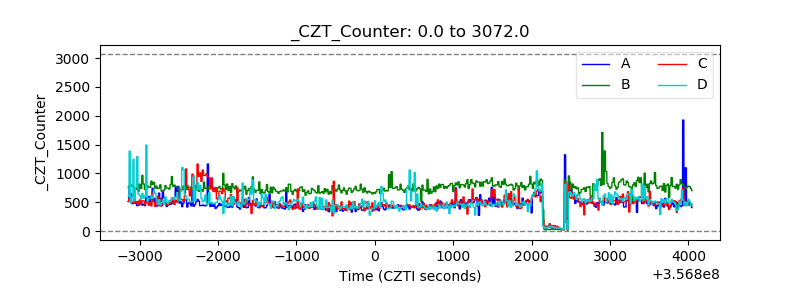 |
| +2.5 Volts monitor | 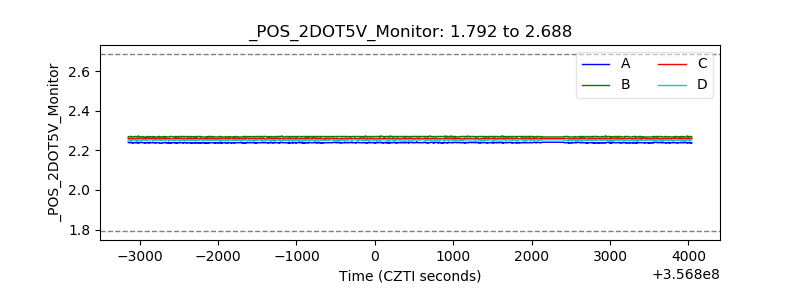 |
| +5 Volts monitor | 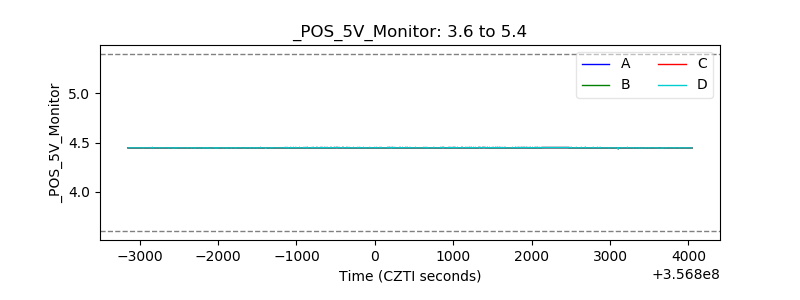 |
| _ROLL_ROT | 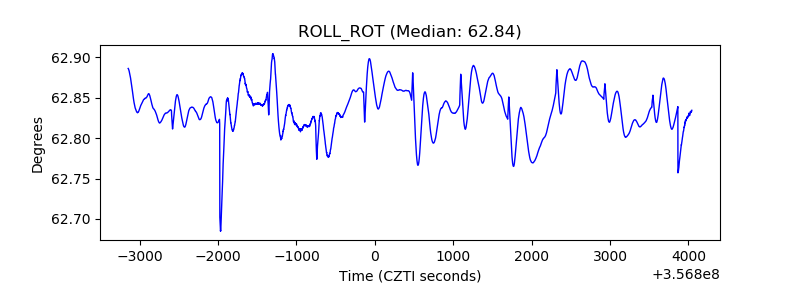 |
| _Roll_DEC | 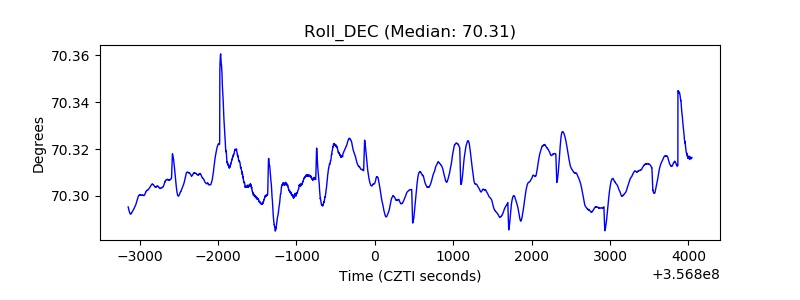 |
| _Roll_RA | 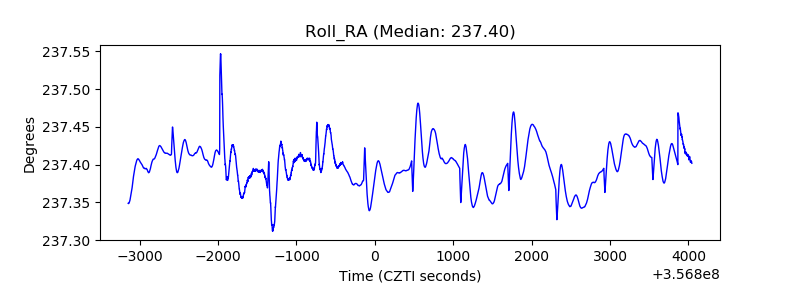 |
| Veto Counter | 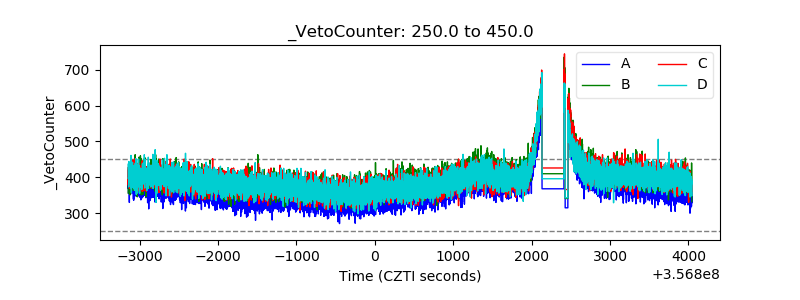 |