| Param | Original file | Final file |
|---|---|---|
| Filename | modeM0/AS1C05_019T01_9000004332_30106cztM0_level2.evt | modeM0/AS1C05_019T01_9000004332_30106cztM0_level2_quad_clean.evt |
| Size (bytes) | 517,078,080 | 138,277,440 |
| Size | 493.1 MB | 131.9 MB |
| Events in quadrant A | 3,219,895 | 949,363 |
| Events in quadrant B | 5,174,435 | 962,266 |
| Events in quadrant C | 3,390,097 | 915,168 |
| Events in quadrant D | 3,426,585 | 900,003 |
| Mode M9 | |||
|---|---|---|---|
| Quadrant | BADHDUFLAG | Total packets | Discarded packets |
| A | 0 | 13 | 0 |
| B | 0 | 14 | 0 |
| C | 0 | 14 | 0 |
| D | 0 | 14 | 0 |
| Mode M0 | |||
|---|---|---|---|
| Quadrant | BADHDUFLAG | Total packets | Discarded packets |
| A | 0 | 13834 | 1 |
| B | 0 | 20249 | 1 |
| C | 0 | 14242 | 1 |
| D | 0 | 14752 | 1 |
| Mode SS | |||
|---|---|---|---|
| Quadrant | BADHDUFLAG | Total packets | Discarded packets |
| A | 0 | 134 | 0 |
| B | 0 | 134 | 0 |
| C | 0 | 134 | 0 |
| D | 0 | 134 | 0 |
| Quadrant | Total seconds | Saturated seconds | Saturation percentage |
|---|---|---|---|
| A | 6621 | 41 | 0.619242% |
| B | 6621 | 88 | 1.329104% |
| C | 6621 | 175 | 2.643105% |
| D | 6621 | 42 | 0.634345% |
Noise dominated data is calculated using 1-second bins in cleaned event files. If a bin has >2000 counts, and if more than 50% of those come from <1% of pixels, then it is considered to be noise-dominated and hence unusable.
| Quadrant | # 1 sec bins | Bins with >0 counts | Bins with >2000 counts | High rate bins dominated by noise | Noise dominated (total time) | Noise dominated (detector-on time) | Marked lightcurve |
|---|---|---|---|---|---|---|---|
| A | 7821 | 6622 | 2 | 2 | 0.03% | 0.03% | 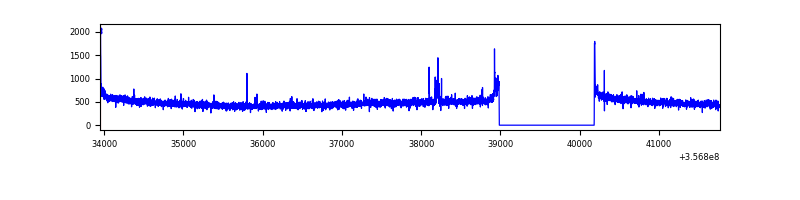 |
| B | 7821 | 6622 | 6 | 6 | 0.08% | 0.09% | 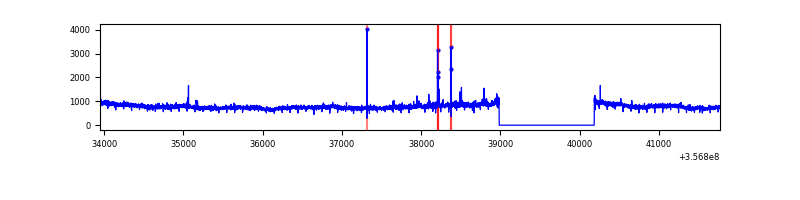 |
| C | 7821 | 6622 | 1 | 1 | 0.01% | 0.02% | 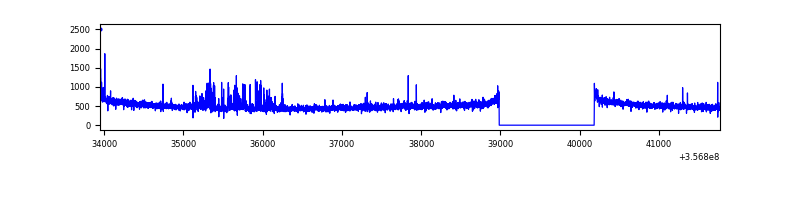 |
| D | 7821 | 6622 | 21 | 21 | 0.27% | 0.32% | 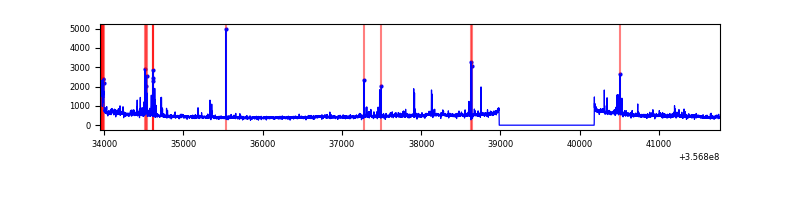 |
Top three noisy pixels from each quadrant. If the there are fewer than three noisy pixels in the level2.evt file, extra rows are filled as -1
| Pixel properties | Quadrant properties | ||||||
|---|---|---|---|---|---|---|---|
| Quadrant | DetID | PixID | Counts | Sigma | Mean | Median | Sigma |
| A | 14 | 238 | 29765 | 178.49 | 820 | 805 | 162.3 |
| A | 8 | 192 | 23204 | 138.05 | 820 | 805 | 162.3 |
| A | 13 | 254 | 11752 | 67.47 | 820 | 805 | 162.3 |
| B | 6 | 159 | 1877831 | 12290.84 | 821 | 803 | 152.7 |
| B | 0 | 190 | 36190 | 231.72 | 821 | 803 | 152.7 |
| B | 12 | 111 | 18313 | 114.66 | 821 | 803 | 152.7 |
| C | 14 | 238 | 192528 | 1057.67 | 785 | 791 | 181.3 |
| C | 14 | 254 | 86046 | 470.29 | 785 | 791 | 181.3 |
| C | 3 | 233 | 26440 | 141.49 | 785 | 791 | 181.3 |
| D | 8 | 195 | 187011 | 1008.03 | 780 | 761 | 184.8 |
| D | 2 | 250 | 101342 | 544.37 | 780 | 761 | 184.8 |
| D | 12 | 227 | 96550 | 518.43 | 780 | 761 | 184.8 |
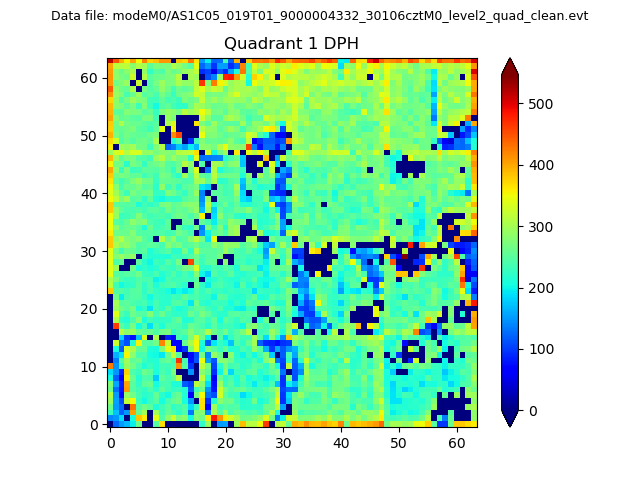
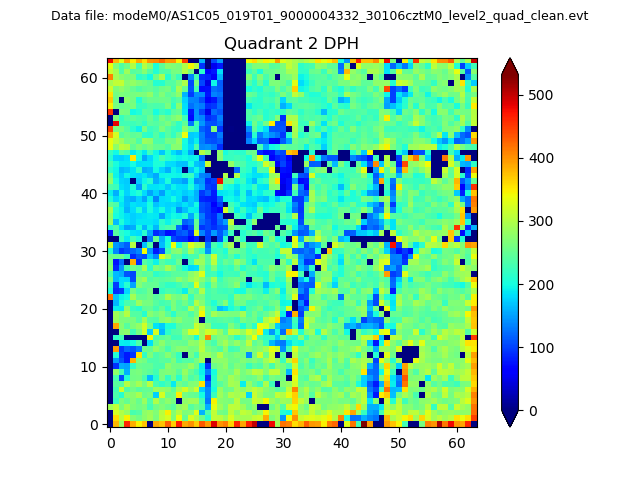
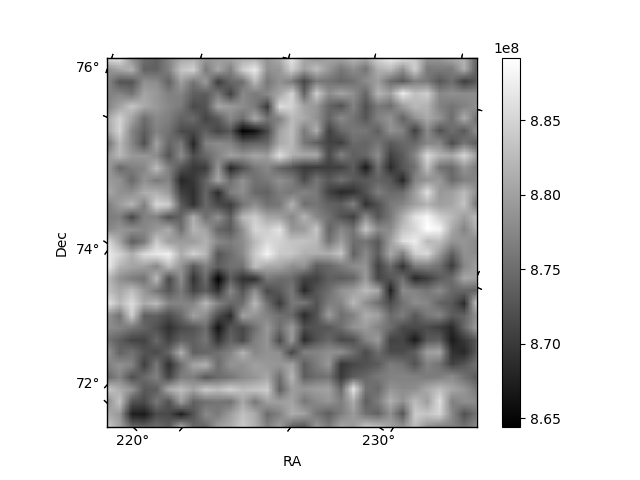
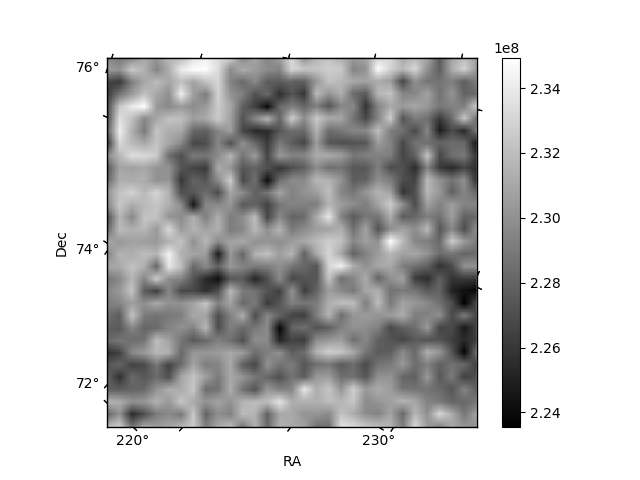
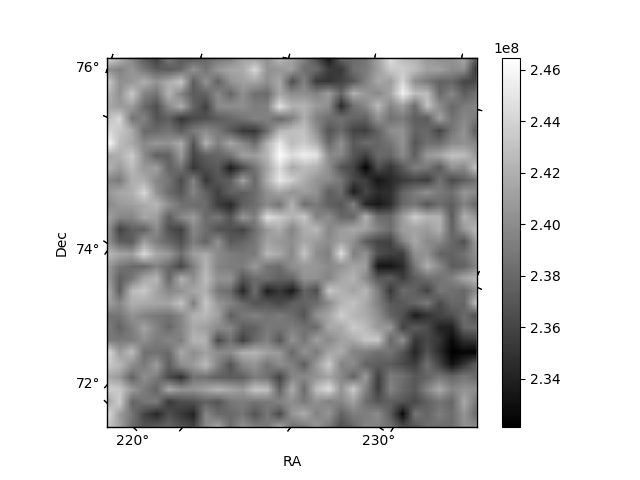
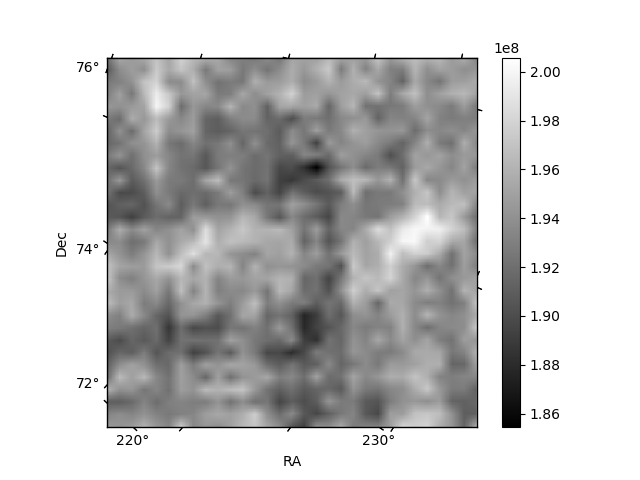
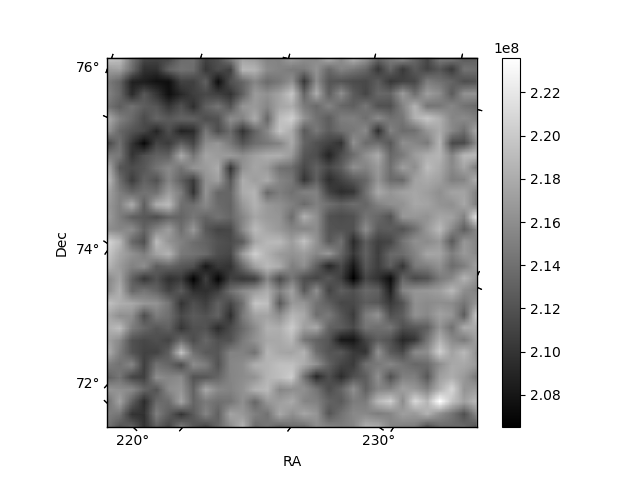
Histogram calculated using DETX and DETY for each event in the final _common_clean file
| Quadrant A |  |
 |
Quadrant B |
|---|---|---|---|
| Quadrant D | 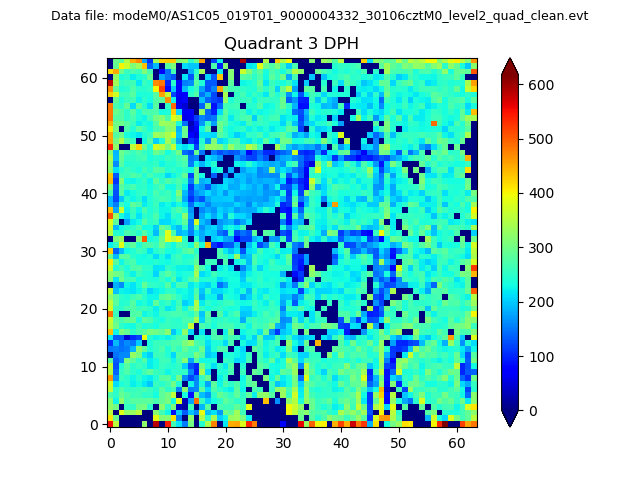 |
 |
Quadrant C |
| Plot type | Count rate plots | Images |
|---|---|---|
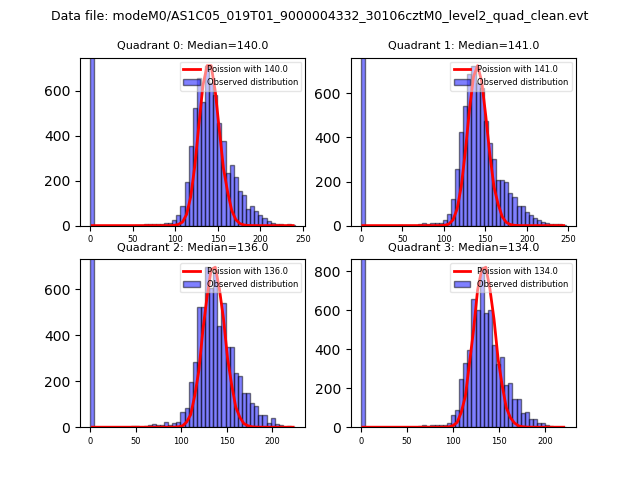
| Comparison with Poisson distribution Blue bars denote a histogram of data divided into 1 sec bins. Red curve is a Poisson curve with rate = median count rate of data. |
 |
 |
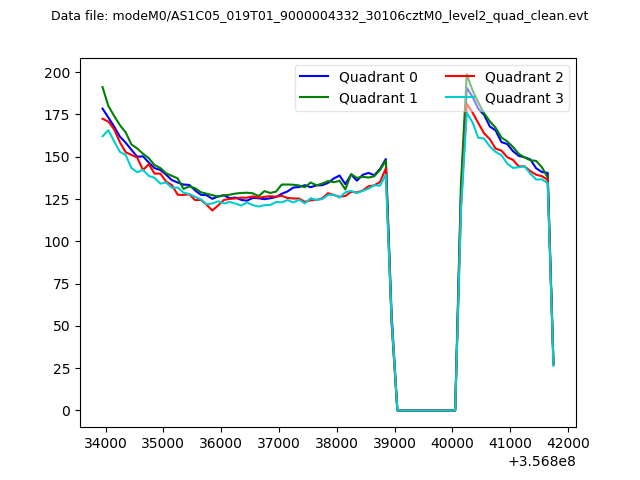
| Quadrant-wise count rates Data is divided into 100 sec bins |
 |
|
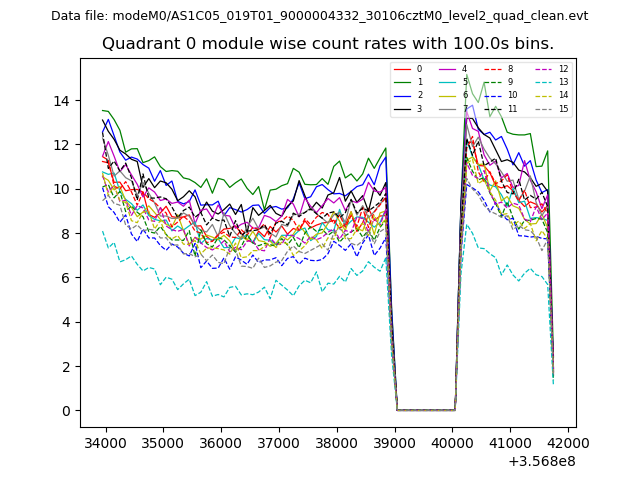
| Module-wise count rates for Quadrant A Data is divided into 100 sec bins |
 |
 |
| Module-wise count rates for Quadrant B Data is divided into 100 sec bins |
 |
 |
| Module-wise count rates for Quadrant C Data is divided into 100 sec bins |
 |
 |
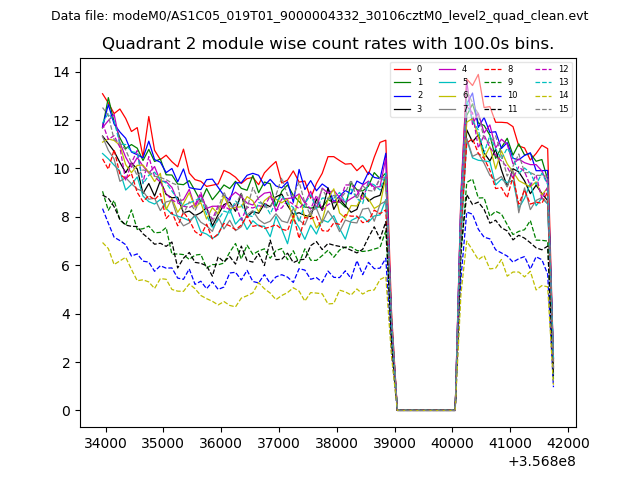
| Module-wise count rates for Quadrant D Data is divided into 100 sec bins |
 |
 |
| Parameter | Plot |
|---|---|
| CZT HV Monitor |  |
| D_VDD | 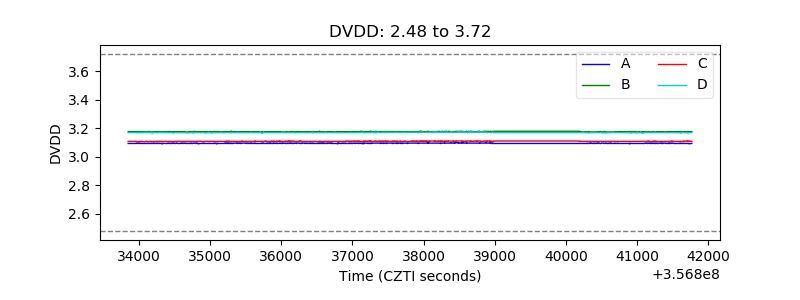 |
| Temperature 1 | 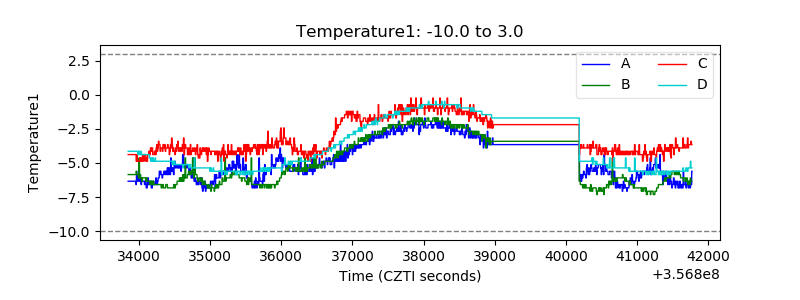 |
| Veto HV Monitor | 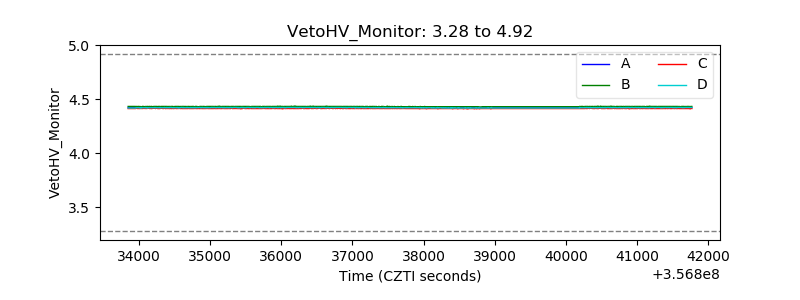 |
| Veto LLD |  |
| Alpha Counter | 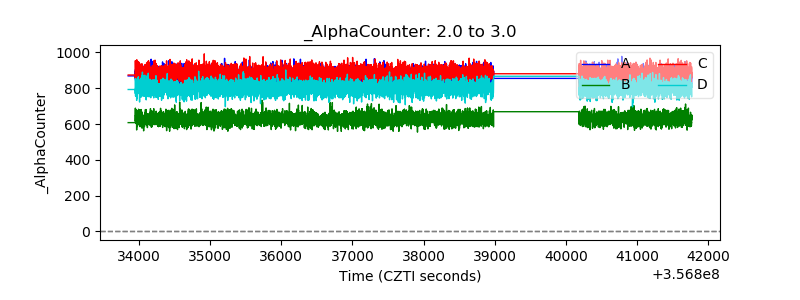 |
| _CPM_Rate | 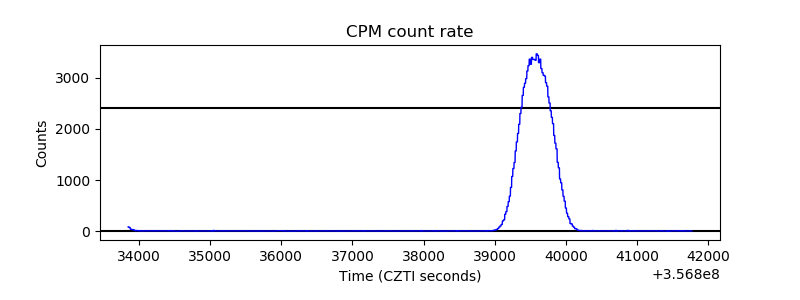 |
| CZT Counter | 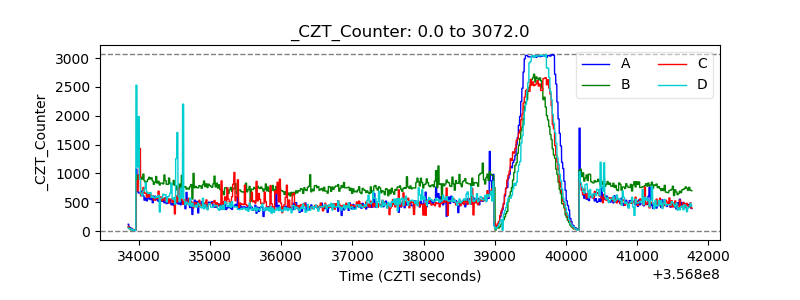 |
| +2.5 Volts monitor |  |
| +5 Volts monitor |  |
| _ROLL_ROT | 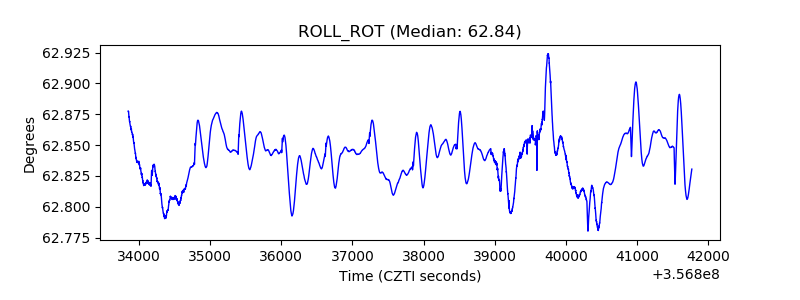 |
| _Roll_DEC | 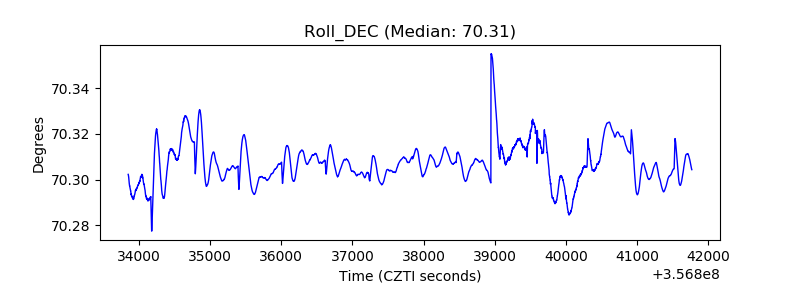 |
| _Roll_RA | 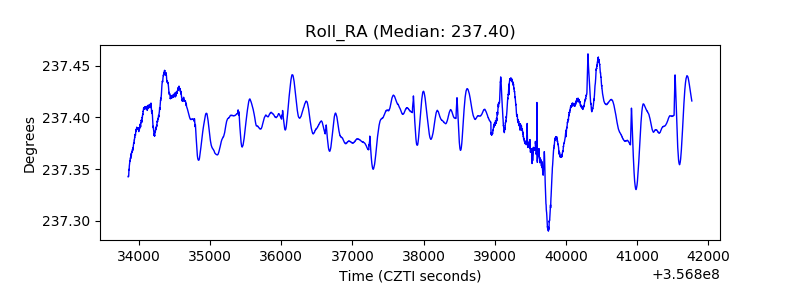 |
| Veto Counter | 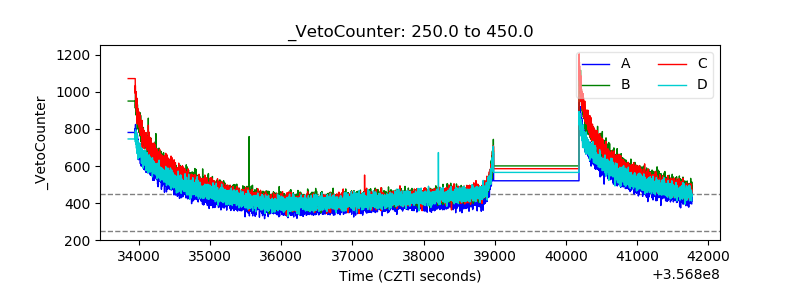 |