| Param | Original file | Final file |
|---|---|---|
| Filename | modeM0/AS1C05_019T01_9000004332_30107cztM0_level2.evt | modeM0/AS1C05_019T01_9000004332_30107cztM0_level2_quad_clean.evt |
| Size (bytes) | 469,033,920 | 125,640,000 |
| Size | 447.3 MB | 119.8 MB |
| Events in quadrant A | 2,957,819 | 867,730 |
| Events in quadrant B | 4,556,408 | 878,884 |
| Events in quadrant C | 2,900,736 | 829,781 |
| Events in quadrant D | 3,387,939 | 815,345 |
| Mode M9 | |||
|---|---|---|---|
| Quadrant | BADHDUFLAG | Total packets | Discarded packets |
| A | 0 | 13 | 0 |
| B | 0 | 13 | 0 |
| C | 0 | 13 | 0 |
| D | 0 | 13 | 0 |
| Mode M0 | |||
|---|---|---|---|
| Quadrant | BADHDUFLAG | Total packets | Discarded packets |
| A | 0 | 12455 | 1 |
| B | 0 | 17860 | 1 |
| C | 0 | 12266 | 1 |
| D | 0 | 14083 | 1 |
| Mode SS | |||
|---|---|---|---|
| Quadrant | BADHDUFLAG | Total packets | Discarded packets |
| A | 0 | 118 | 0 |
| B | 0 | 118 | 0 |
| C | 0 | 118 | 0 |
| D | 0 | 118 | 0 |
| Quadrant | Total seconds | Saturated seconds | Saturation percentage |
|---|---|---|---|
| A | 5924 | 25 | 0.422012% |
| B | 5925 | 46 | 0.776371% |
| C | 5925 | 55 | 0.928270% |
| D | 5925 | 84 | 1.417722% |
Noise dominated data is calculated using 1-second bins in cleaned event files. If a bin has >2000 counts, and if more than 50% of those come from <1% of pixels, then it is considered to be noise-dominated and hence unusable.
| Quadrant | # 1 sec bins | Bins with >0 counts | Bins with >2000 counts | High rate bins dominated by noise | Noise dominated (total time) | Noise dominated (detector-on time) | Marked lightcurve |
|---|---|---|---|---|---|---|---|
| A | 7229 | 5925 | 5 | 5 | 0.07% | 0.08% | 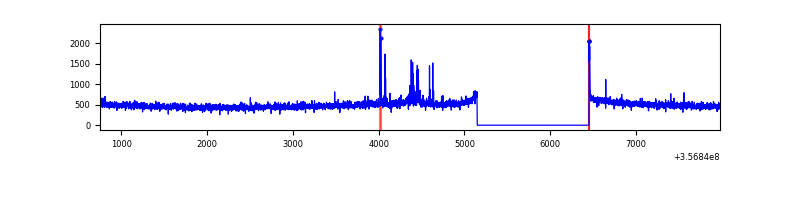 |
| B | 7230 | 5926 | 0 | 0 | 0.00% | 0.00% | 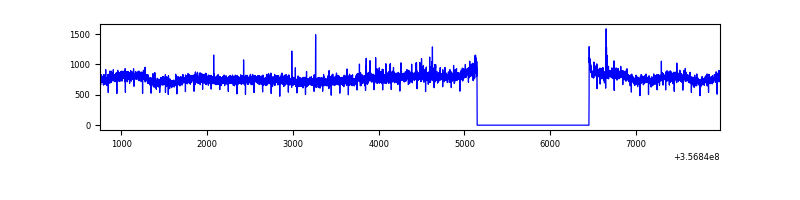 |
| C | 7230 | 5926 | 0 | 0 | 0.00% | 0.00% | 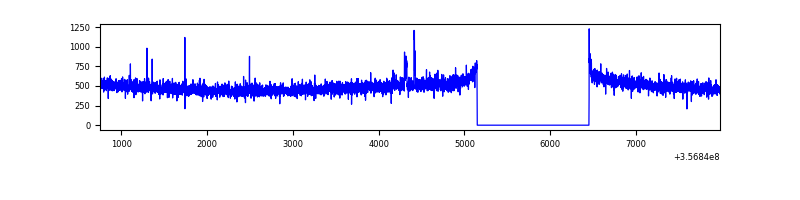 |
| D | 7230 | 5926 | 49 | 49 | 0.68% | 0.83% |  |
Top three noisy pixels from each quadrant. If the there are fewer than three noisy pixels in the level2.evt file, extra rows are filled as -1
| Pixel properties | Quadrant properties | ||||||
|---|---|---|---|---|---|---|---|
| Quadrant | DetID | PixID | Counts | Sigma | Mean | Median | Sigma |
| A | 14 | 238 | 63191 | 427.77 | 742 | 732 | 146.0 |
| A | 8 | 192 | 13761 | 89.23 | 742 | 732 | 146.0 |
| A | 13 | 254 | 10778 | 68.8 | 742 | 732 | 146.0 |
| B | 6 | 159 | 1646560 | 11996.99 | 735 | 720 | 137.2 |
| B | 0 | 190 | 26527 | 188.11 | 735 | 720 | 137.2 |
| B | 12 | 111 | 15993 | 111.33 | 735 | 720 | 137.2 |
| C | 14 | 238 | 120932 | 741.44 | 700 | 705 | 162.2 |
| C | 3 | 233 | 19646 | 116.81 | 700 | 705 | 162.2 |
| C | 2 | 114 | 13161 | 76.82 | 700 | 705 | 162.2 |
| D | 13 | 104 | 323807 | 1985.07 | 698 | 681 | 162.8 |
| D | 7 | 238 | 175813 | 1075.9 | 698 | 681 | 162.8 |
| D | 8 | 195 | 118418 | 723.3 | 698 | 681 | 162.8 |
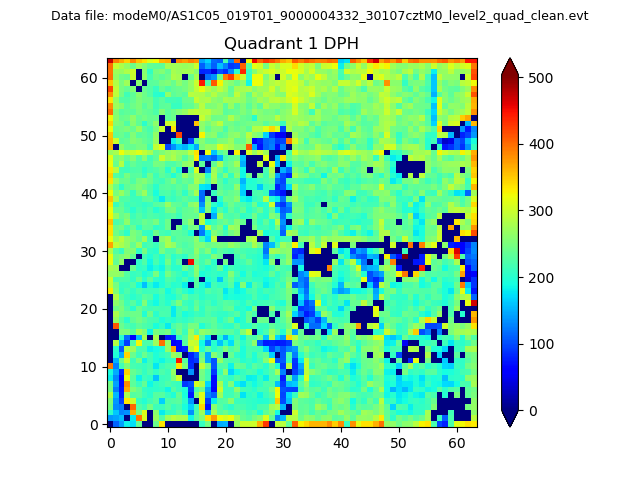
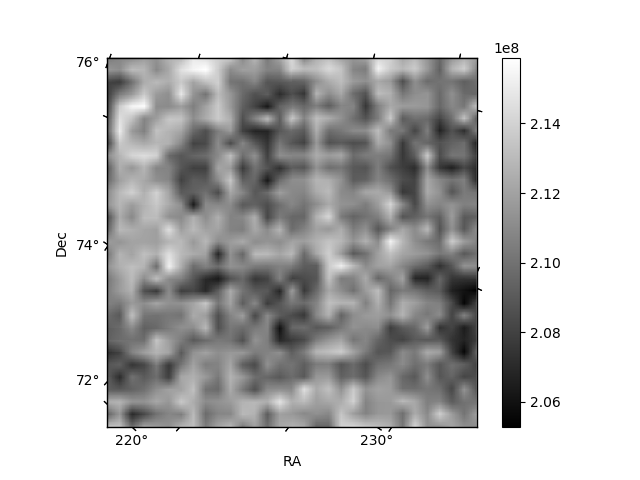
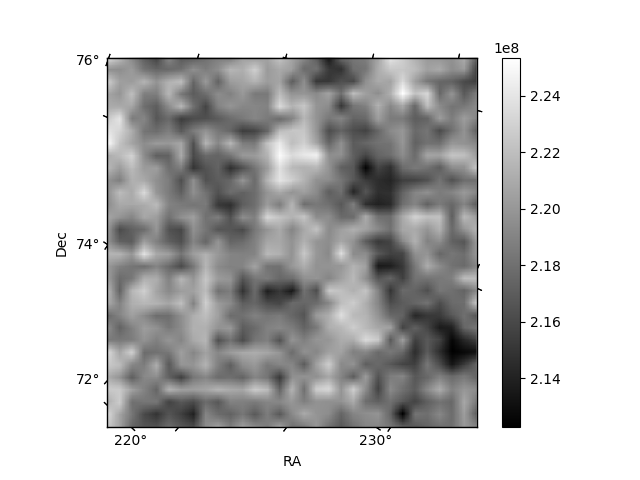
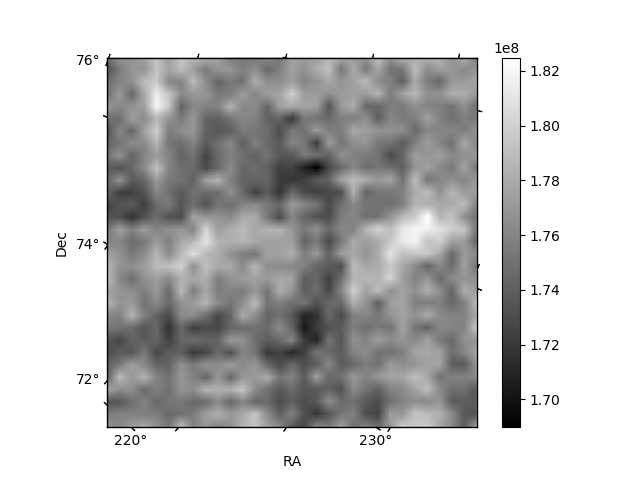
Histogram calculated using DETX and DETY for each event in the final _common_clean file
| Quadrant A | 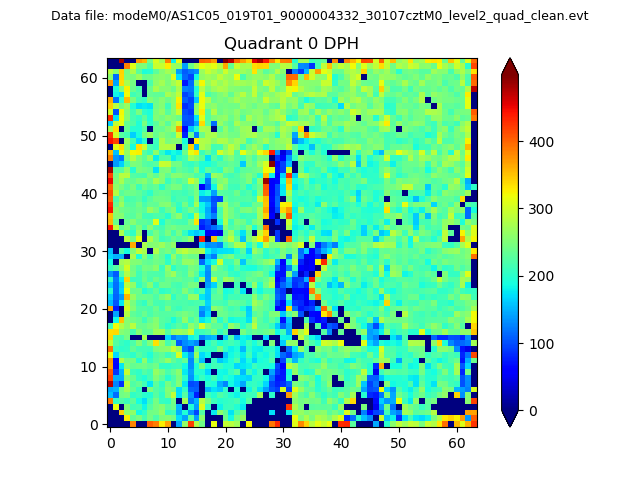 |
 |
Quadrant B |
|---|---|---|---|
| Quadrant D | 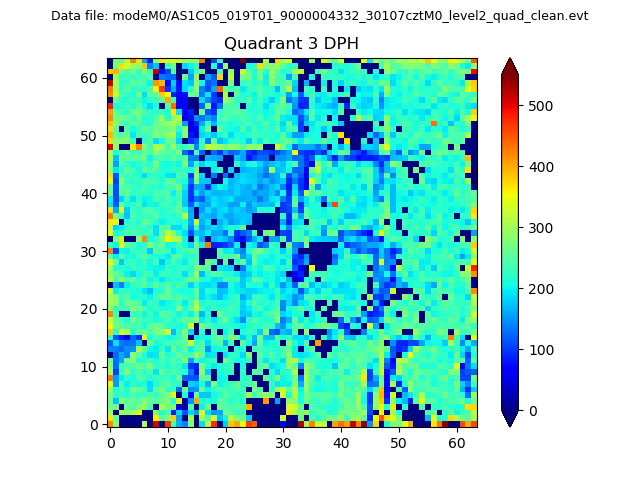 |
 |
Quadrant C |
| Plot type | Count rate plots | Images |
|---|---|---|
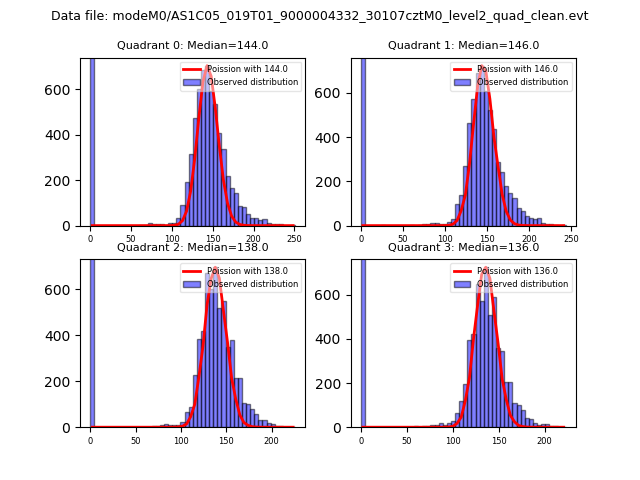
| Comparison with Poisson distribution Blue bars denote a histogram of data divided into 1 sec bins. Red curve is a Poisson curve with rate = median count rate of data. |
 |
 |
| Quadrant-wise count rates Data is divided into 100 sec bins |
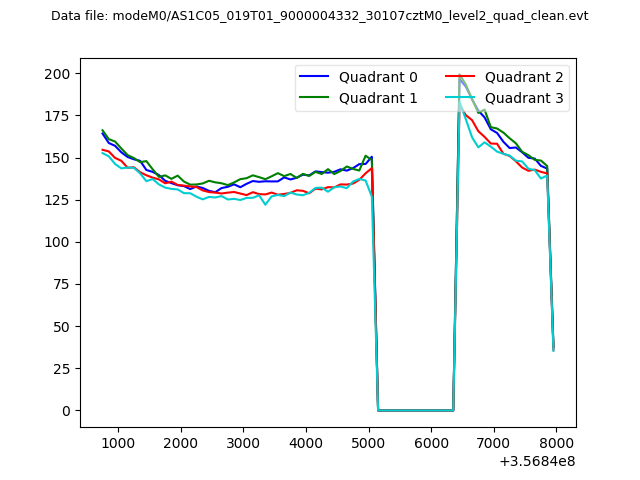 |
|
| Module-wise count rates for Quadrant A Data is divided into 100 sec bins |
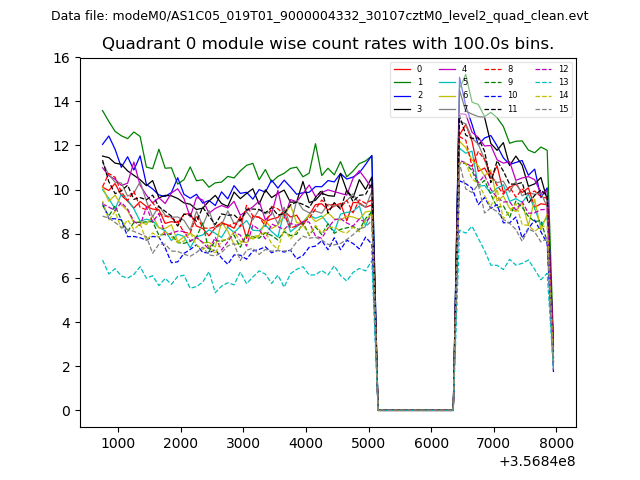 |
 |
| Module-wise count rates for Quadrant B Data is divided into 100 sec bins |
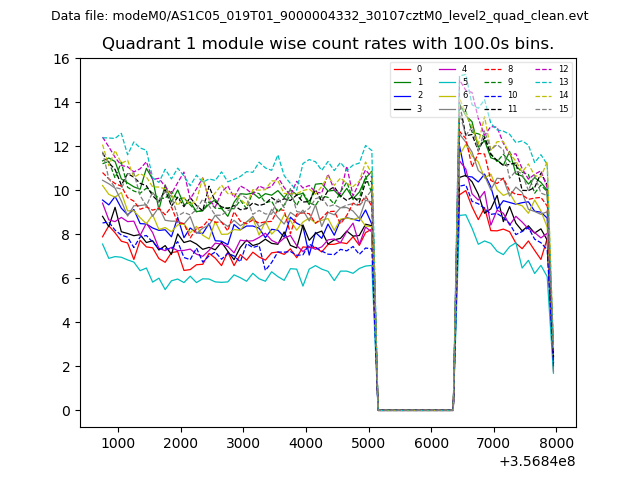 |
 |
| Module-wise count rates for Quadrant C Data is divided into 100 sec bins |
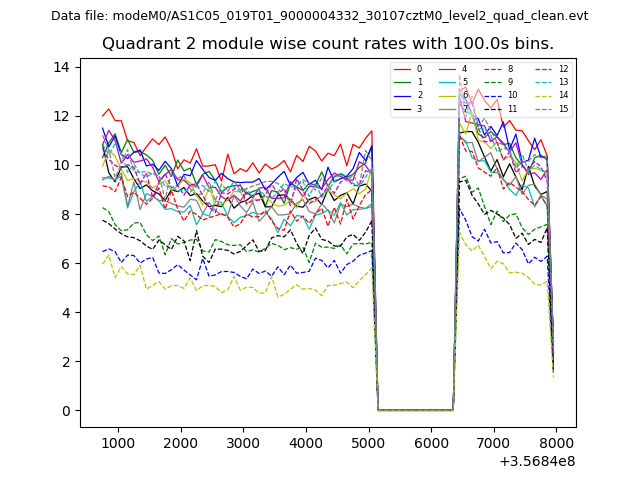 |
 |
| Module-wise count rates for Quadrant D Data is divided into 100 sec bins |
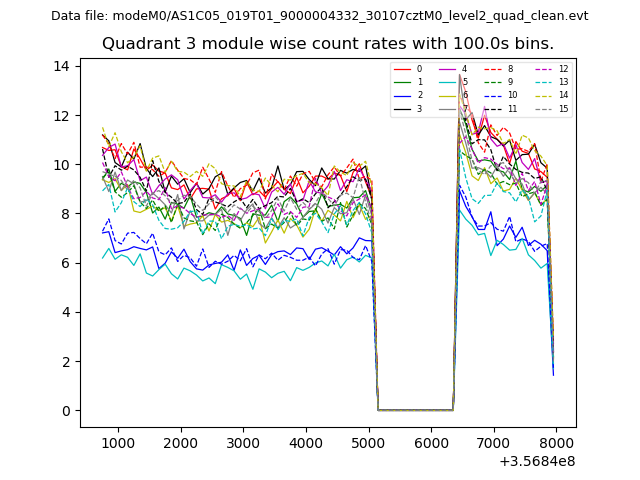 |
 |
| Parameter | Plot |
|---|---|
| CZT HV Monitor | 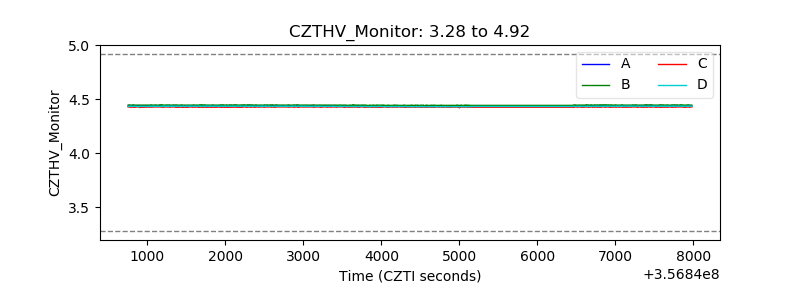 |
| D_VDD | 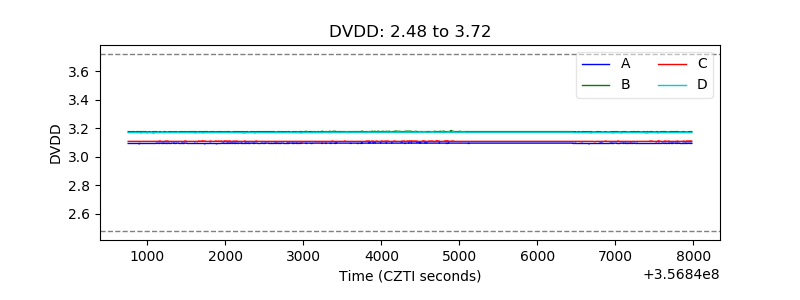 |
| Temperature 1 | 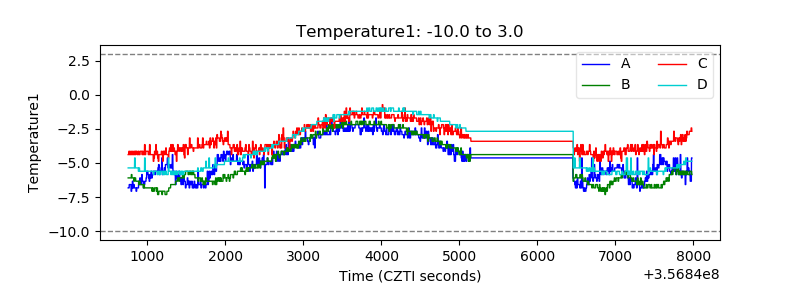 |
| Veto HV Monitor | 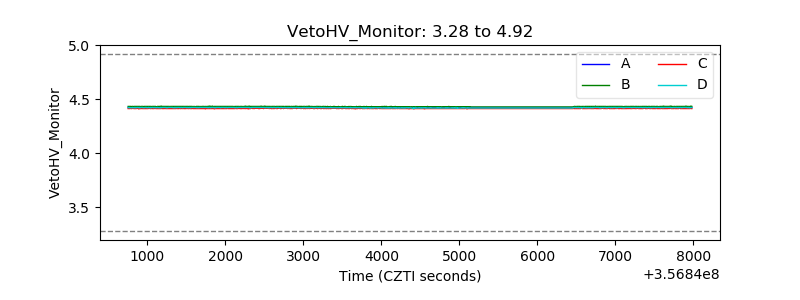 |
| Veto LLD | 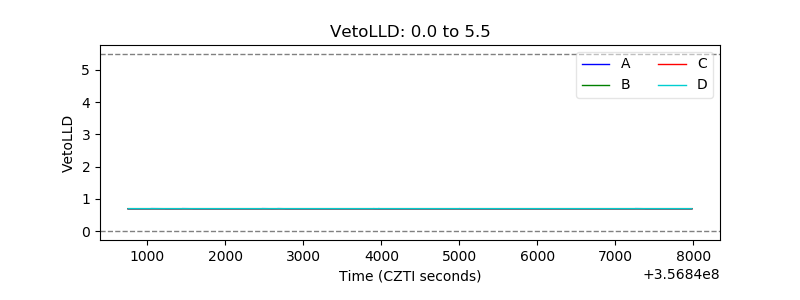 |
| Alpha Counter | 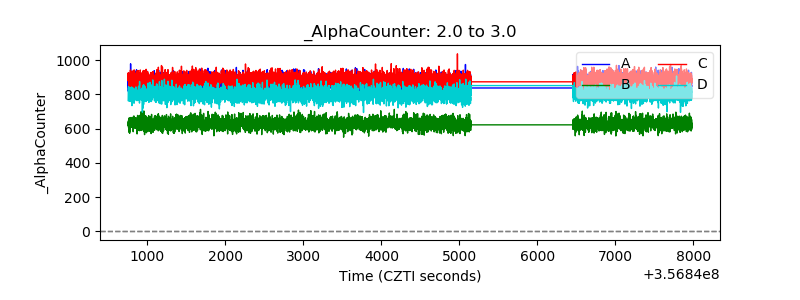 |
| _CPM_Rate | 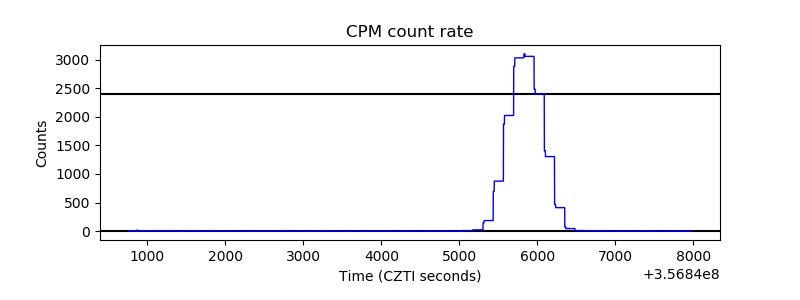 |
| CZT Counter |  |
| +2.5 Volts monitor |  |
| +5 Volts monitor | 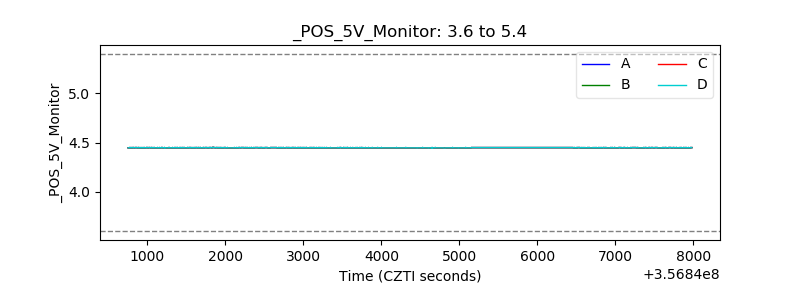 |
| _ROLL_ROT | 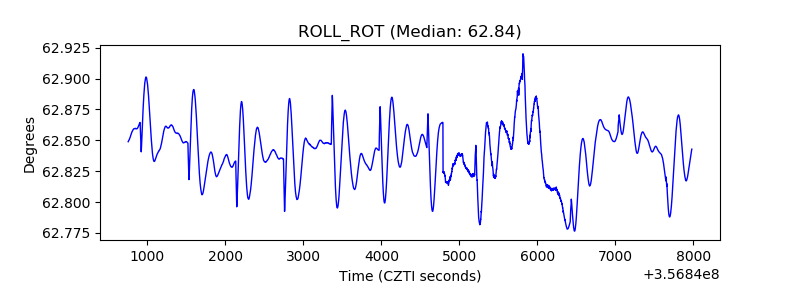 |
| _Roll_DEC | 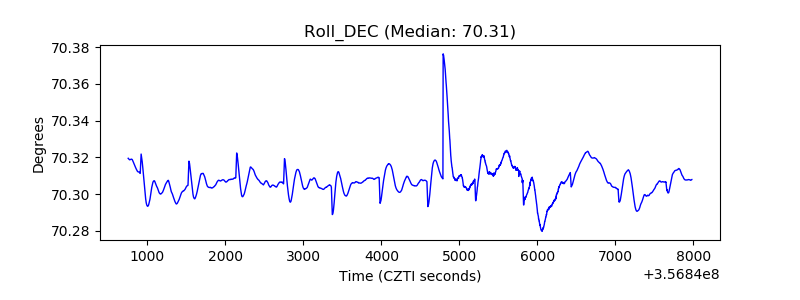 |
| _Roll_RA | 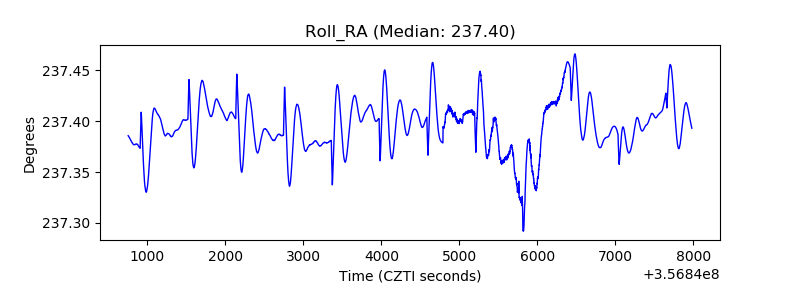 |
| Veto Counter | 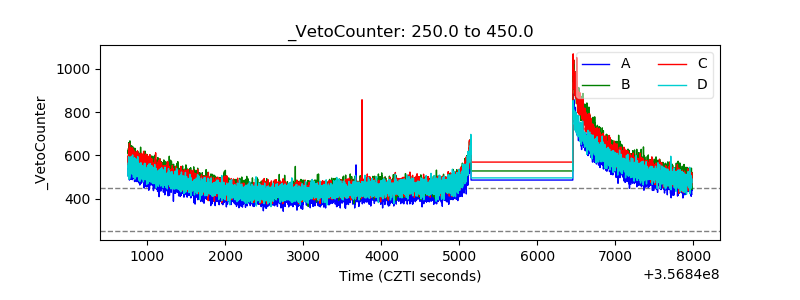 |