| Param | Original file | Final file |
|---|---|---|
| Filename | modeM0/AS1C05_019T01_9000004332_30108cztM0_level2.evt | modeM0/AS1C05_019T01_9000004332_30108cztM0_level2_quad_clean.evt |
| Size (bytes) | 538,355,520 | 134,706,240 |
| Size | 513.4 MB | 128.5 MB |
| Events in quadrant A | 3,160,667 | 951,551 |
| Events in quadrant B | 4,906,096 | 953,994 |
| Events in quadrant C | 3,192,044 | 896,937 |
| Events in quadrant D | 4,619,866 | 839,071 |
| Mode M9 | |||
|---|---|---|---|
| Quadrant | BADHDUFLAG | Total packets | Discarded packets |
| A | 0 | 15 | 0 |
| B | 0 | 16 | 0 |
| C | 0 | 16 | 1 |
| D | 0 | 16 | 0 |
| Mode M0 | |||
|---|---|---|---|
| Quadrant | BADHDUFLAG | Total packets | Discarded packets |
| A | 0 | 13121 | 16 |
| B | 0 | 19052 | 32 |
| C | 0 | 13314 | 11 |
| D | 0 | 17851 | 28 |
| Mode SS | |||
|---|---|---|---|
| Quadrant | BADHDUFLAG | Total packets | Discarded packets |
| A | 0 | 128 | 0 |
| B | 0 | 128 | 0 |
| C | 0 | 128 | 0 |
| D | 0 | 128 | 4 |
| Quadrant | Total seconds | Saturated seconds | Saturation percentage |
|---|---|---|---|
| A | 6284 | 30 | 0.477403% |
| B | 6280 | 74 | 1.178344% |
| C | 6286 | 94 | 1.495387% |
| D | 6284 | 494 | 7.861235% |
Noise dominated data is calculated using 1-second bins in cleaned event files. If a bin has >2000 counts, and if more than 50% of those come from <1% of pixels, then it is considered to be noise-dominated and hence unusable.
| Quadrant | # 1 sec bins | Bins with >0 counts | Bins with >2000 counts | High rate bins dominated by noise | Noise dominated (total time) | Noise dominated (detector-on time) | Marked lightcurve |
|---|---|---|---|---|---|---|---|
| A | 7625 | 6290 | 3 | 3 | 0.04% | 0.05% | 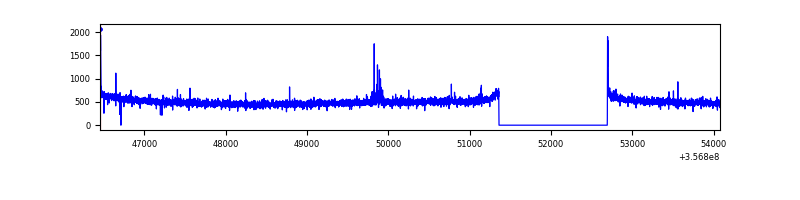 |
| B | 7625 | 6291 | 6 | 6 | 0.08% | 0.10% | 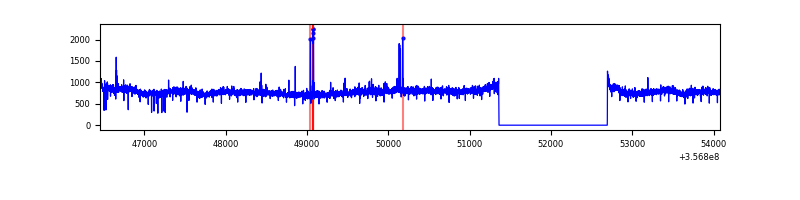 |
| C | 7625 | 6291 | 23 | 23 | 0.30% | 0.37% | 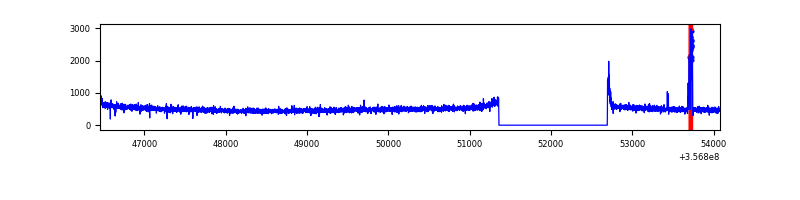 |
| D | 7625 | 6291 | 464 | 464 | 6.09% | 7.38% | 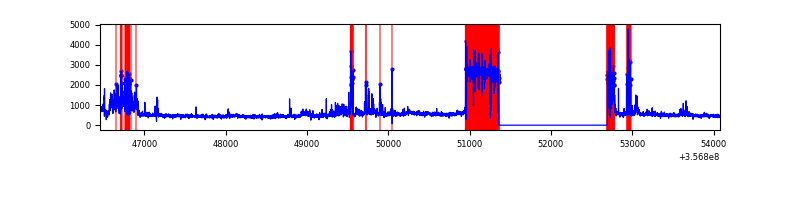 |
Top three noisy pixels from each quadrant. If the there are fewer than three noisy pixels in the level2.evt file, extra rows are filled as -1
| Pixel properties | Quadrant properties | ||||||
|---|---|---|---|---|---|---|---|
| Quadrant | DetID | PixID | Counts | Sigma | Mean | Median | Sigma |
| A | 8 | 192 | 24656 | 150.7 | 809 | 796 | 158.3 |
| A | 14 | 238 | 18201 | 109.93 | 809 | 796 | 158.3 |
| A | 13 | 254 | 10802 | 63.2 | 809 | 796 | 158.3 |
| B | 6 | 159 | 1722566 | 11587.9 | 798 | 781 | 148.6 |
| B | 0 | 190 | 39962 | 263.69 | 798 | 781 | 148.6 |
| B | 12 | 111 | 17380 | 111.71 | 798 | 781 | 148.6 |
| C | 14 | 238 | 129843 | 742.81 | 756 | 760 | 173.8 |
| C | 10 | 20 | 67179 | 382.21 | 756 | 760 | 173.8 |
| C | 0 | 10 | 24139 | 134.53 | 756 | 760 | 173.8 |
| D | 7 | 238 | 981836 | 5841.31 | 721 | 705 | 168.0 |
| D | 13 | 104 | 608340 | 3617.64 | 721 | 705 | 168.0 |
| D | 8 | 195 | 188741 | 1119.5 | 721 | 705 | 168.0 |
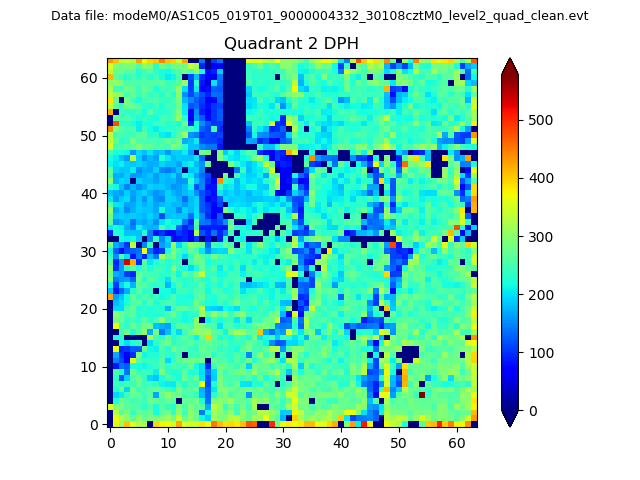
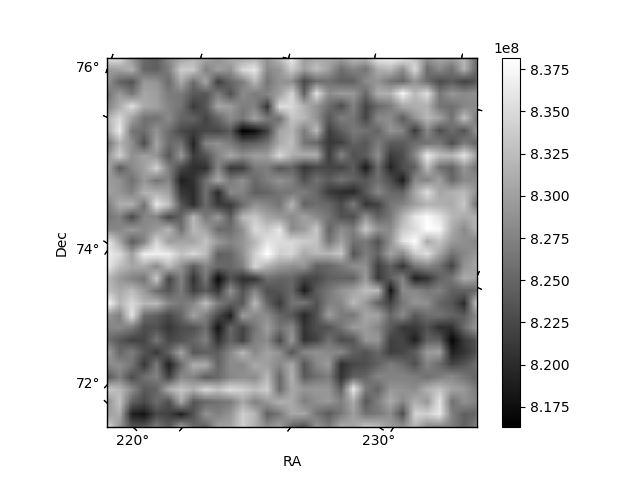
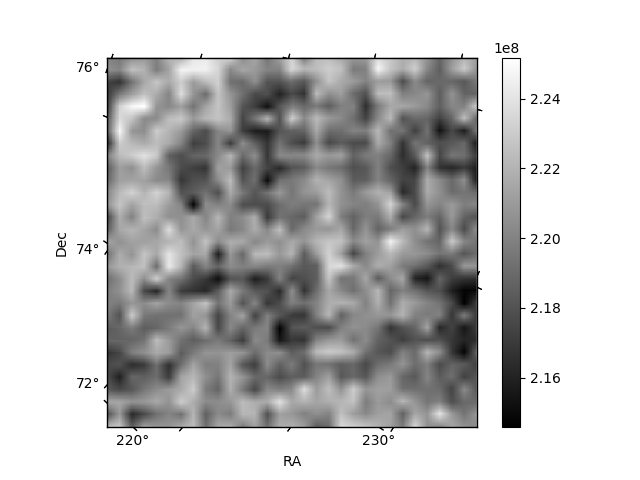
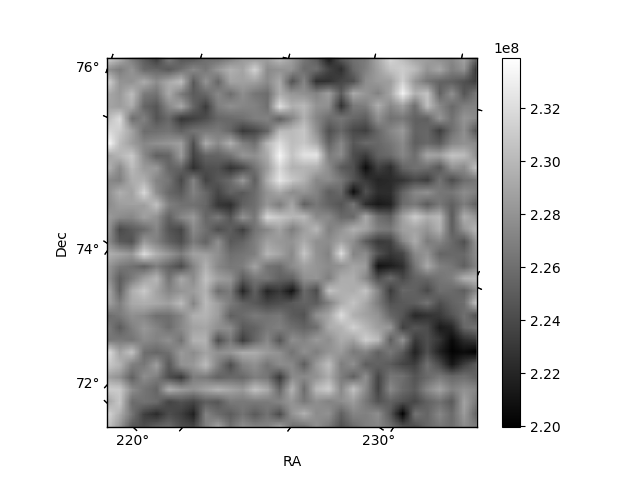
Histogram calculated using DETX and DETY for each event in the final _common_clean file
| Quadrant A | 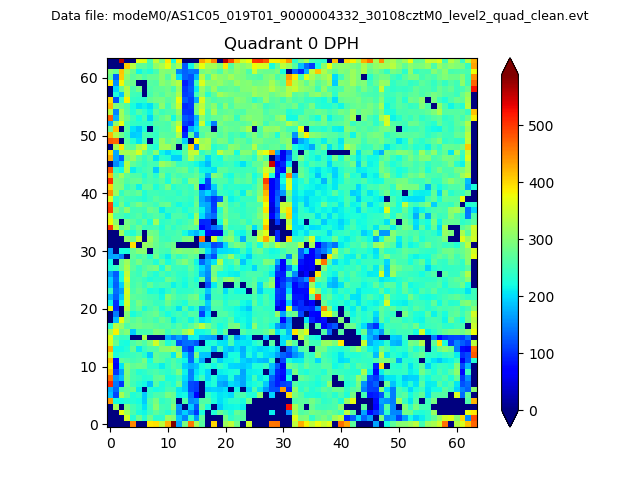 |
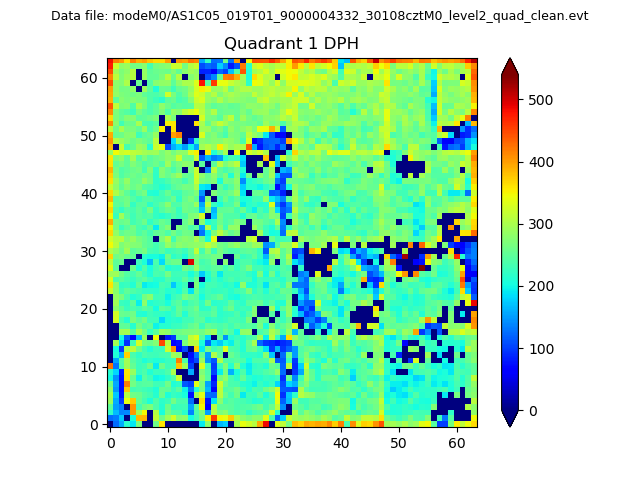 |
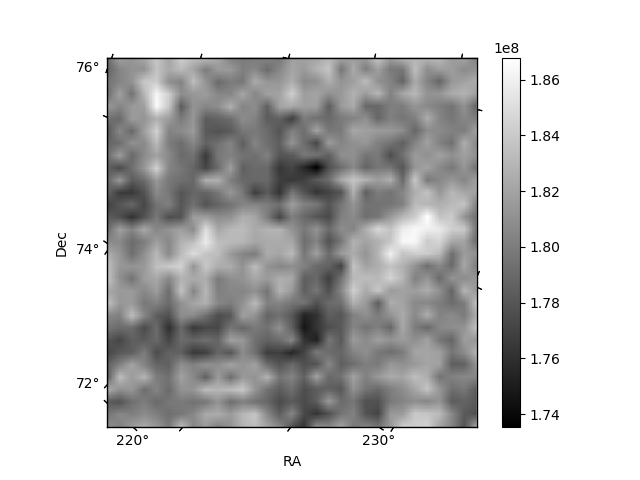
Quadrant B |
|---|---|---|---|
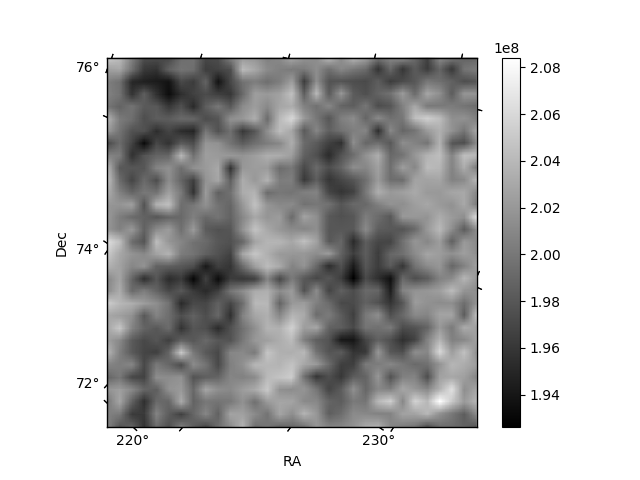
| Quadrant D | 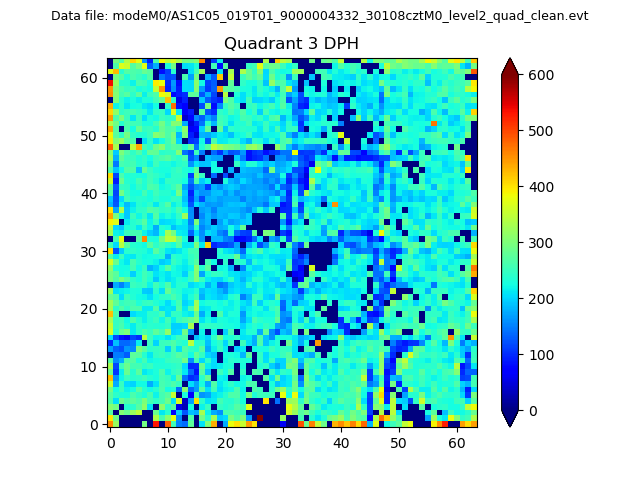 |
 |
Quadrant C |
| Plot type | Count rate plots | Images |
|---|---|---|
| Comparison with Poisson distribution Blue bars denote a histogram of data divided into 1 sec bins. Red curve is a Poisson curve with rate = median count rate of data. |
 |
 |
| Quadrant-wise count rates Data is divided into 100 sec bins |
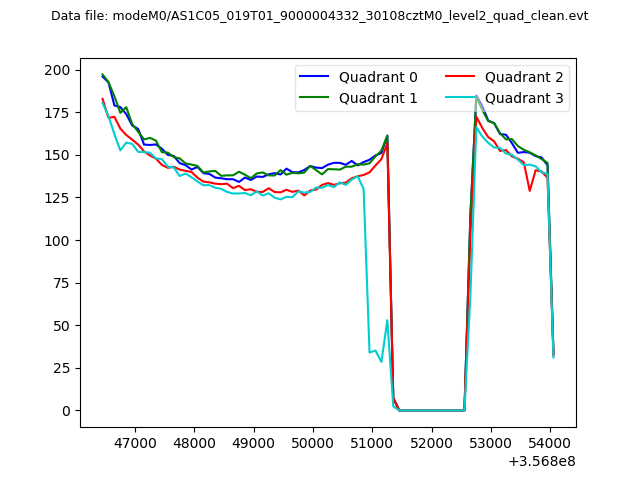 |
|
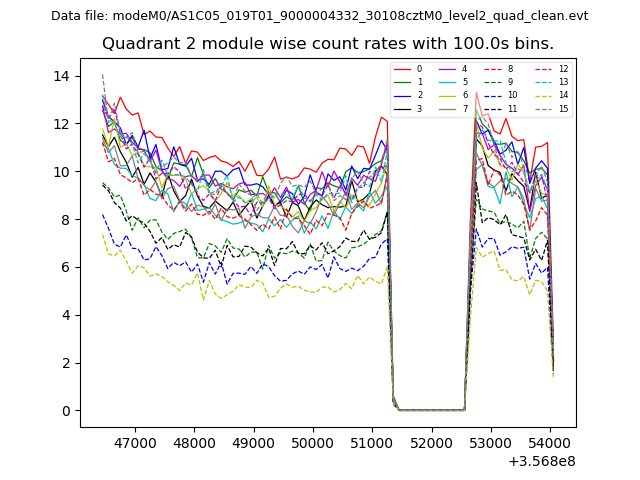
| Module-wise count rates for Quadrant A Data is divided into 100 sec bins |
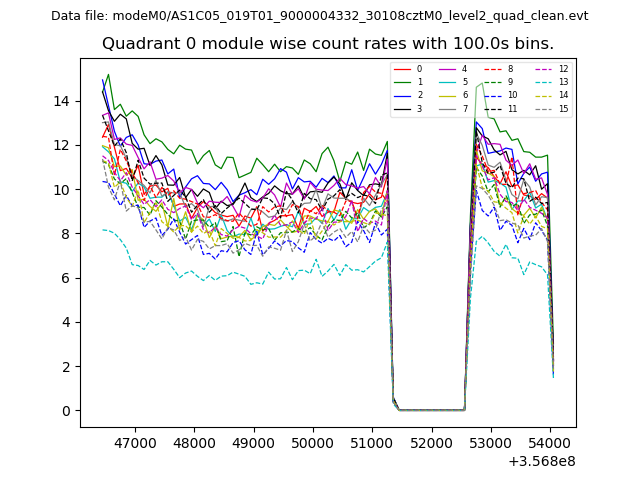 |
 |
| Module-wise count rates for Quadrant B Data is divided into 100 sec bins |
 |
 |
| Module-wise count rates for Quadrant C Data is divided into 100 sec bins |
 |
 |
| Module-wise count rates for Quadrant D Data is divided into 100 sec bins |
 |
 |
| Parameter | Plot |
|---|---|
| CZT HV Monitor | 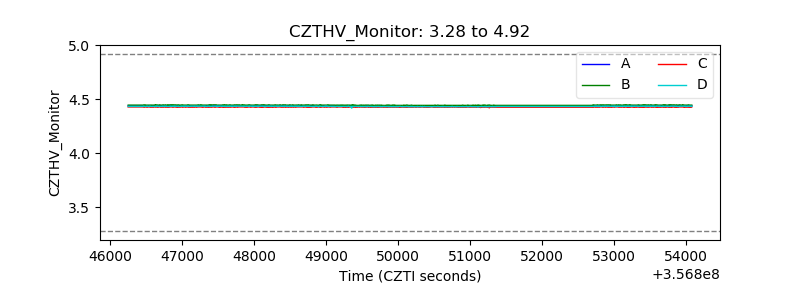 |
| D_VDD | 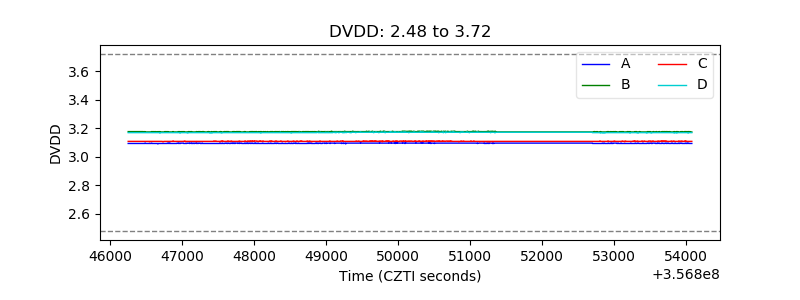 |
| Temperature 1 |  |
| Veto HV Monitor | 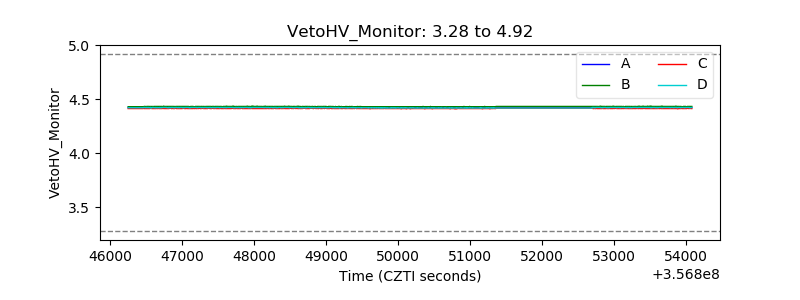 |
| Veto LLD | 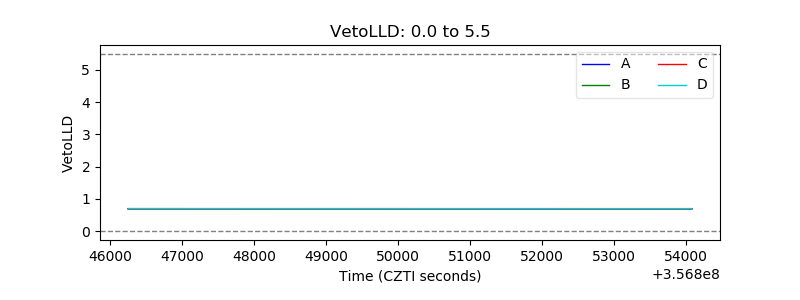 |
| Alpha Counter | 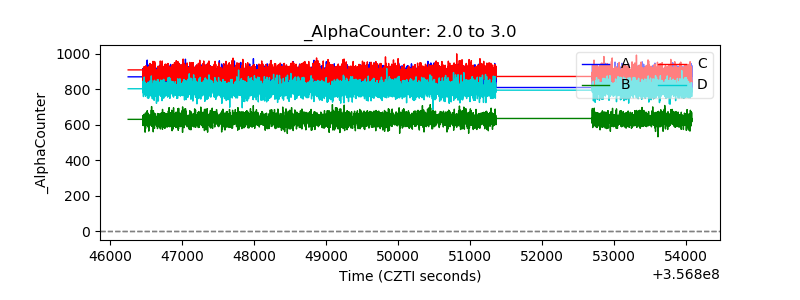 |
| _CPM_Rate | 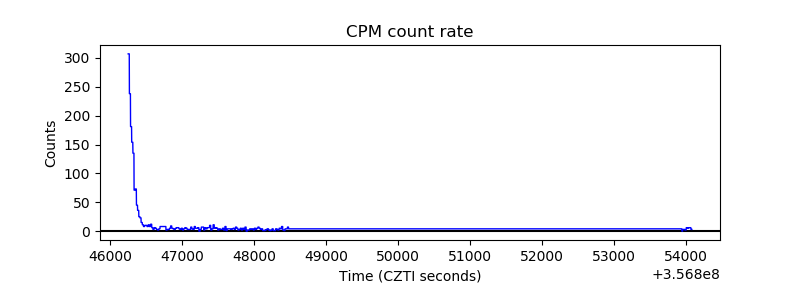 |
| CZT Counter | 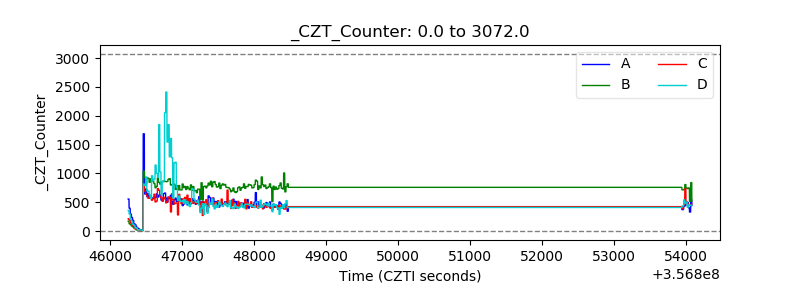 |
| +2.5 Volts monitor |  |
| +5 Volts monitor | 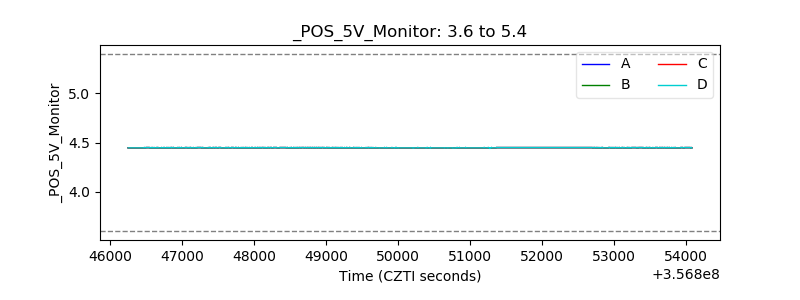 |
| _ROLL_ROT | 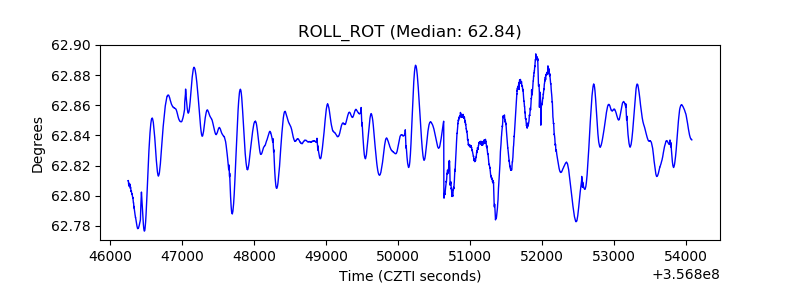 |
| _Roll_DEC | 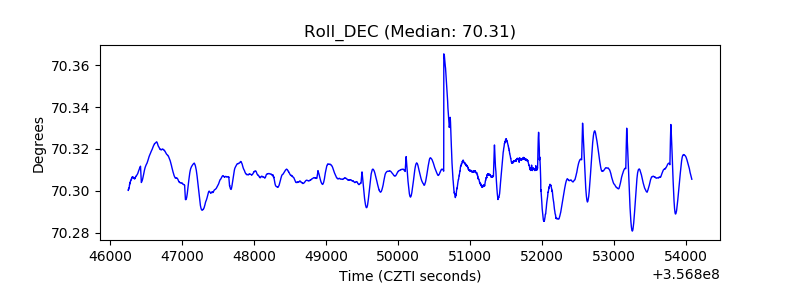 |
| _Roll_RA | 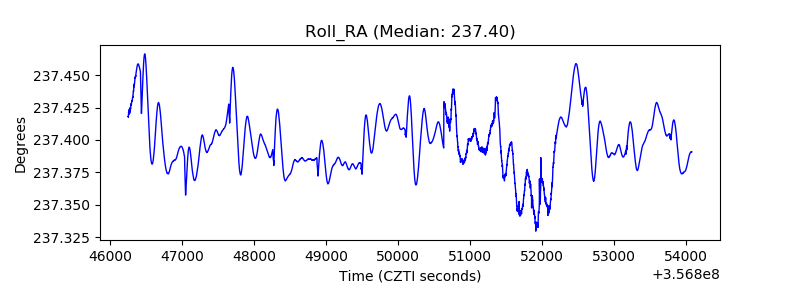 |
| Veto Counter |  |