| Param | Original file | Final file |
|---|---|---|
| Filename | modeM0/AS1C05_019T01_9000004332_30109cztM0_level2.evt | modeM0/AS1C05_019T01_9000004332_30109cztM0_level2_quad_clean.evt |
| Size (bytes) | 524,148,480 | 128,845,440 |
| Size | 499.9 MB | 122.9 MB |
| Events in quadrant A | 3,029,242 | 900,039 |
| Events in quadrant B | 4,772,565 | 896,909 |
| Events in quadrant C | 3,072,928 | 847,624 |
| Events in quadrant D | 4,578,779 | 824,959 |
| Mode M9 | |||
|---|---|---|---|
| Quadrant | BADHDUFLAG | Total packets | Discarded packets |
| A | 0 | 12 | 0 |
| B | 0 | 12 | 0 |
| C | 0 | 12 | 0 |
| D | 0 | 12 | 0 |
| Mode M0 | |||
|---|---|---|---|
| Quadrant | BADHDUFLAG | Total packets | Discarded packets |
| A | 0 | 12694 | 1 |
| B | 0 | 18624 | 1 |
| C | 0 | 12926 | 1 |
| D | 0 | 17420 | 1 |
| Mode SS | |||
|---|---|---|---|
| Quadrant | BADHDUFLAG | Total packets | Discarded packets |
| A | 0 | 128 | 0 |
| B | 0 | 128 | 0 |
| C | 0 | 128 | 0 |
| D | 0 | 128 | 0 |
| Quadrant | Total seconds | Saturated seconds | Saturation percentage |
|---|---|---|---|
| A | 6191 | 63 | 1.017606% |
| B | 6192 | 126 | 2.034884% |
| C | 6192 | 130 | 2.099483% |
| D | 6192 | 428 | 6.912145% |
Noise dominated data is calculated using 1-second bins in cleaned event files. If a bin has >2000 counts, and if more than 50% of those come from <1% of pixels, then it is considered to be noise-dominated and hence unusable.
| Quadrant | # 1 sec bins | Bins with >0 counts | Bins with >2000 counts | High rate bins dominated by noise | Noise dominated (total time) | Noise dominated (detector-on time) | Marked lightcurve |
|---|---|---|---|---|---|---|---|
| A | 7416 | 6192 | 1 | 1 | 0.01% | 0.02% | 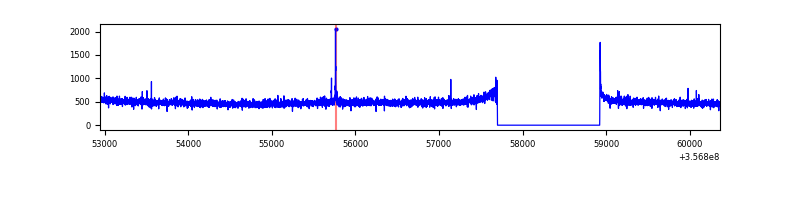 |
| B | 7417 | 6193 | 1 | 1 | 0.01% | 0.02% | 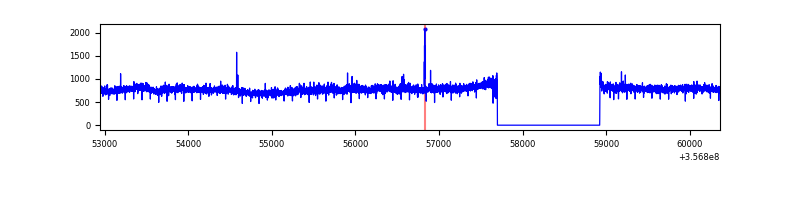 |
| C | 7417 | 6193 | 23 | 23 | 0.31% | 0.37% | 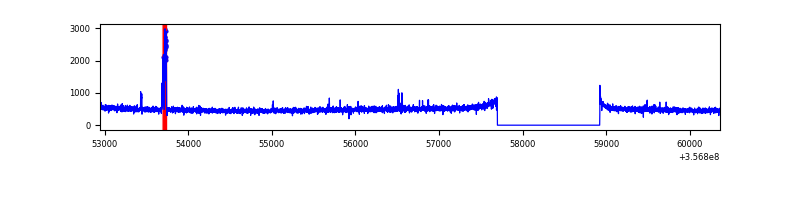 |
| D | 7417 | 6193 | 330 | 330 | 4.45% | 5.33% | 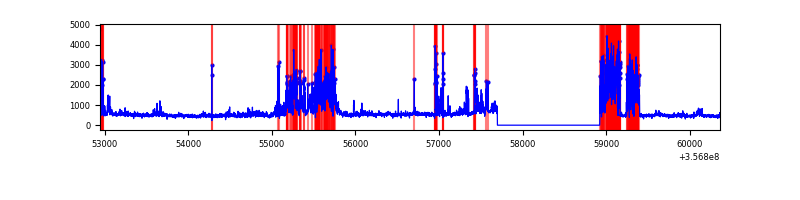 |
Top three noisy pixels from each quadrant. If the there are fewer than three noisy pixels in the level2.evt file, extra rows are filled as -1
| Pixel properties | Quadrant properties | ||||||
|---|---|---|---|---|---|---|---|
| Quadrant | DetID | PixID | Counts | Sigma | Mean | Median | Sigma |
| A | 14 | 238 | 16190 | 100.47 | 779 | 763 | 153.5 |
| A | 13 | 254 | 10667 | 64.5 | 779 | 763 | 153.5 |
| A | 8 | 192 | 9260 | 55.34 | 779 | 763 | 153.5 |
| B | 6 | 159 | 1733346 | 12094.97 | 768 | 750 | 143.2 |
| B | 0 | 190 | 29982 | 204.06 | 768 | 750 | 143.2 |
| B | 12 | 111 | 17174 | 114.65 | 768 | 750 | 143.2 |
| C | 14 | 238 | 130123 | 767.36 | 729 | 732 | 168.6 |
| C | 10 | 20 | 66978 | 392.88 | 729 | 732 | 168.6 |
| C | 2 | 114 | 13809 | 77.55 | 729 | 732 | 168.6 |
| D | 1 | 52 | 820139 | 4836.85 | 727 | 711 | 169.4 |
| D | 13 | 104 | 605673 | 3570.92 | 727 | 711 | 169.4 |
| D | 8 | 195 | 233046 | 1371.41 | 727 | 711 | 169.4 |
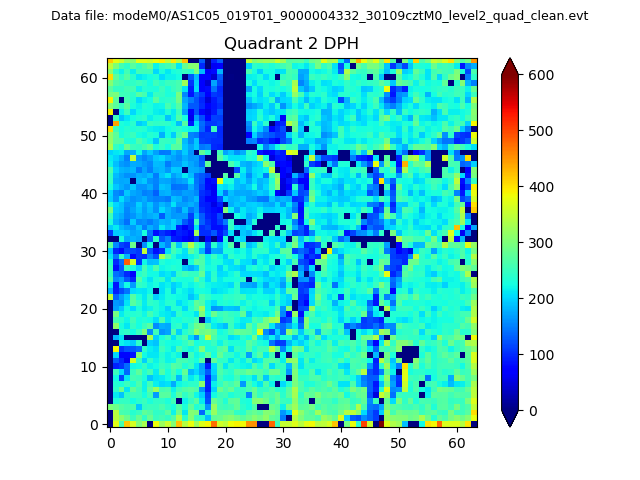
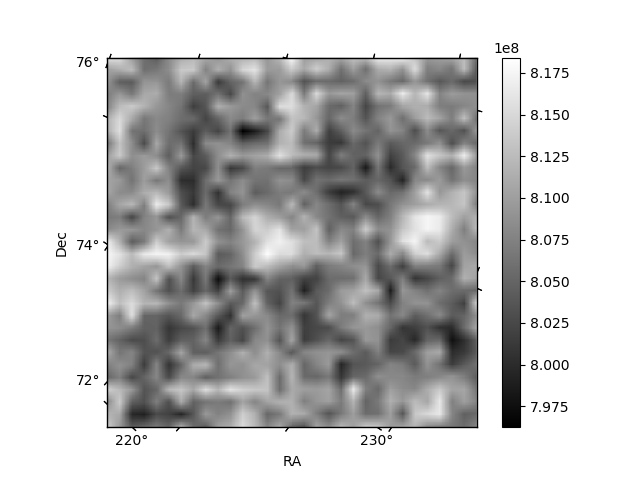
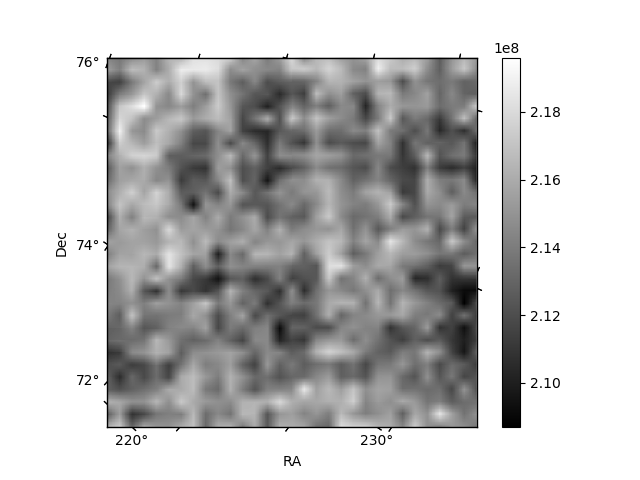
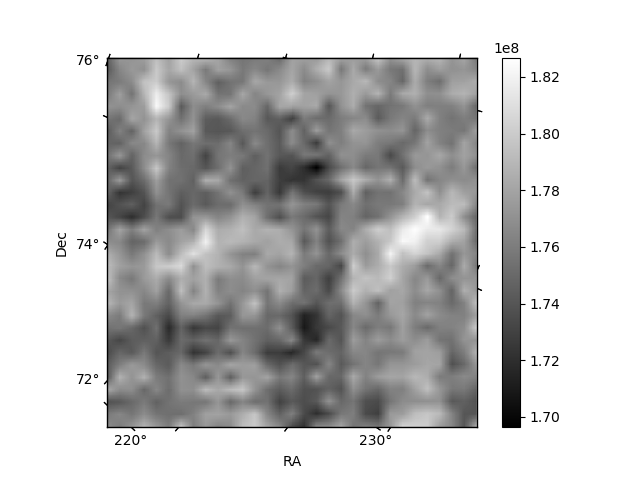
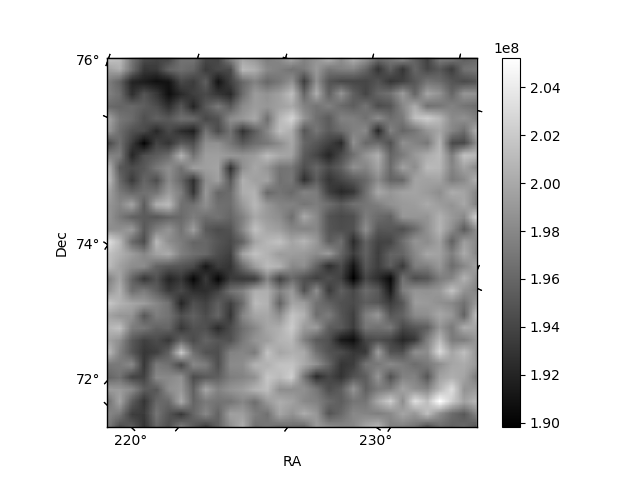
Histogram calculated using DETX and DETY for each event in the final _common_clean file
| Quadrant A | 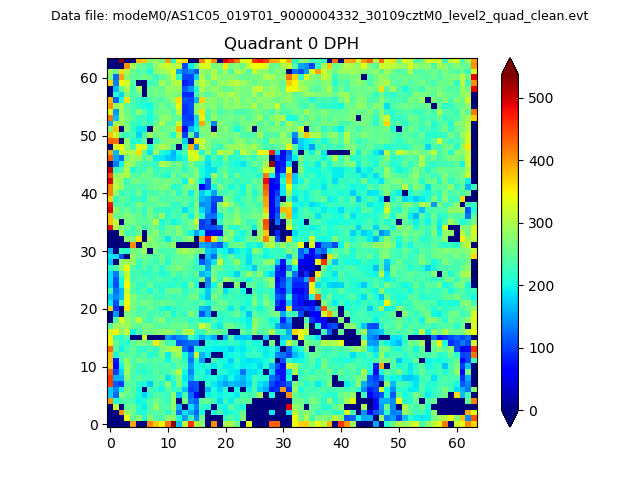 |
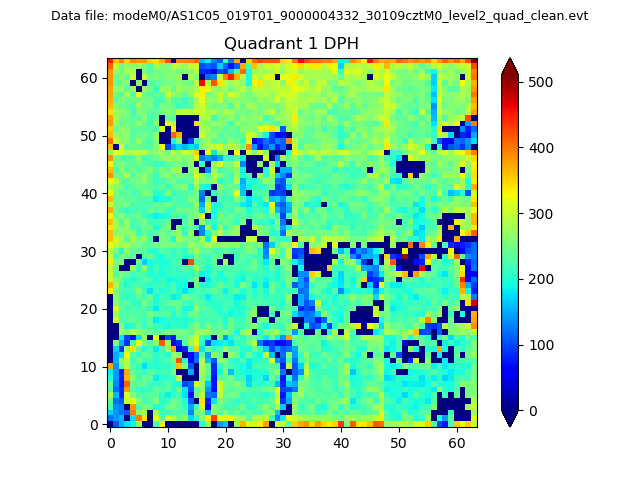 |
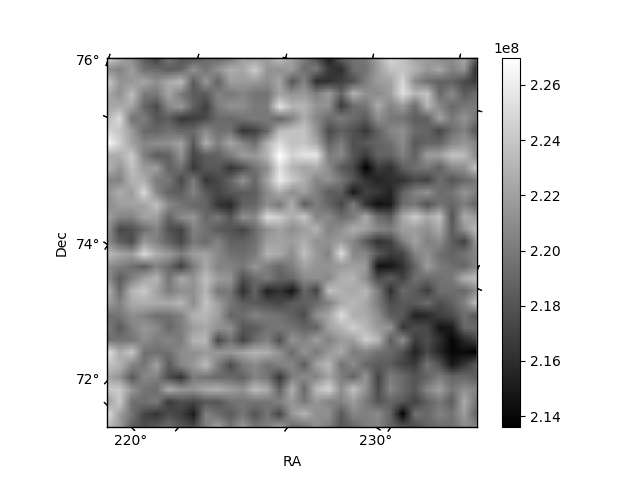
Quadrant B |
|---|---|---|---|
| Quadrant D | 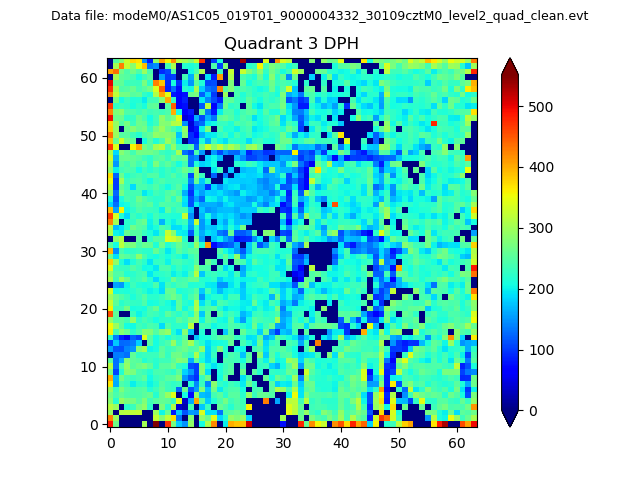 |
 |
Quadrant C |
| Plot type | Count rate plots | Images |
|---|---|---|
| Comparison with Poisson distribution Blue bars denote a histogram of data divided into 1 sec bins. Red curve is a Poisson curve with rate = median count rate of data. |
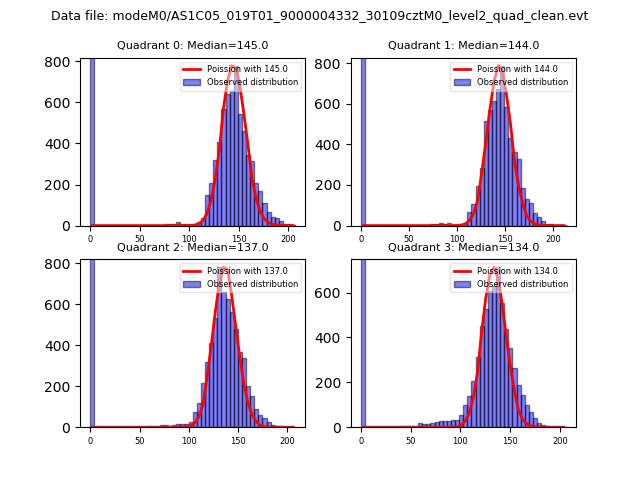 |
 |
| Quadrant-wise count rates Data is divided into 100 sec bins |
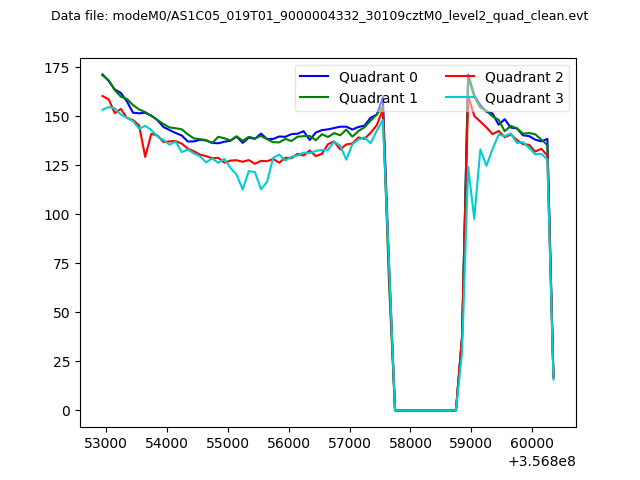 |
|
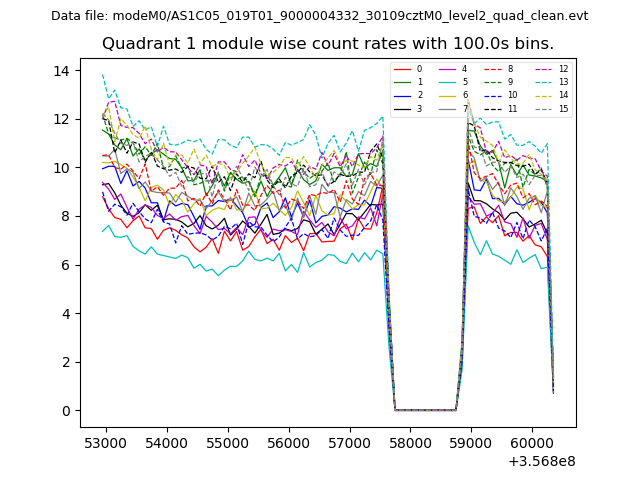
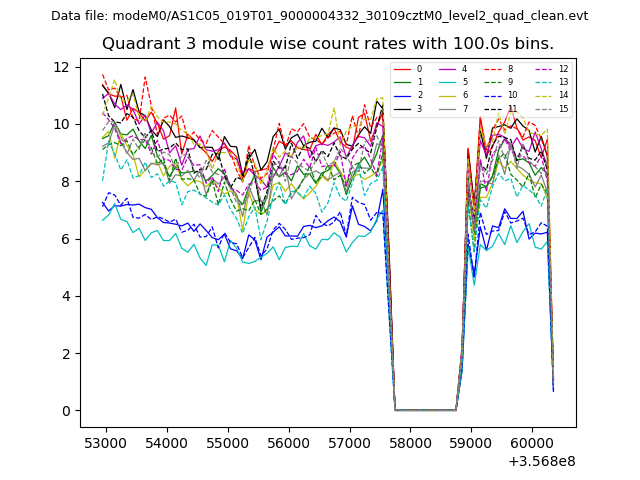
| Module-wise count rates for Quadrant A Data is divided into 100 sec bins |
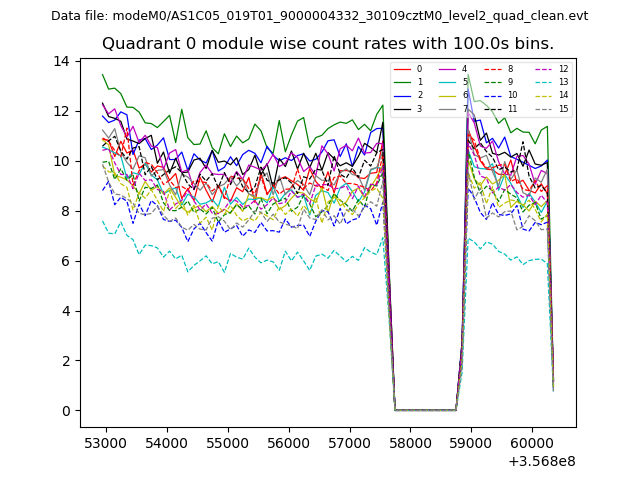 |
 |
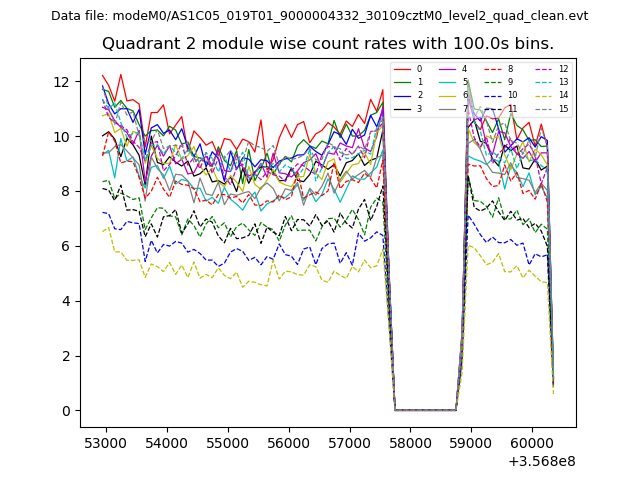
| Module-wise count rates for Quadrant B Data is divided into 100 sec bins |
 |
 |
| Module-wise count rates for Quadrant C Data is divided into 100 sec bins |
 |
 |
| Module-wise count rates for Quadrant D Data is divided into 100 sec bins |
 |
 |
| Parameter | Plot |
|---|---|
| CZT HV Monitor | 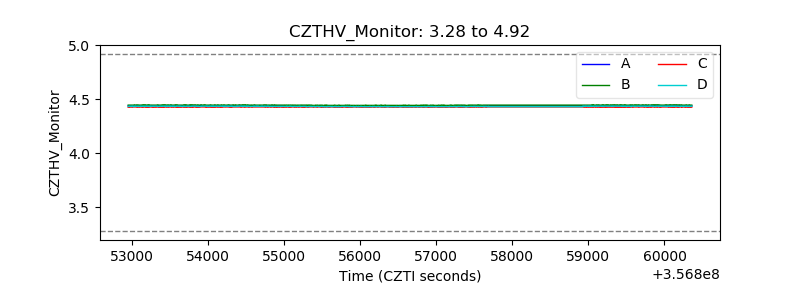 |
| D_VDD | 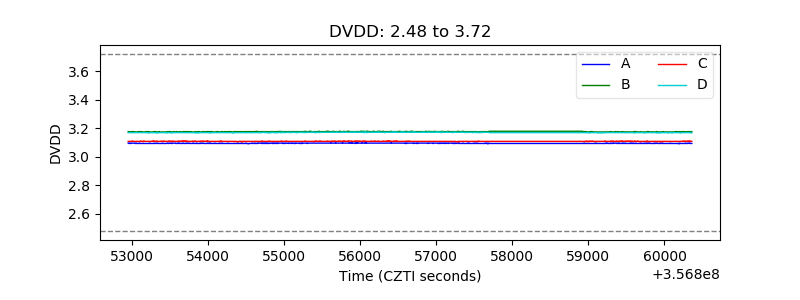 |
| Temperature 1 | 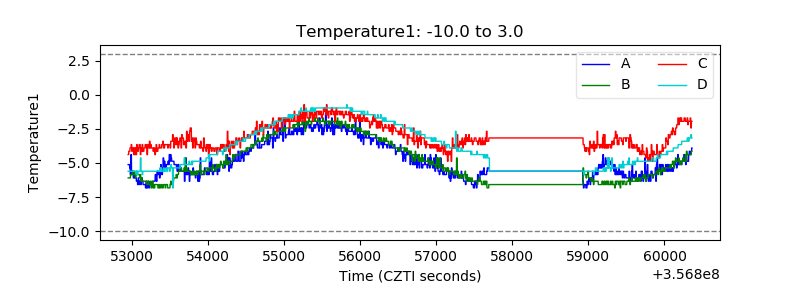 |
| Veto HV Monitor | 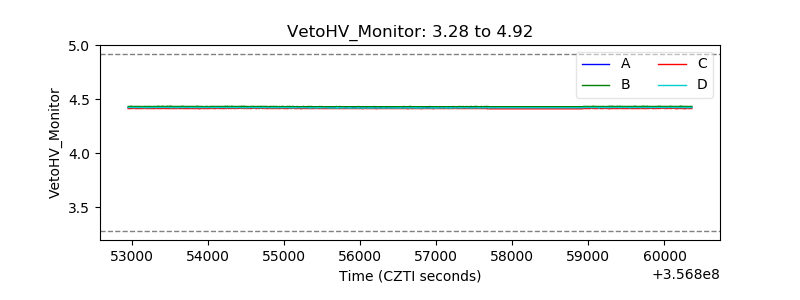 |
| Veto LLD | 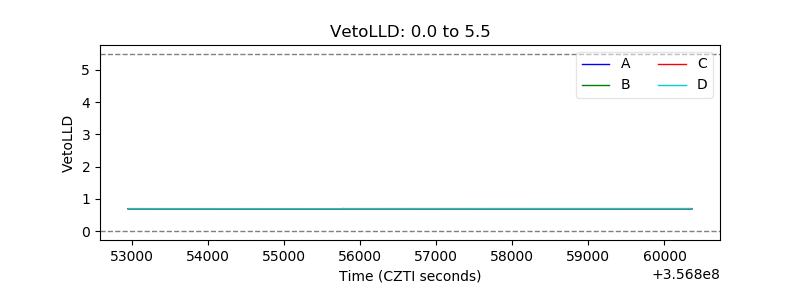 |
| Alpha Counter | 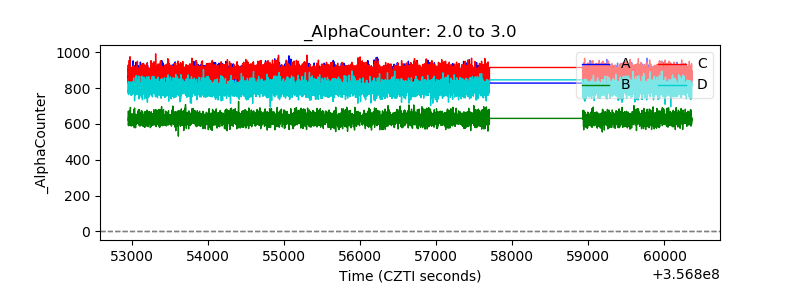 |
| _CPM_Rate | 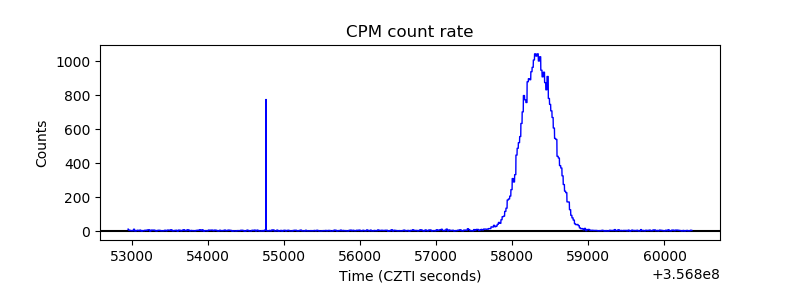 |
| CZT Counter | 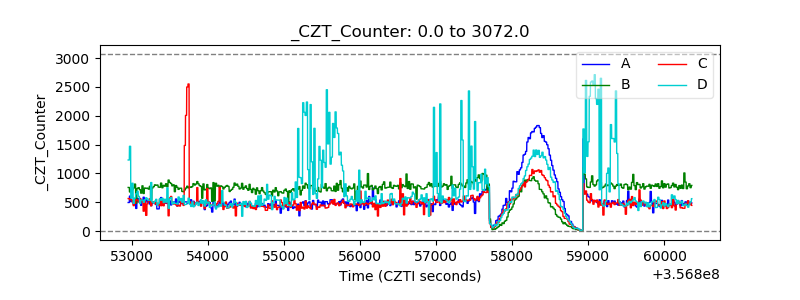 |
| +2.5 Volts monitor | 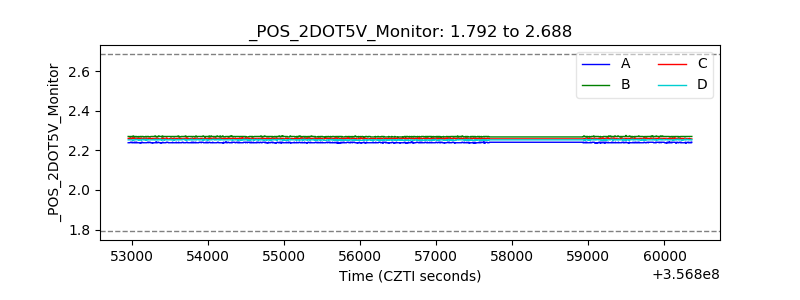 |
| +5 Volts monitor |  |
| _ROLL_ROT | 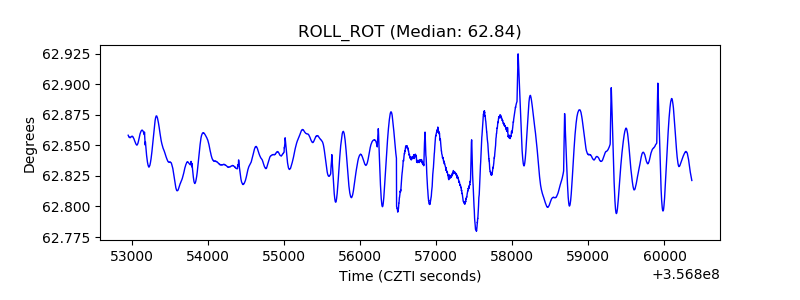 |
| _Roll_DEC | 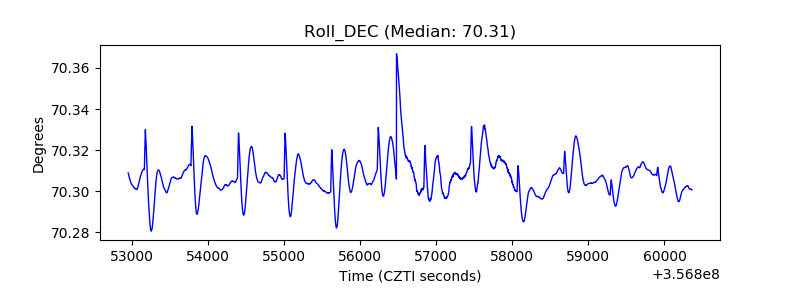 |
| _Roll_RA | 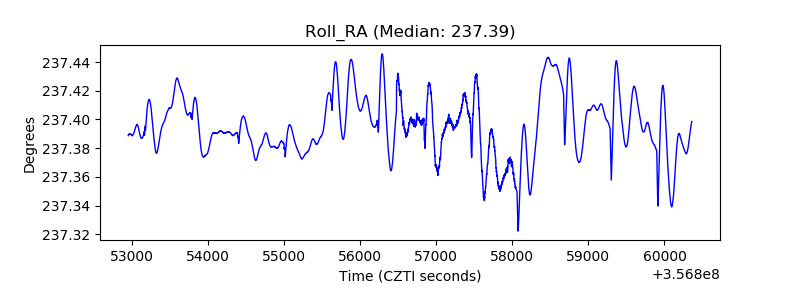 |
| Veto Counter | 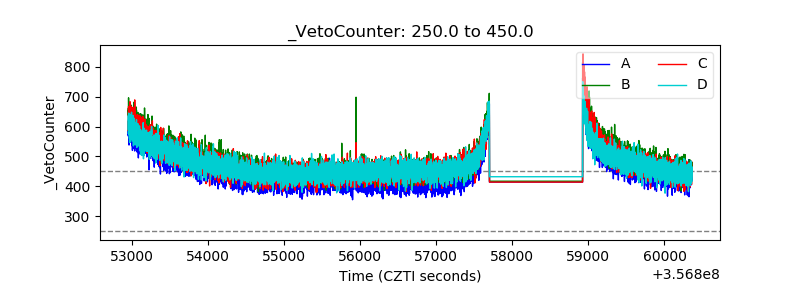 |