| Param | Original file | Final file |
|---|---|---|
| Filename | modeM0/AS1C05_019T01_9000004332_30110cztM0_level2.evt | modeM0/AS1C05_019T01_9000004332_30110cztM0_level2_quad_clean.evt |
| Size (bytes) | 487,592,640 | 121,296,960 |
| Size | 465.0 MB | 115.7 MB |
| Events in quadrant A | 2,892,715 | 834,941 |
| Events in quadrant B | 4,677,945 | 833,720 |
| Events in quadrant C | 2,915,046 | 793,639 |
| Events in quadrant D | 3,866,268 | 784,334 |
| Mode M9 | |||
|---|---|---|---|
| Quadrant | BADHDUFLAG | Total packets | Discarded packets |
| A | 0 | 9 | 0 |
| B | 0 | 9 | 0 |
| C | 0 | 9 | 0 |
| D | 0 | 9 | 0 |
| Mode M0 | |||
|---|---|---|---|
| Quadrant | BADHDUFLAG | Total packets | Discarded packets |
| A | 0 | 12483 | 1 |
| B | 0 | 18424 | 1 |
| C | 0 | 12530 | 1 |
| D | 0 | 15602 | 1 |
| Mode SS | |||
|---|---|---|---|
| Quadrant | BADHDUFLAG | Total packets | Discarded packets |
| A | 0 | 124 | 0 |
| B | 0 | 124 | 0 |
| C | 0 | 124 | 0 |
| D | 0 | 124 | 0 |
| Quadrant | Total seconds | Saturated seconds | Saturation percentage |
|---|---|---|---|
| A | 6110 | 93 | 1.522095% |
| B | 6111 | 158 | 2.585502% |
| C | 6111 | 136 | 2.225495% |
| D | 6111 | 100 | 1.636393% |
Noise dominated data is calculated using 1-second bins in cleaned event files. If a bin has >2000 counts, and if more than 50% of those come from <1% of pixels, then it is considered to be noise-dominated and hence unusable.
| Quadrant | # 1 sec bins | Bins with >0 counts | Bins with >2000 counts | High rate bins dominated by noise | Noise dominated (total time) | Noise dominated (detector-on time) | Marked lightcurve |
|---|---|---|---|---|---|---|---|
| A | 7100 | 6111 | 0 | 0 | 0.00% | 0.00% | 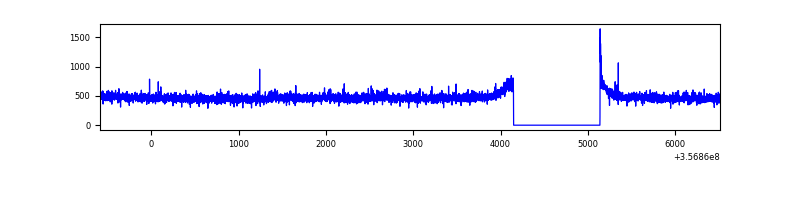 |
| B | 7101 | 6112 | 2 | 2 | 0.03% | 0.03% | 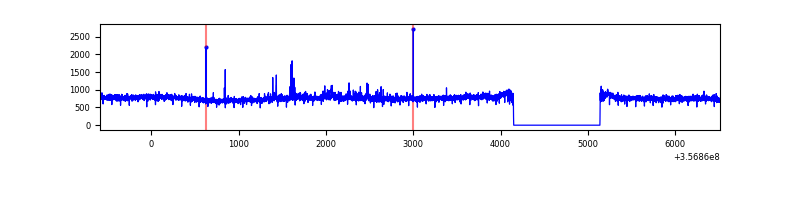 |
| C | 7101 | 6112 | 0 | 0 | 0.00% | 0.00% | 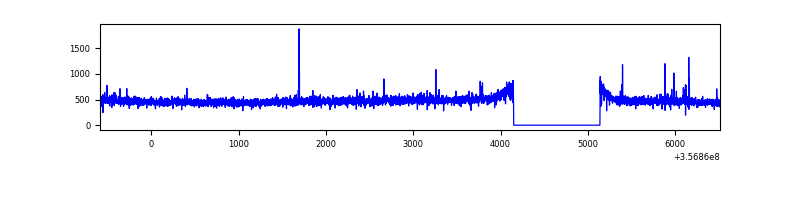 |
| D | 7101 | 6112 | 31 | 31 | 0.44% | 0.51% | 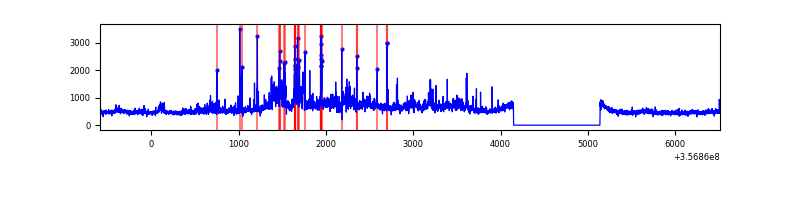 |
Top three noisy pixels from each quadrant. If the there are fewer than three noisy pixels in the level2.evt file, extra rows are filled as -1
| Pixel properties | Quadrant properties | ||||||
|---|---|---|---|---|---|---|---|
| Quadrant | DetID | PixID | Counts | Sigma | Mean | Median | Sigma |
| A | 13 | 254 | 10931 | 68.58 | 746 | 732 | 148.7 |
| A | 8 | 192 | 9412 | 58.37 | 746 | 732 | 148.7 |
| A | 3 | 137 | 7336 | 44.41 | 746 | 732 | 148.7 |
| B | 6 | 159 | 1725859 | 12355.43 | 734 | 717 | 139.6 |
| B | 0 | 190 | 58405 | 413.16 | 734 | 717 | 139.6 |
| B | 12 | 111 | 16953 | 116.28 | 734 | 717 | 139.6 |
| C | 14 | 238 | 124790 | 768.66 | 703 | 707 | 161.4 |
| C | 3 | 233 | 14582 | 85.95 | 703 | 707 | 161.4 |
| C | 2 | 114 | 13993 | 82.3 | 703 | 707 | 161.4 |
| D | 1 | 52 | 678330 | 4042.78 | 713 | 696 | 167.6 |
| D | 8 | 195 | 240662 | 1431.64 | 713 | 696 | 167.6 |
| D | 13 | 104 | 152614 | 906.35 | 713 | 696 | 167.6 |
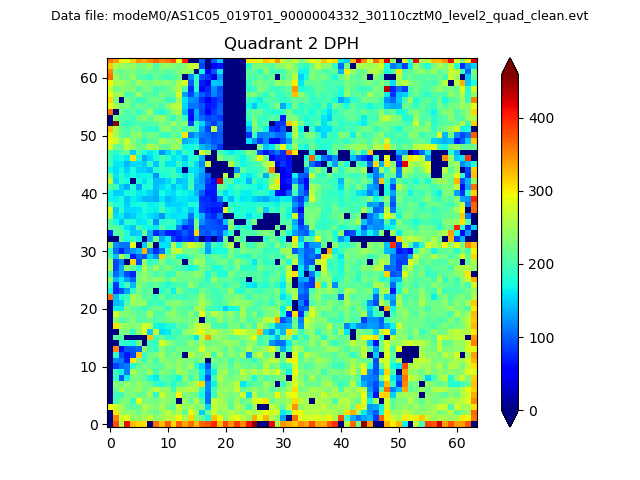
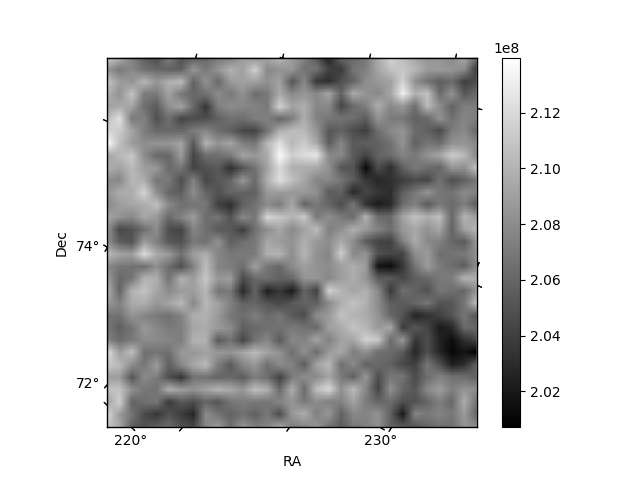
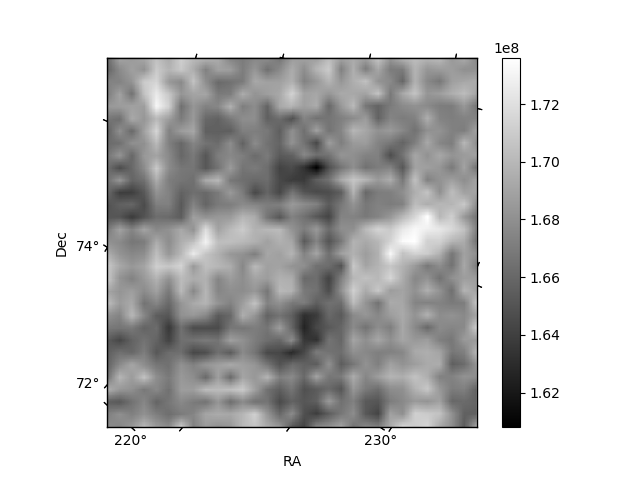
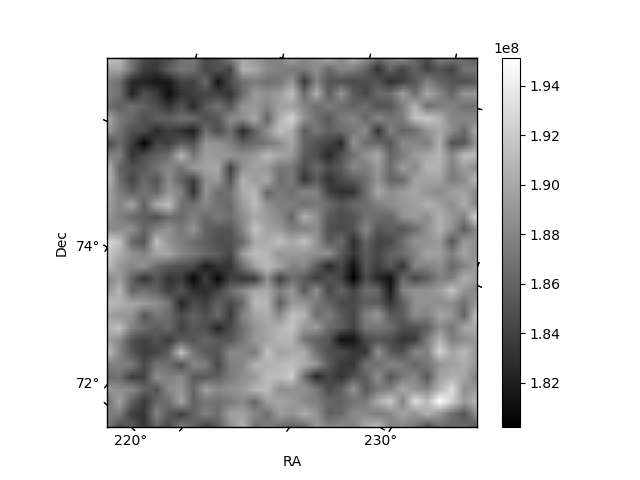
Histogram calculated using DETX and DETY for each event in the final _common_clean file
| Quadrant A | 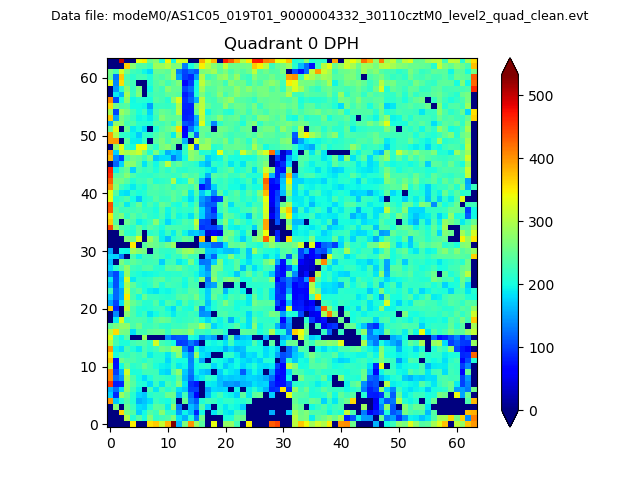 |
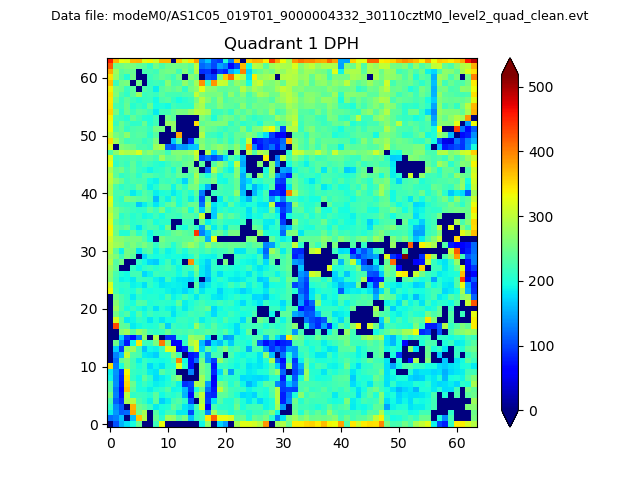 |
Quadrant B |
|---|---|---|---|
| Quadrant D | 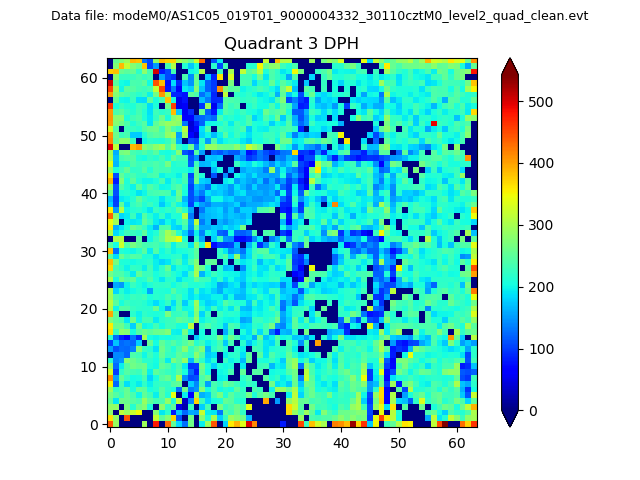 |
 |
Quadrant C |
| Plot type | Count rate plots | Images |
|---|---|---|
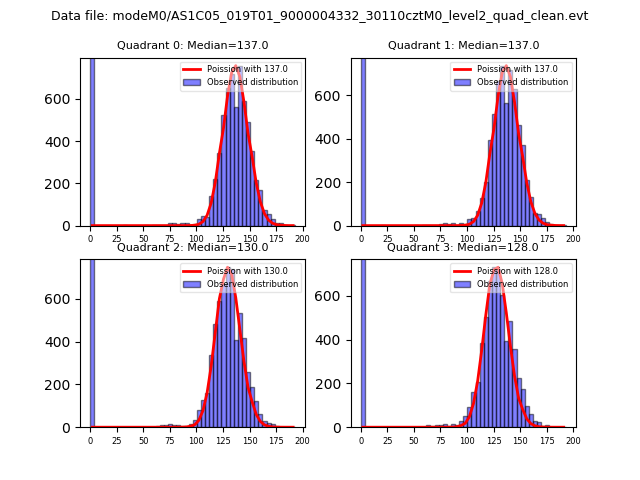
| Comparison with Poisson distribution Blue bars denote a histogram of data divided into 1 sec bins. Red curve is a Poisson curve with rate = median count rate of data. |
 |
 |
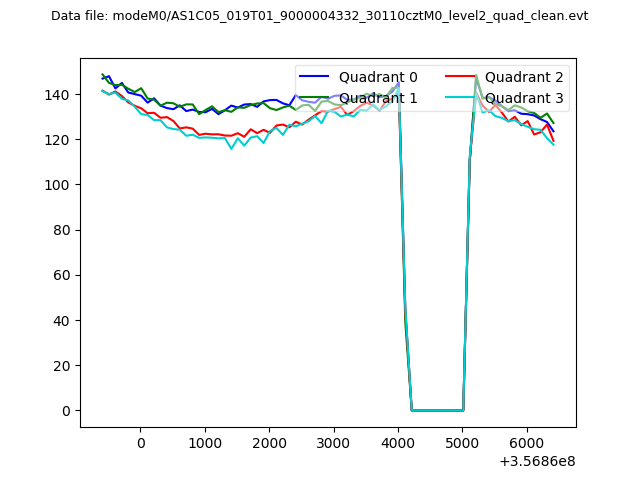
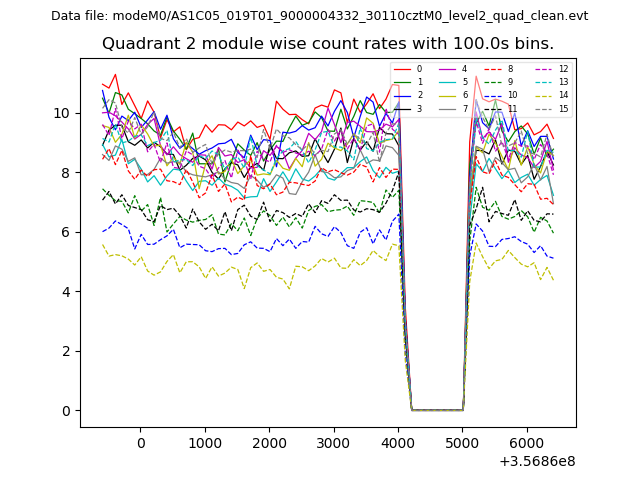
| Quadrant-wise count rates Data is divided into 100 sec bins |
 |
|
| Module-wise count rates for Quadrant A Data is divided into 100 sec bins |
 |
 |
| Module-wise count rates for Quadrant B Data is divided into 100 sec bins |
 |
 |
| Module-wise count rates for Quadrant C Data is divided into 100 sec bins |
 |
 |
| Module-wise count rates for Quadrant D Data is divided into 100 sec bins |
 |
 |
| Parameter | Plot |
|---|---|
| CZT HV Monitor |  |
| D_VDD | 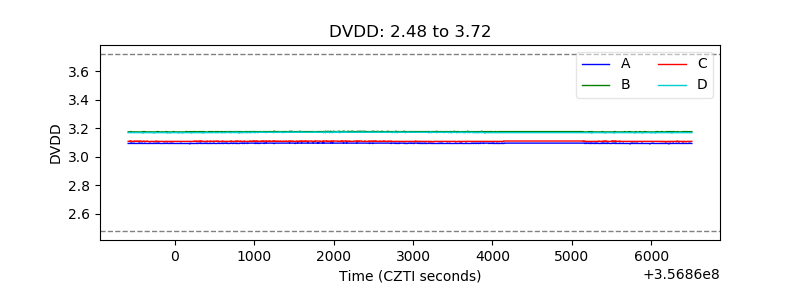 |
| Temperature 1 |  |
| Veto HV Monitor | 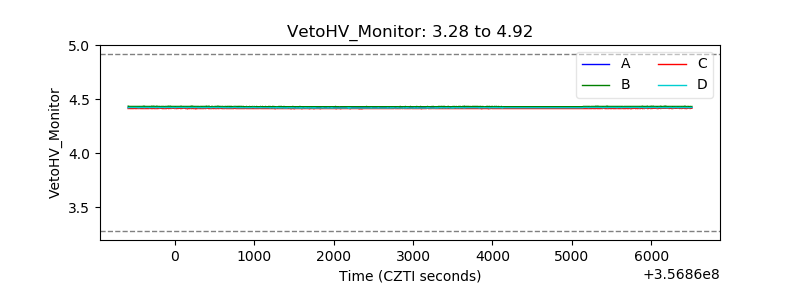 |
| Veto LLD |  |
| Alpha Counter | 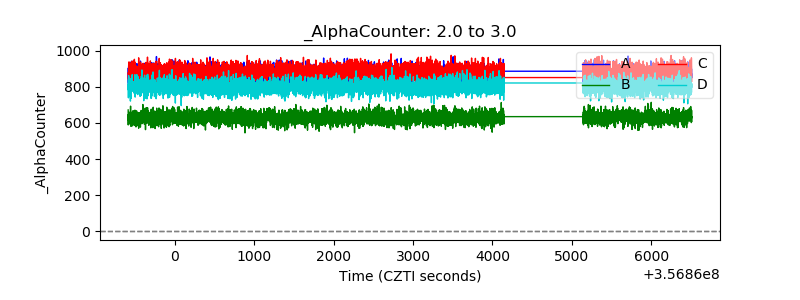 |
| _CPM_Rate | 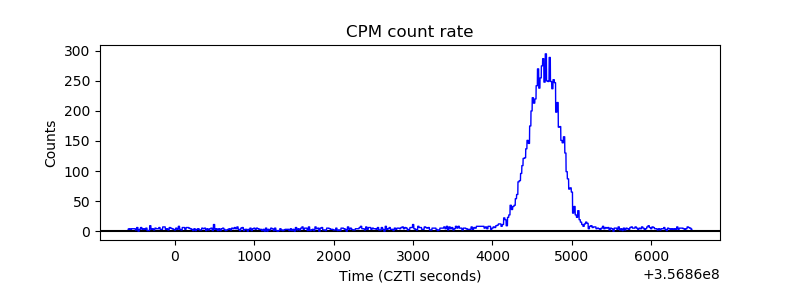 |
| CZT Counter | 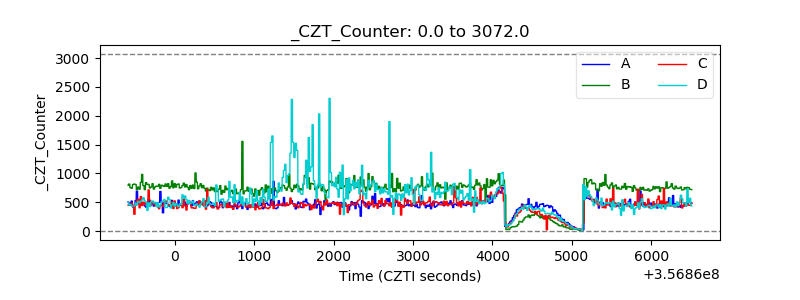 |
| +2.5 Volts monitor |  |
| +5 Volts monitor |  |
| _ROLL_ROT | 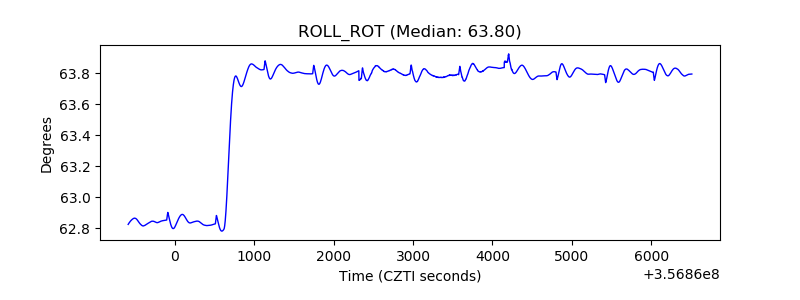 |
| _Roll_DEC | 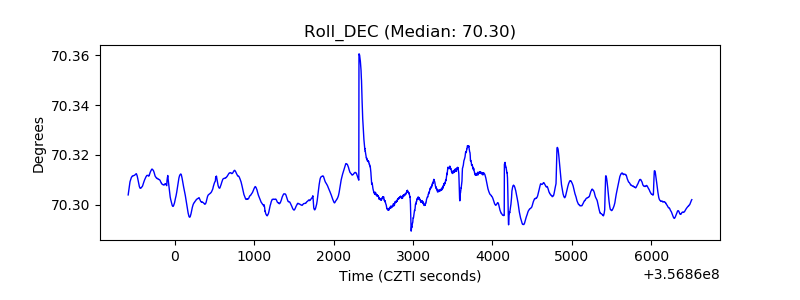 |
| _Roll_RA | 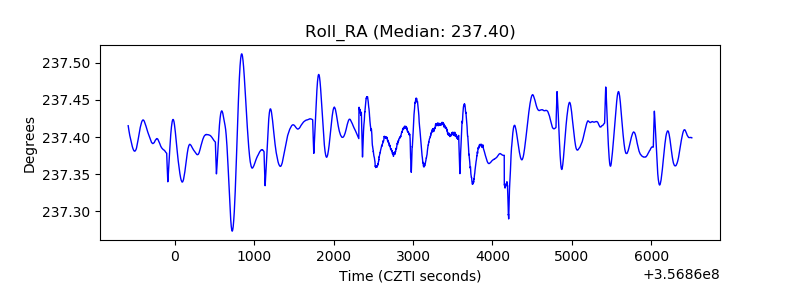 |
| Veto Counter | 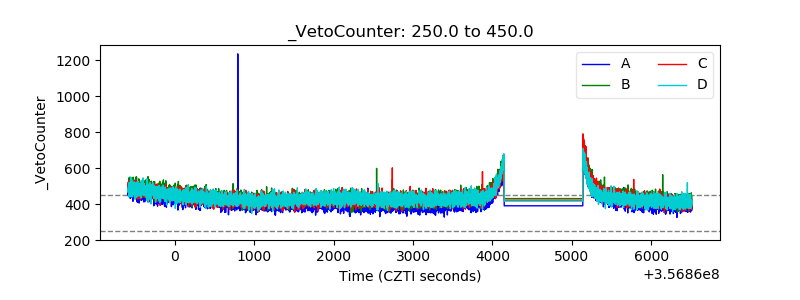 |