| Param | Original file | Final file |
|---|---|---|
| Filename | modeM0/AS1C05_019T01_9000004332_30111cztM0_level2.evt | modeM0/AS1C05_019T01_9000004332_30111cztM0_level2_quad_clean.evt |
| Size (bytes) | 533,139,840 | 131,644,800 |
| Size | 508.4 MB | 125.5 MB |
| Events in quadrant A | 3,194,575 | 902,000 |
| Events in quadrant B | 5,169,057 | 901,715 |
| Events in quadrant C | 3,588,319 | 846,760 |
| Events in quadrant D | 3,724,640 | 854,473 |
| Mode M9 | |||
|---|---|---|---|
| Quadrant | BADHDUFLAG | Total packets | Discarded packets |
| A | 0 | 6 | 0 |
| B | 0 | 6 | 0 |
| C | 0 | 6 | 0 |
| D | 0 | 6 | 0 |
| Mode M0 | |||
|---|---|---|---|
| Quadrant | BADHDUFLAG | Total packets | Discarded packets |
| A | 0 | 14106 | 2 |
| B | 0 | 20832 | 1 |
| C | 0 | 15221 | 1 |
| D | 0 | 15228 | 1 |
| Mode SS | |||
|---|---|---|---|
| Quadrant | BADHDUFLAG | Total packets | Discarded packets |
| A | 0 | 140 | 0 |
| B | 0 | 140 | 0 |
| C | 0 | 140 | 0 |
| D | 0 | 140 | 0 |
| Quadrant | Total seconds | Saturated seconds | Saturation percentage |
|---|---|---|---|
| A | 6922 | 100 | 1.444669% |
| B | 6923 | 164 | 2.368915% |
| C | 6923 | 406 | 5.864510% |
| D | 6923 | 89 | 1.285570% |
Noise dominated data is calculated using 1-second bins in cleaned event files. If a bin has >2000 counts, and if more than 50% of those come from <1% of pixels, then it is considered to be noise-dominated and hence unusable.
| Quadrant | # 1 sec bins | Bins with >0 counts | Bins with >2000 counts | High rate bins dominated by noise | Noise dominated (total time) | Noise dominated (detector-on time) | Marked lightcurve |
|---|---|---|---|---|---|---|---|
| A | 7527 | 6923 | 0 | 0 | 0.00% | 0.00% | 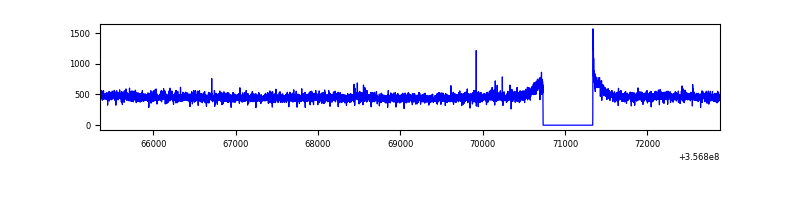 |
| B | 7528 | 6924 | 0 | 0 | 0.00% | 0.00% | 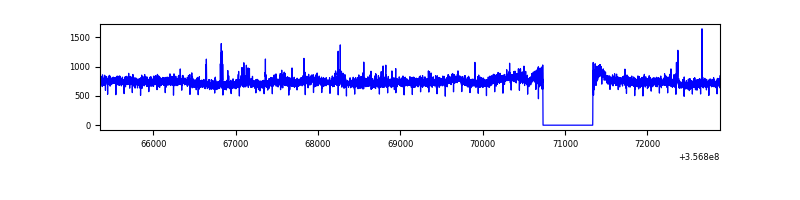 |
| C | 7528 | 6924 | 32 | 32 | 0.43% | 0.46% | 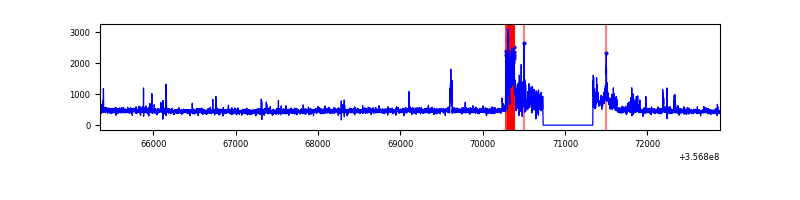 |
| D | 7528 | 6924 | 11 | 11 | 0.15% | 0.16% | 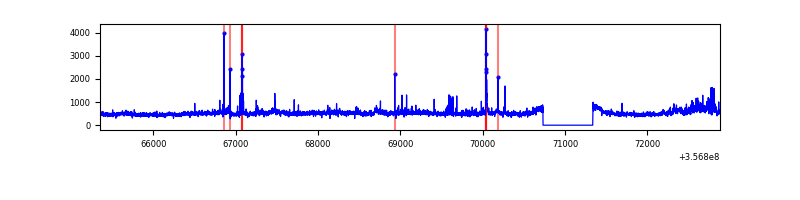 |
Top three noisy pixels from each quadrant. If the there are fewer than three noisy pixels in the level2.evt file, extra rows are filled as -1
| Pixel properties | Quadrant properties | ||||||
|---|---|---|---|---|---|---|---|
| Quadrant | DetID | PixID | Counts | Sigma | Mean | Median | Sigma |
| A | 13 | 254 | 12811 | 73.07 | 824 | 807 | 164.3 |
| A | 8 | 192 | 9585 | 53.43 | 824 | 807 | 164.3 |
| A | 3 | 137 | 8143 | 44.65 | 824 | 807 | 164.3 |
| B | 6 | 159 | 1916958 | 12295.77 | 812 | 791 | 155.8 |
| B | 0 | 190 | 53803 | 340.17 | 812 | 791 | 155.8 |
| B | 12 | 111 | 19067 | 117.27 | 812 | 791 | 155.8 |
| C | 3 | 233 | 313741 | 1774.19 | 764 | 767 | 176.4 |
| C | 14 | 238 | 188671 | 1065.19 | 764 | 767 | 176.4 |
| C | 14 | 254 | 86274 | 484.72 | 764 | 767 | 176.4 |
| D | 8 | 195 | 299458 | 1603.09 | 789 | 770 | 186.3 |
| D | 1 | 52 | 142462 | 760.48 | 789 | 770 | 186.3 |
| D | 12 | 227 | 131573 | 702.03 | 789 | 770 | 186.3 |
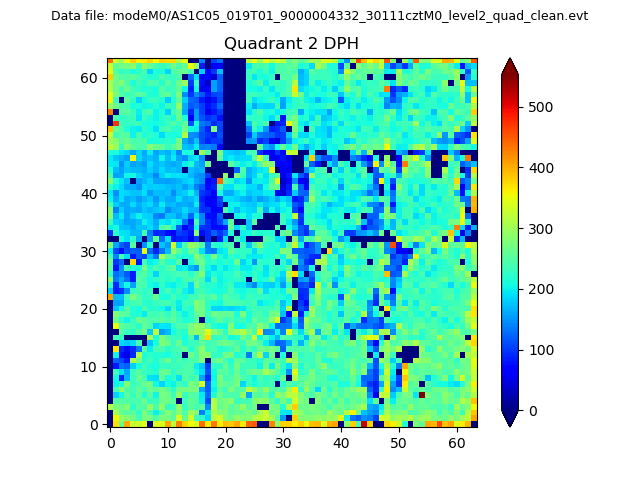
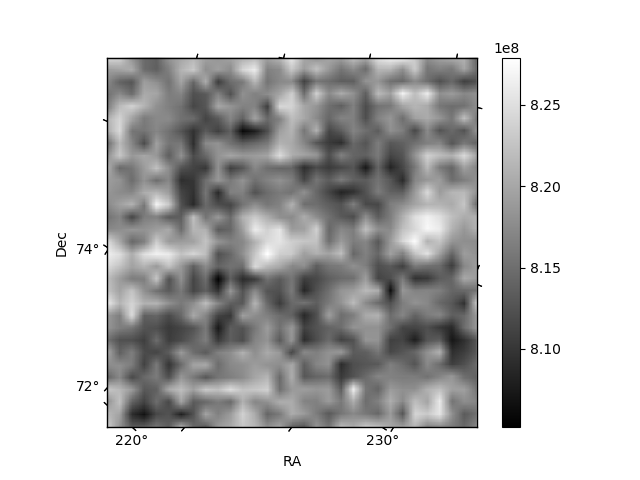
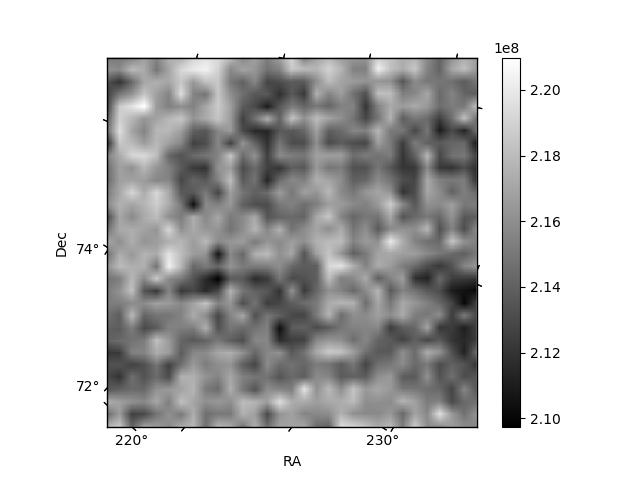
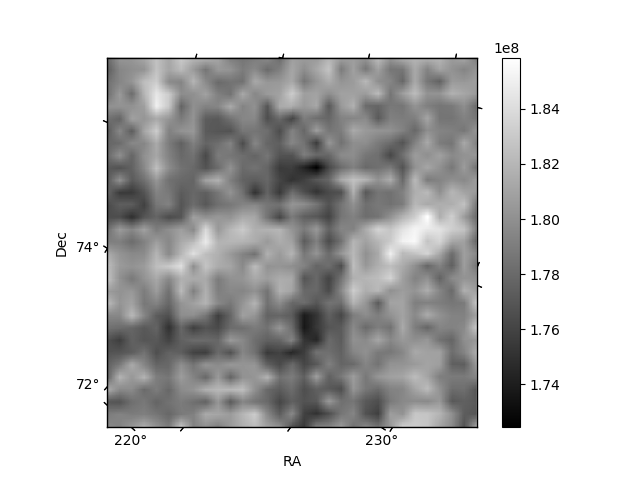
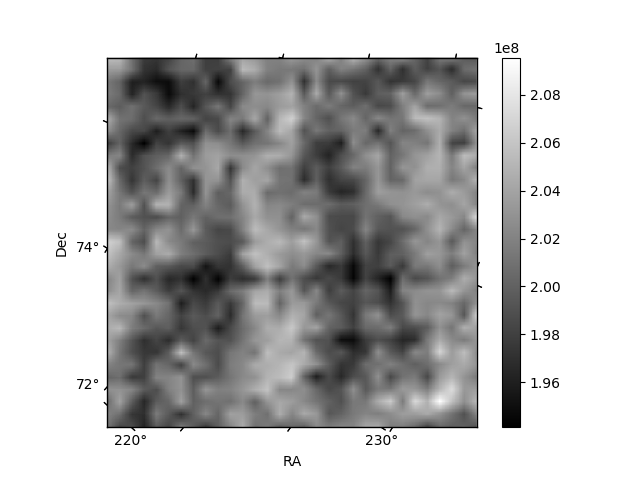
Histogram calculated using DETX and DETY for each event in the final _common_clean file
| Quadrant A | 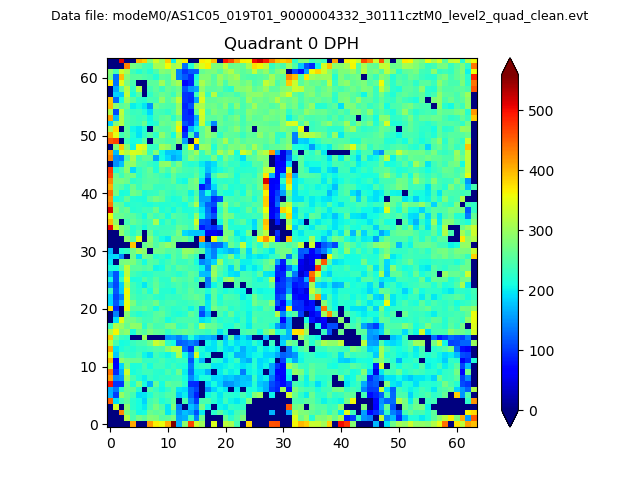 |
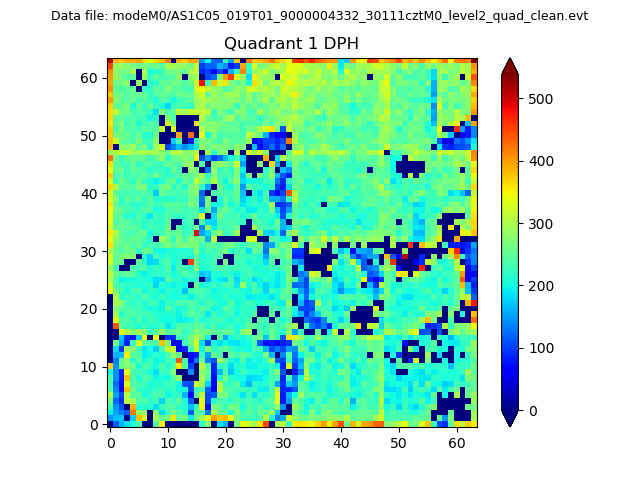 |
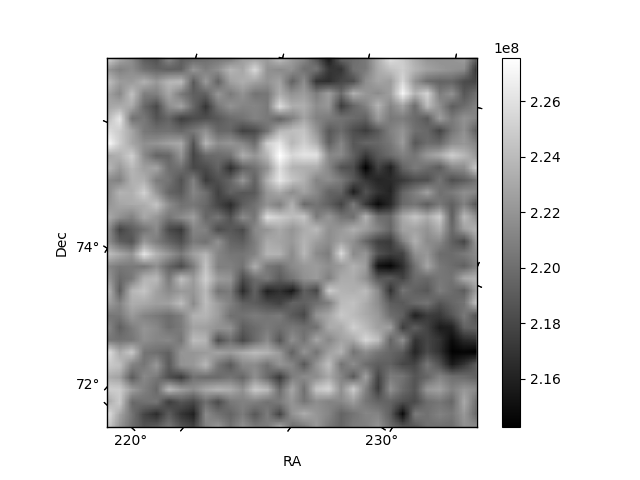
Quadrant B |
|---|---|---|---|
| Quadrant D | 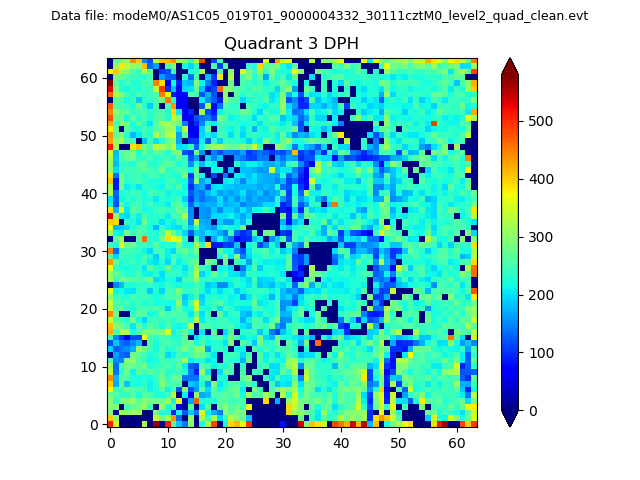 |
 |
Quadrant C |
| Plot type | Count rate plots | Images |
|---|---|---|
| Comparison with Poisson distribution Blue bars denote a histogram of data divided into 1 sec bins. Red curve is a Poisson curve with rate = median count rate of data. |
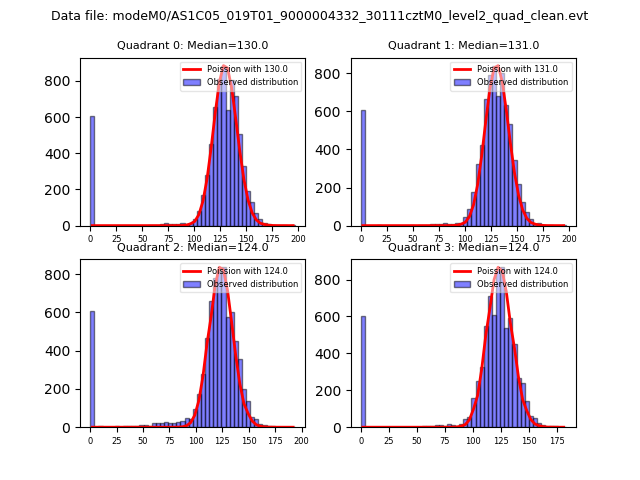 |
 |
| Quadrant-wise count rates Data is divided into 100 sec bins |
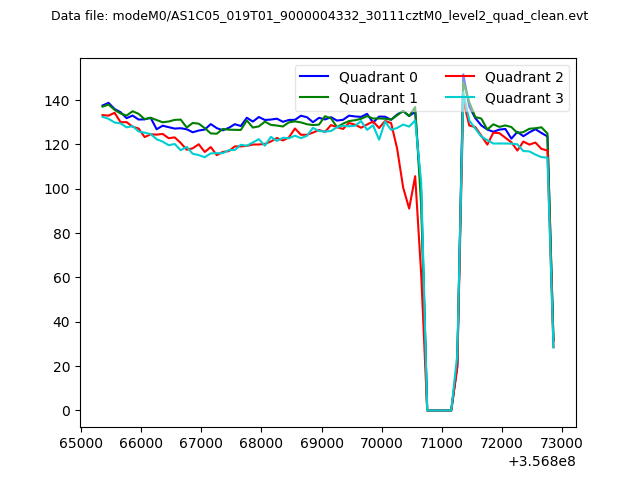 |
|
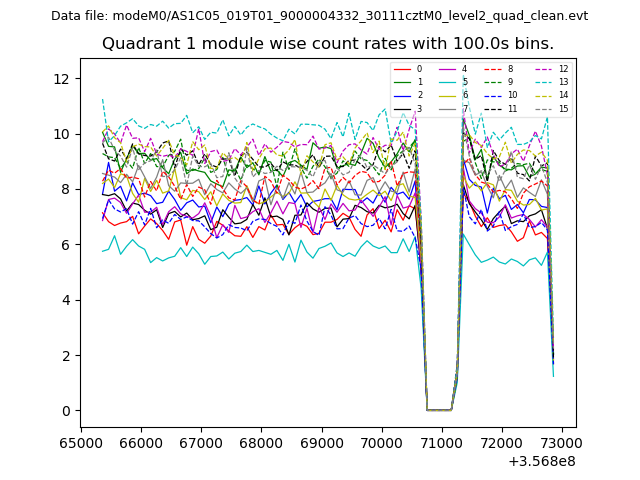
| Module-wise count rates for Quadrant A Data is divided into 100 sec bins |
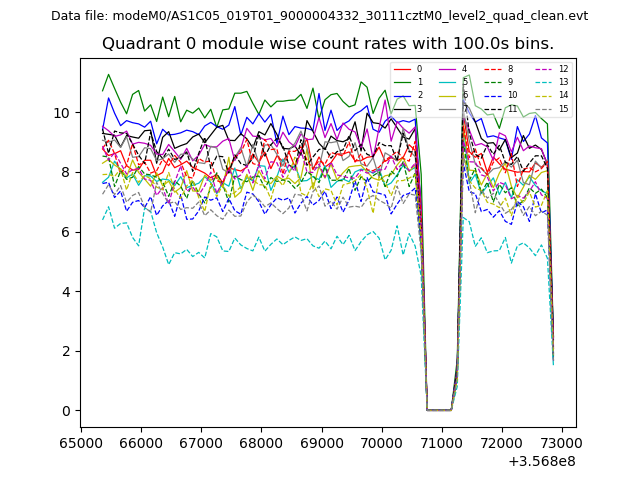 |
 |
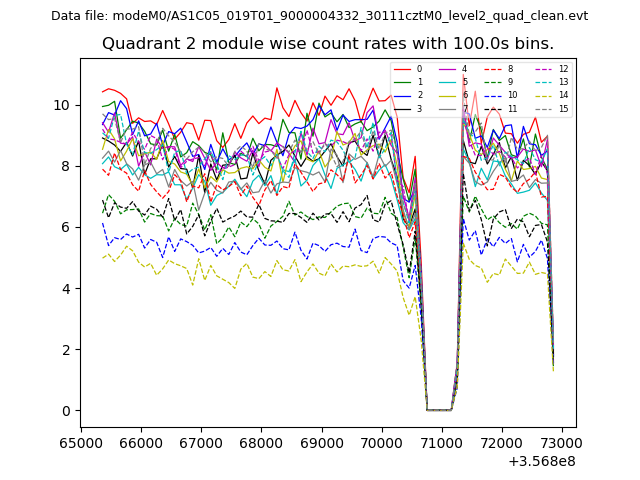
| Module-wise count rates for Quadrant B Data is divided into 100 sec bins |
 |
 |
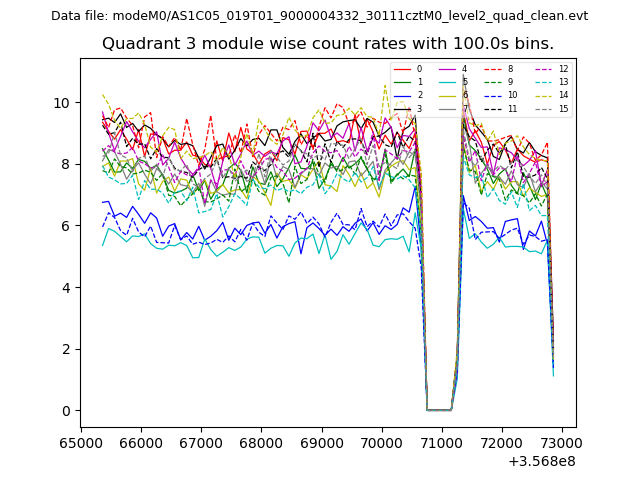
| Module-wise count rates for Quadrant C Data is divided into 100 sec bins |
 |
 |
| Module-wise count rates for Quadrant D Data is divided into 100 sec bins |
 |
 |
| Parameter | Plot |
|---|---|
| CZT HV Monitor | 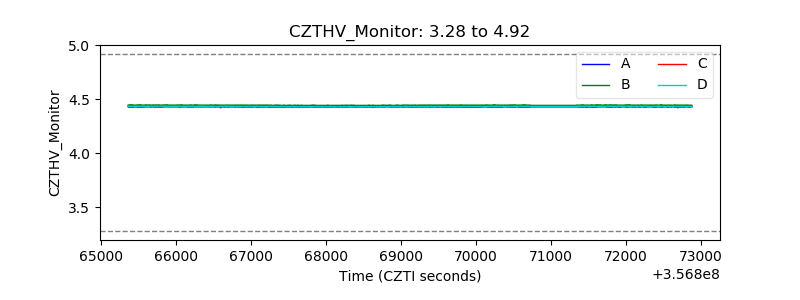 |
| D_VDD | 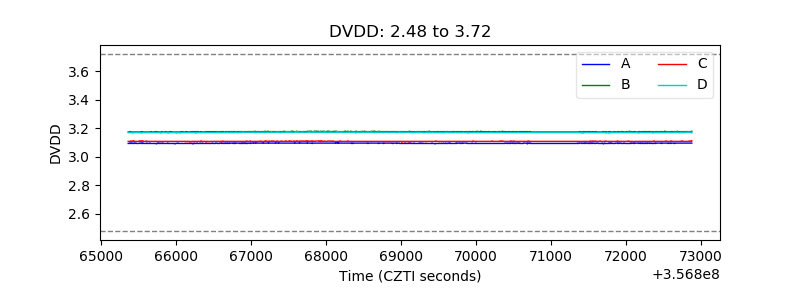 |
| Temperature 1 | 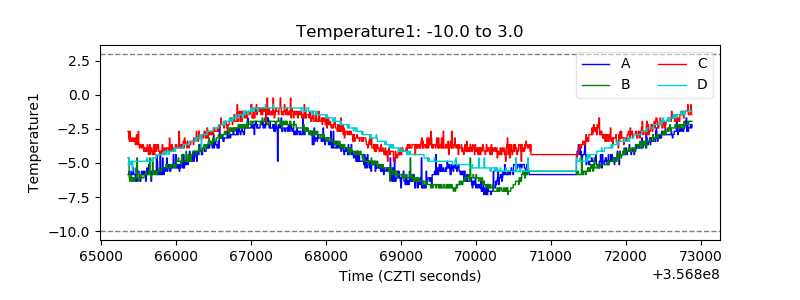 |
| Veto HV Monitor | 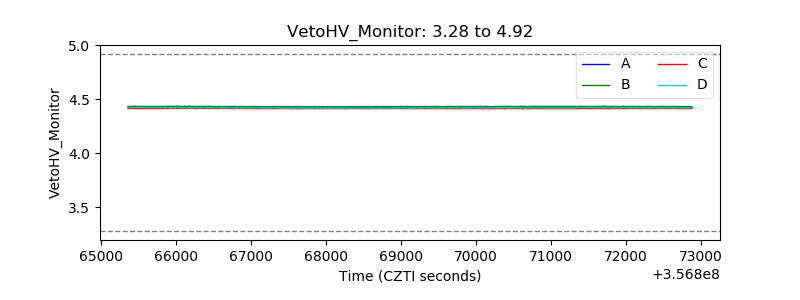 |
| Veto LLD | 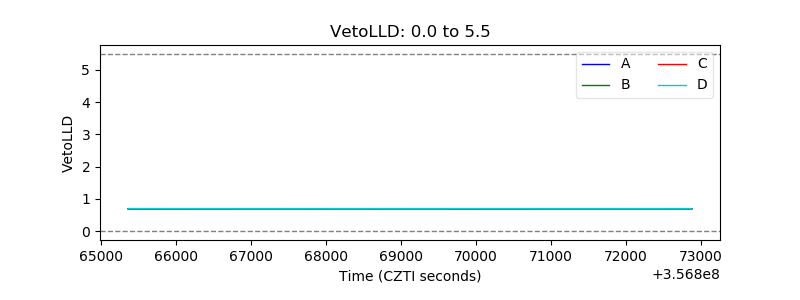 |
| Alpha Counter | 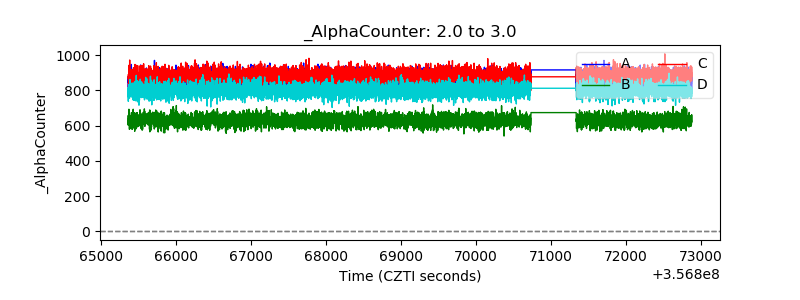 |
| _CPM_Rate | 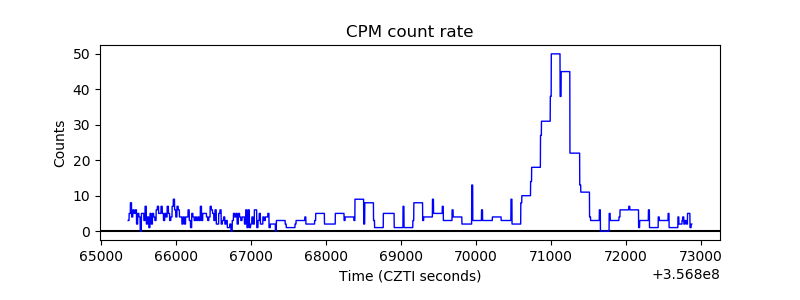 |
| CZT Counter | 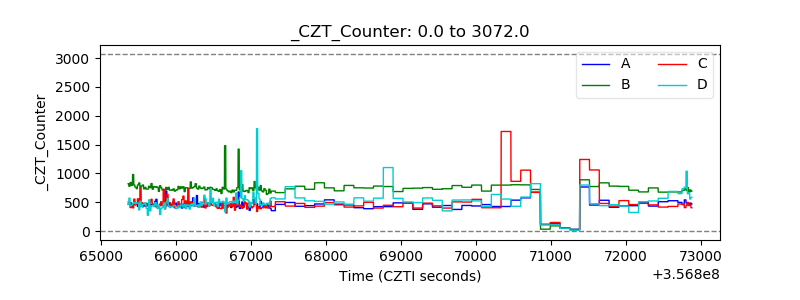 |
| +2.5 Volts monitor |  |
| +5 Volts monitor |  |
| _ROLL_ROT | 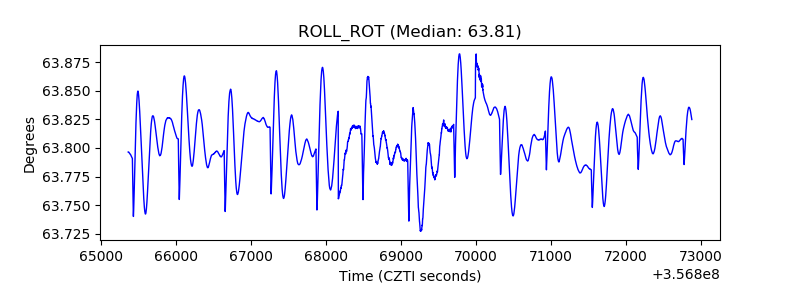 |
| _Roll_DEC | 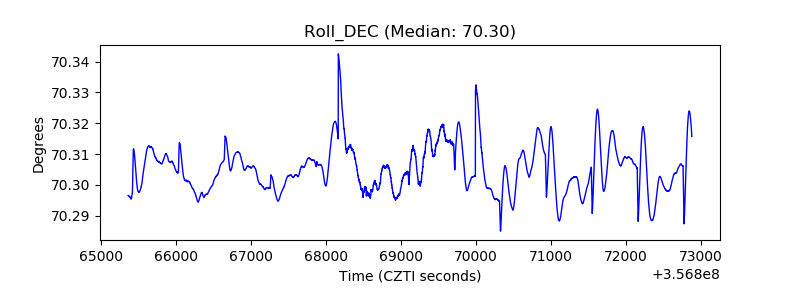 |
| _Roll_RA | 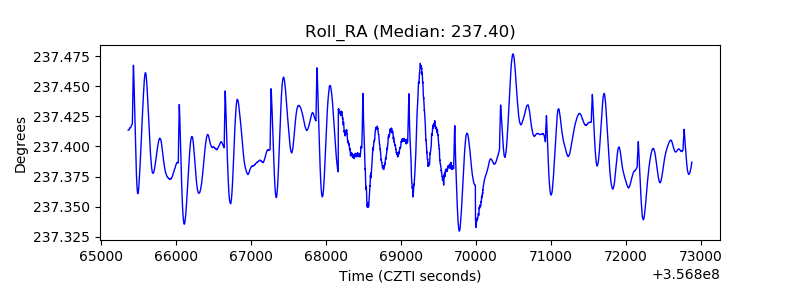 |
| Veto Counter | 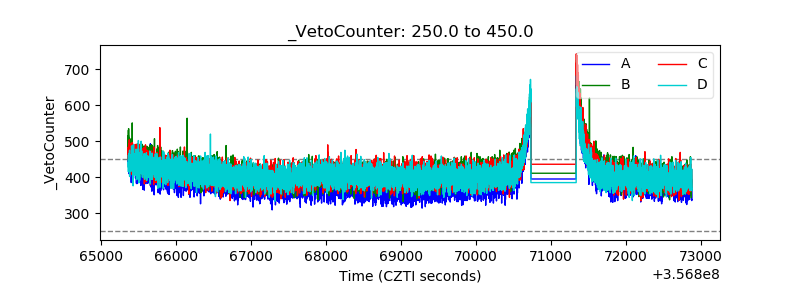 |