| Param | Original file | Final file |
|---|---|---|
| Filename | modeM0/AS1C05_019T01_9000004332_30112cztM0_level2.evt | modeM0/AS1C05_019T01_9000004332_30112cztM0_level2_quad_clean.evt |
| Size (bytes) | 559,347,840 | 131,696,640 |
| Size | 533.4 MB | 125.6 MB |
| Events in quadrant A | 3,267,946 | 899,052 |
| Events in quadrant B | 5,256,494 | 897,647 |
| Events in quadrant C | 3,357,268 | 856,780 |
| Events in quadrant D | 4,579,653 | 843,568 |
| Mode M9 | |||
|---|---|---|---|
| Quadrant | BADHDUFLAG | Total packets | Discarded packets |
| A | 0 | 3 | 0 |
| B | 0 | 3 | 0 |
| C | 0 | 3 | 0 |
| D | 0 | 3 | 0 |
| Mode M0 | |||
|---|---|---|---|
| Quadrant | BADHDUFLAG | Total packets | Discarded packets |
| A | 0 | 14465 | 1 |
| B | 0 | 21260 | 2 |
| C | 0 | 14543 | 1 |
| D | 0 | 18368 | 1 |
| Mode SS | |||
|---|---|---|---|
| Quadrant | BADHDUFLAG | Total packets | Discarded packets |
| A | 0 | 142 | 0 |
| B | 0 | 142 | 0 |
| C | 0 | 142 | 0 |
| D | 0 | 142 | 0 |
| Quadrant | Total seconds | Saturated seconds | Saturation percentage |
|---|---|---|---|
| A | 7066 | 70 | 0.990659% |
| B | 7065 | 169 | 2.392074% |
| C | 7066 | 158 | 2.236060% |
| D | 7066 | 52 | 0.735918% |
Noise dominated data is calculated using 1-second bins in cleaned event files. If a bin has >2000 counts, and if more than 50% of those come from <1% of pixels, then it is considered to be noise-dominated and hence unusable.
| Quadrant | # 1 sec bins | Bins with >0 counts | Bins with >2000 counts | High rate bins dominated by noise | Noise dominated (total time) | Noise dominated (detector-on time) | Marked lightcurve |
|---|---|---|---|---|---|---|---|
| A | 7306 | 7067 | 2 | 2 | 0.03% | 0.03% | 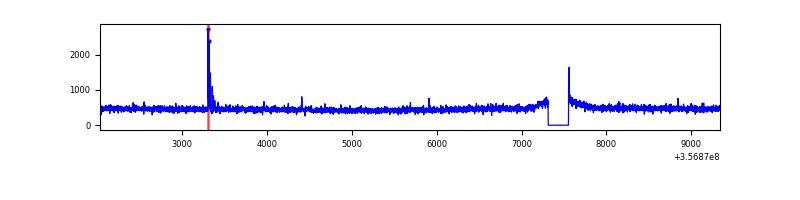 |
| B | 7305 | 7066 | 1 | 1 | 0.01% | 0.01% | 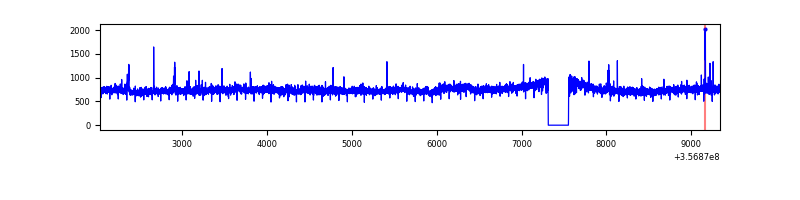 |
| C | 7306 | 7067 | 0 | 0 | 0.00% | 0.00% | 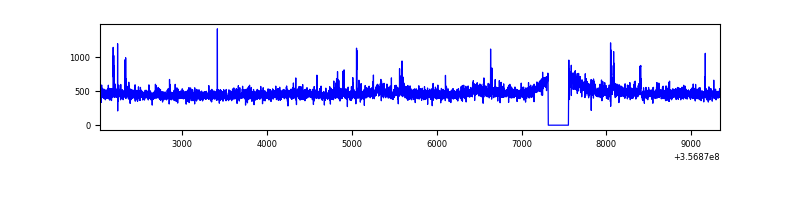 |
| D | 7306 | 7067 | 6 | 6 | 0.08% | 0.08% | 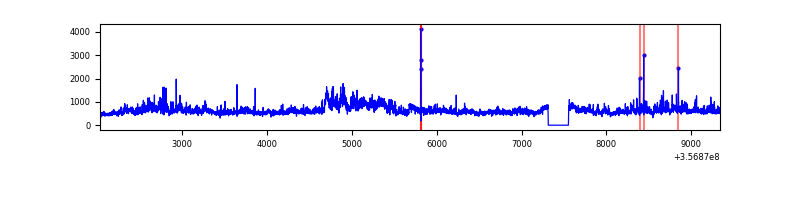 |
Top three noisy pixels from each quadrant. If the there are fewer than three noisy pixels in the level2.evt file, extra rows are filled as -1
| Pixel properties | Quadrant properties | ||||||
|---|---|---|---|---|---|---|---|
| Quadrant | DetID | PixID | Counts | Sigma | Mean | Median | Sigma |
| A | 14 | 238 | 36196 | 211.64 | 835 | 818 | 167.2 |
| A | 13 | 254 | 13786 | 77.58 | 835 | 818 | 167.2 |
| A | 8 | 192 | 10985 | 60.82 | 835 | 818 | 167.2 |
| B | 6 | 159 | 1967389 | 12496.74 | 822 | 801 | 157.4 |
| B | 0 | 190 | 47487 | 296.67 | 822 | 801 | 157.4 |
| B | 12 | 111 | 19567 | 119.25 | 822 | 801 | 157.4 |
| C | 14 | 238 | 150542 | 818.24 | 789 | 792 | 183.0 |
| C | 3 | 233 | 80203 | 433.9 | 789 | 792 | 183.0 |
| C | 14 | 254 | 29270 | 155.6 | 789 | 792 | 183.0 |
| D | 1 | 52 | 874952 | 4294.61 | 796 | 779 | 203.6 |
| D | 8 | 195 | 272229 | 1333.57 | 796 | 779 | 203.6 |
| D | 12 | 227 | 262262 | 1284.61 | 796 | 779 | 203.6 |
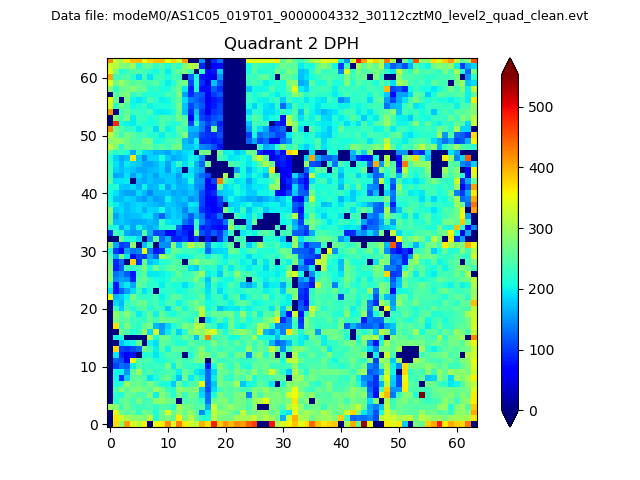
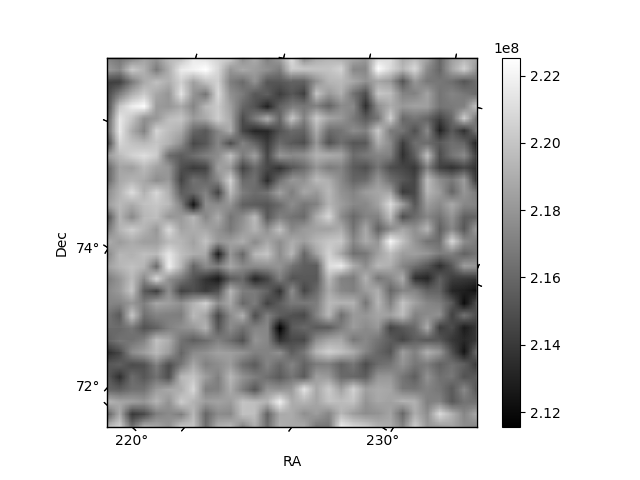
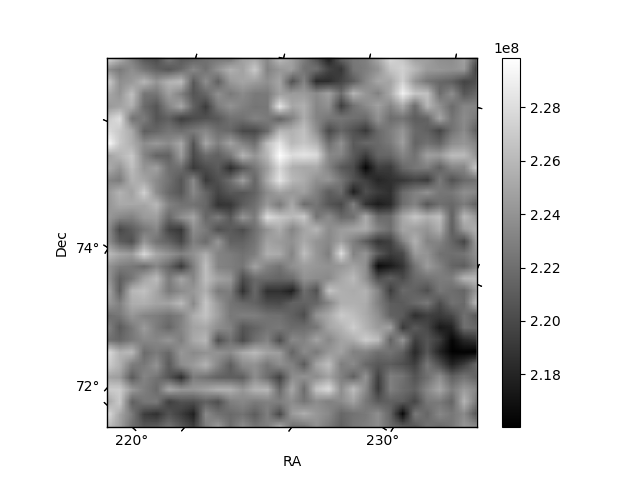
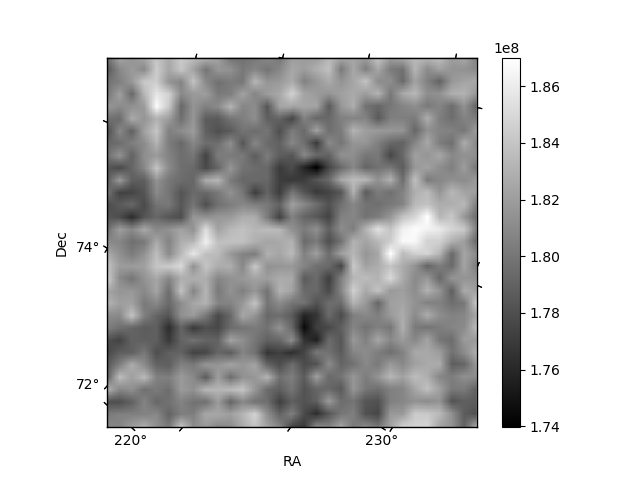
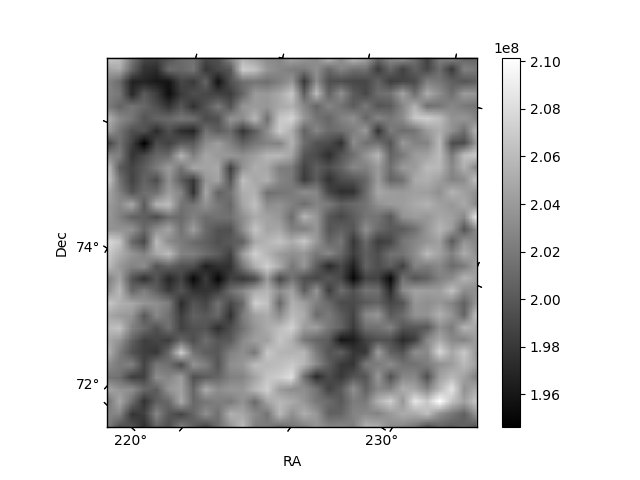
Histogram calculated using DETX and DETY for each event in the final _common_clean file
| Quadrant A | 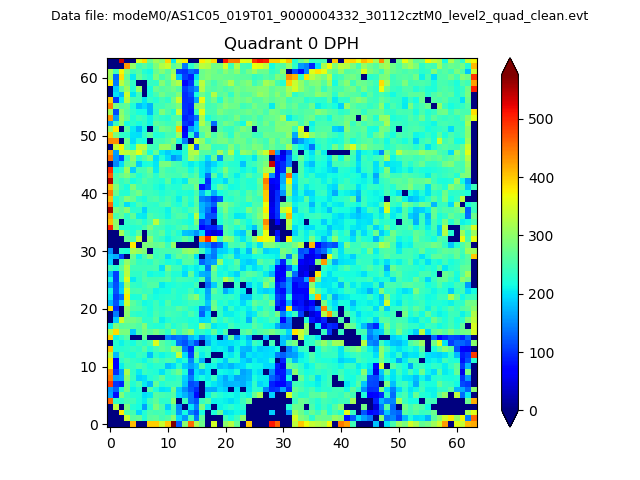 |
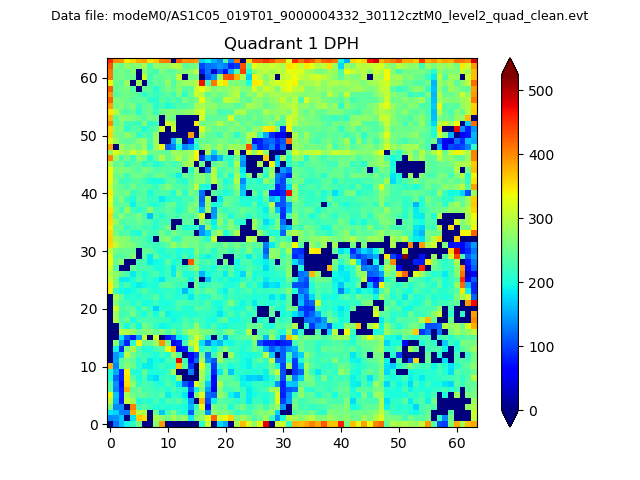 |
Quadrant B |
|---|---|---|---|
| Quadrant D | 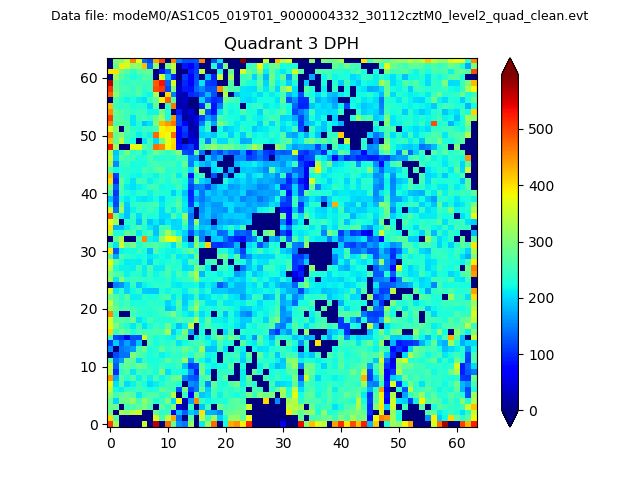 |
 |
Quadrant C |
| Plot type | Count rate plots | Images |
|---|---|---|
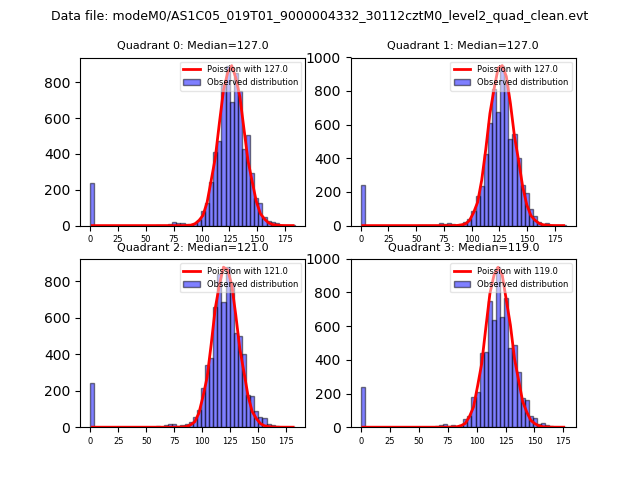
| Comparison with Poisson distribution Blue bars denote a histogram of data divided into 1 sec bins. Red curve is a Poisson curve with rate = median count rate of data. |
 |
 |
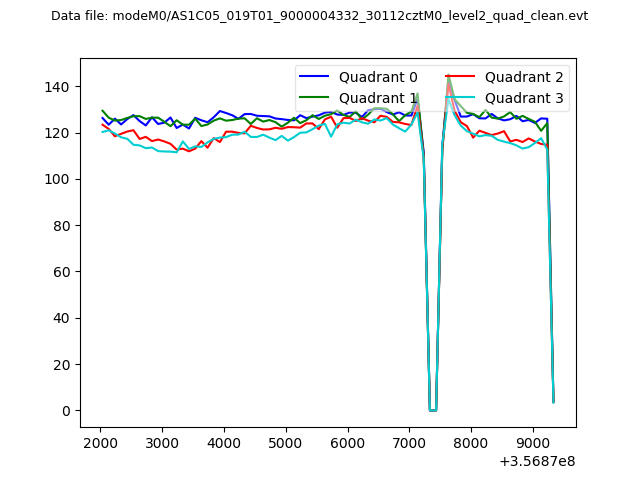
| Quadrant-wise count rates Data is divided into 100 sec bins |
 |
|
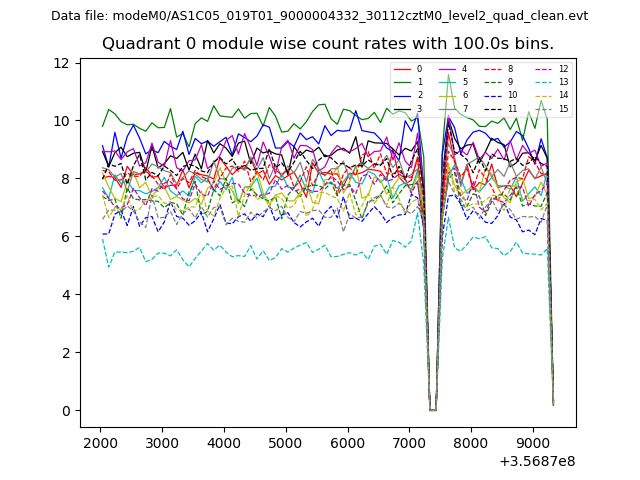
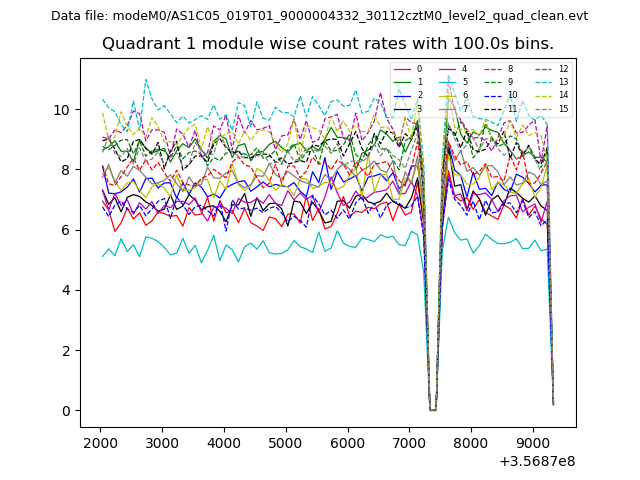
| Module-wise count rates for Quadrant A Data is divided into 100 sec bins |
 |
 |
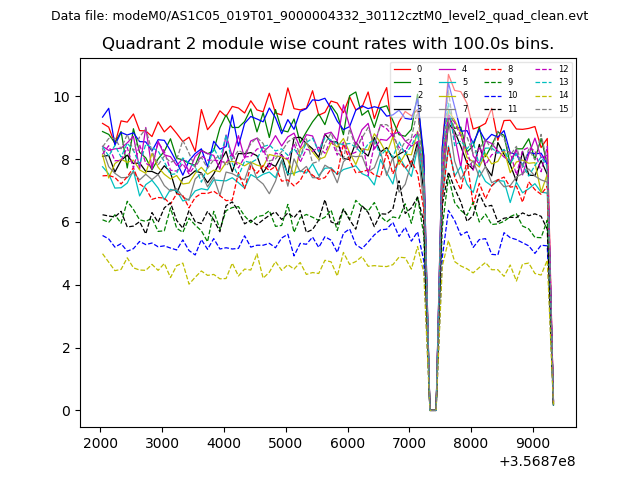
| Module-wise count rates for Quadrant B Data is divided into 100 sec bins |
 |
 |
| Module-wise count rates for Quadrant C Data is divided into 100 sec bins |
 |
 |
| Module-wise count rates for Quadrant D Data is divided into 100 sec bins |
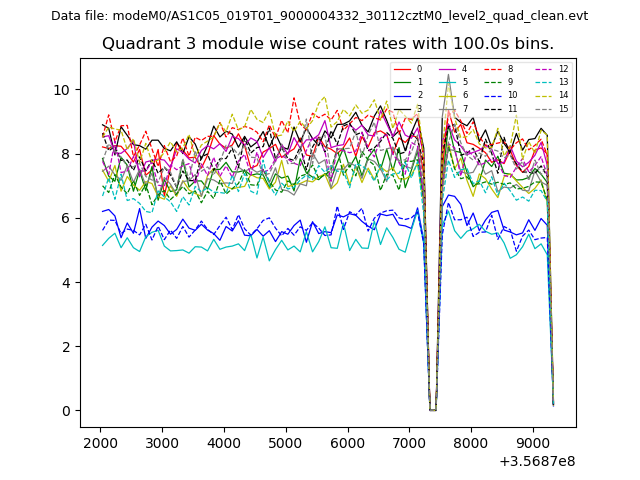 |
 |
| Parameter | Plot |
|---|---|
| CZT HV Monitor | 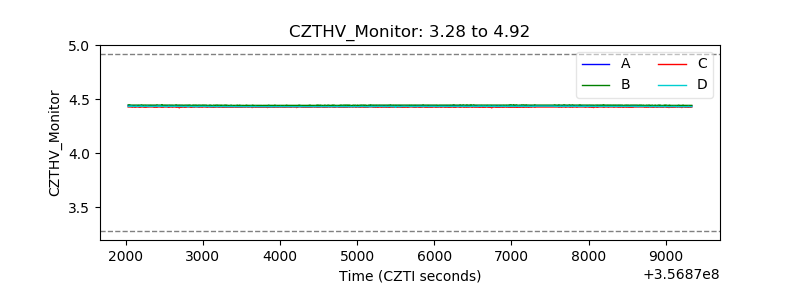 |
| D_VDD | 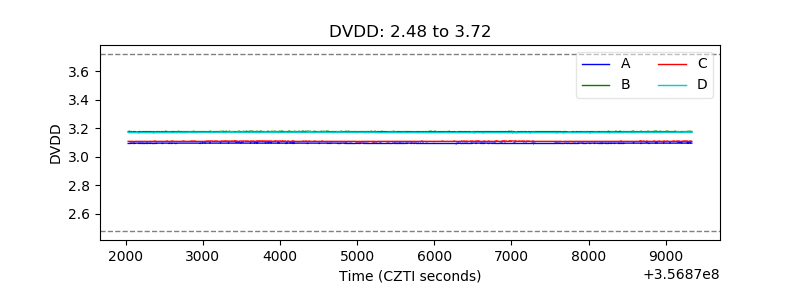 |
| Temperature 1 | 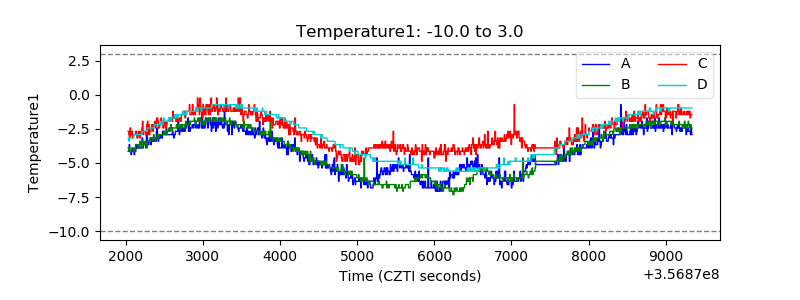 |
| Veto HV Monitor | 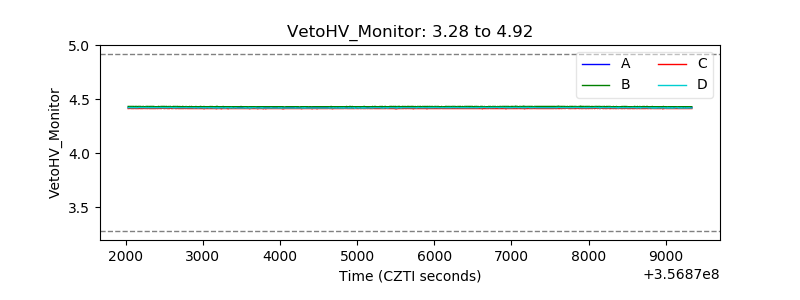 |
| Veto LLD | 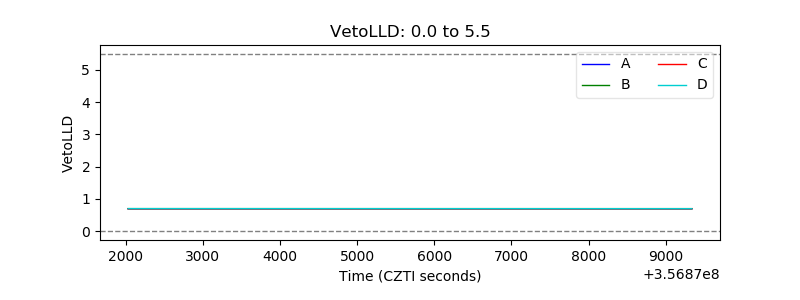 |
| Alpha Counter | 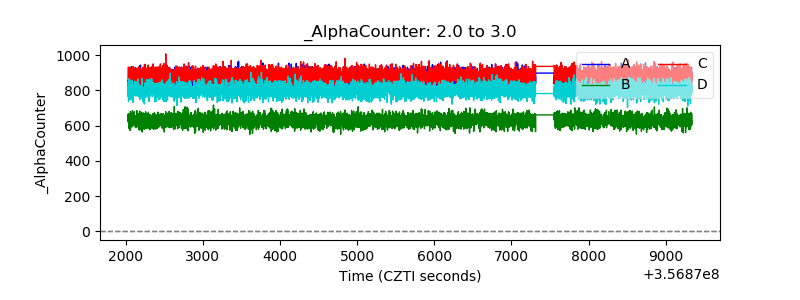 |
| _CPM_Rate | 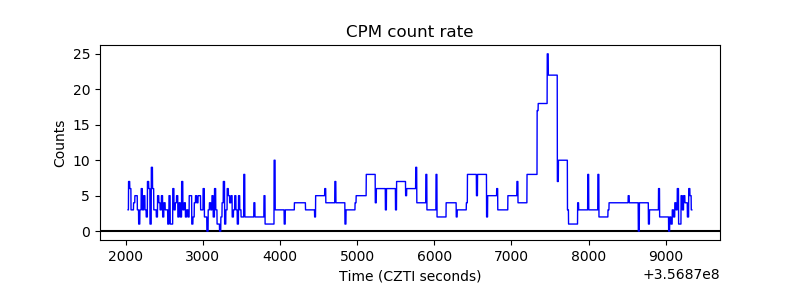 |
| CZT Counter | 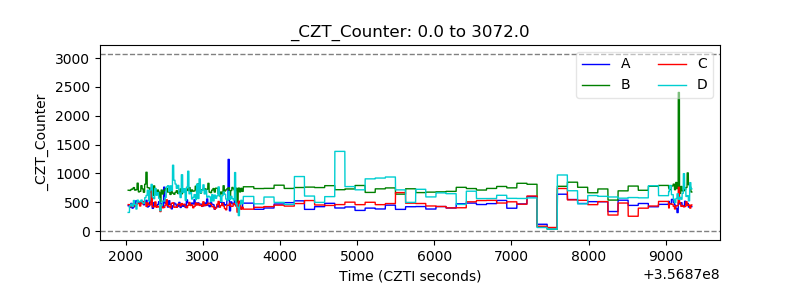 |
| +2.5 Volts monitor |  |
| +5 Volts monitor | 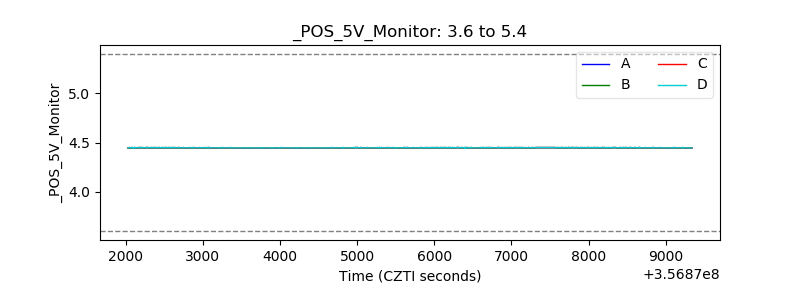 |
| _ROLL_ROT |  |
| _Roll_DEC | 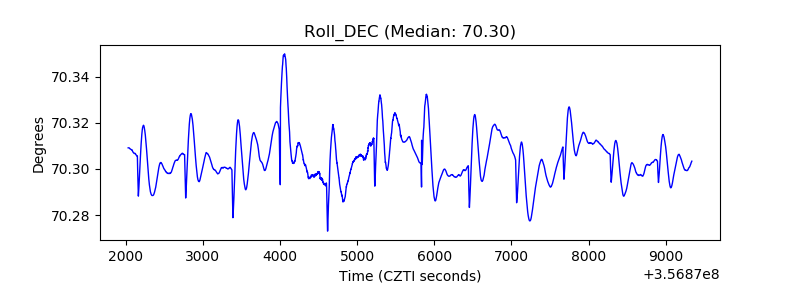 |
| _Roll_RA | 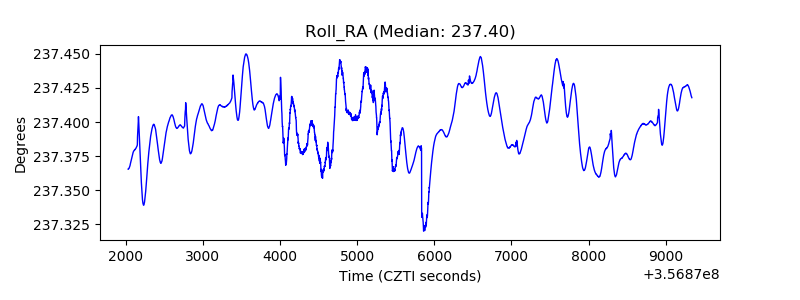 |
| Veto Counter |  |