| Param | Original file | Final file |
|---|---|---|
| Filename | modeM0/AS1C05_019T01_9000004332_30114cztM0_level2.evt | modeM0/AS1C05_019T01_9000004332_30114cztM0_level2_quad_clean.evt |
| Size (bytes) | 191,998,080 | 43,767,360 |
| Size | 183.1 MB | 41.7 MB |
| Events in quadrant A | 1,075,244 | 299,827 |
| Events in quadrant B | 1,774,590 | 297,990 |
| Events in quadrant C | 1,114,524 | 280,632 |
| Events in quadrant D | 1,685,563 | 274,185 |
| Mode M0 | |||
|---|---|---|---|
| Quadrant | BADHDUFLAG | Total packets | Discarded packets |
| A | 0 | 4804 | 0 |
| B | 0 | 7191 | 0 |
| C | 0 | 4830 | 0 |
| D | 0 | 6688 | 0 |
| Mode SS | |||
|---|---|---|---|
| Quadrant | BADHDUFLAG | Total packets | Discarded packets |
| A | 0 | 48 | 0 |
| B | 0 | 48 | 0 |
| C | 0 | 48 | 0 |
| D | 0 | 48 | 0 |
| Quadrant | Total seconds | Saturated seconds | Saturation percentage |
|---|---|---|---|
| A | 2396 | 2 | 0.083472% |
| B | 2397 | 6 | 0.250313% |
| C | 2397 | 26 | 1.084689% |
| D | 2397 | 14 | 0.584063% |
Noise dominated data is calculated using 1-second bins in cleaned event files. If a bin has >2000 counts, and if more than 50% of those come from <1% of pixels, then it is considered to be noise-dominated and hence unusable.
| Quadrant | # 1 sec bins | Bins with >0 counts | Bins with >2000 counts | High rate bins dominated by noise | Noise dominated (total time) | Noise dominated (detector-on time) | Marked lightcurve |
|---|---|---|---|---|---|---|---|
| A | 2396 | 2396 | 0 | 0 | 0.00% | 0.00% | 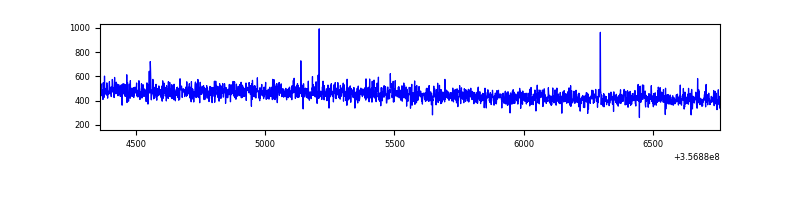 |
| B | 2397 | 2397 | 0 | 0 | 0.00% | 0.00% | 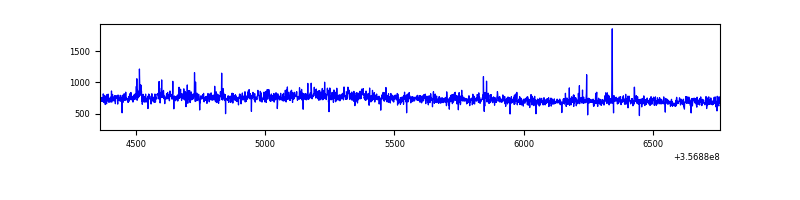 |
| C | 2397 | 2397 | 0 | 0 | 0.00% | 0.00% | 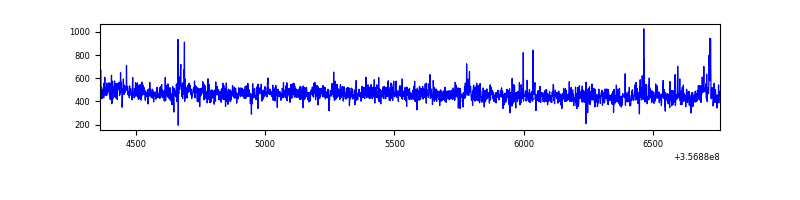 |
| D | 2397 | 2397 | 5 | 5 | 0.21% | 0.21% | 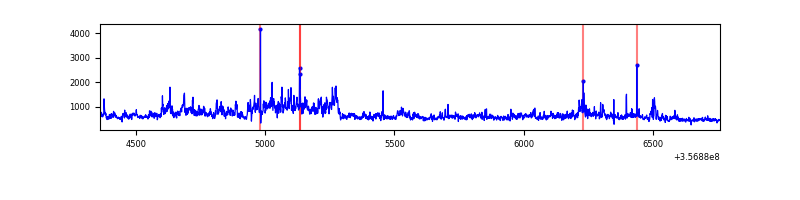 |
Top three noisy pixels from each quadrant. If the there are fewer than three noisy pixels in the level2.evt file, extra rows are filled as -1
| Pixel properties | Quadrant properties | ||||||
|---|---|---|---|---|---|---|---|
| Quadrant | DetID | PixID | Counts | Sigma | Mean | Median | Sigma |
| A | 13 | 254 | 4490 | 73.26 | 278 | 272 | 57.6 |
| A | 3 | 137 | 2760 | 43.21 | 278 | 272 | 57.6 |
| A | 0 | 226 | 2358 | 36.23 | 278 | 272 | 57.6 |
| B | 6 | 159 | 671621 | 12392.59 | 273 | 266 | 54.2 |
| B | 0 | 190 | 26091 | 476.71 | 273 | 266 | 54.2 |
| B | 12 | 111 | 6386 | 112.97 | 273 | 266 | 54.2 |
| C | 14 | 238 | 50916 | 798.9 | 265 | 267 | 63.4 |
| C | 14 | 254 | 11893 | 183.38 | 265 | 267 | 63.4 |
| C | 3 | 233 | 11178 | 172.1 | 265 | 267 | 63.4 |
| D | 1 | 52 | 352398 | 5351.4 | 270 | 261 | 65.8 |
| D | 12 | 227 | 169329 | 2569.32 | 270 | 261 | 65.8 |
| D | 8 | 195 | 94856 | 1437.55 | 270 | 261 | 65.8 |
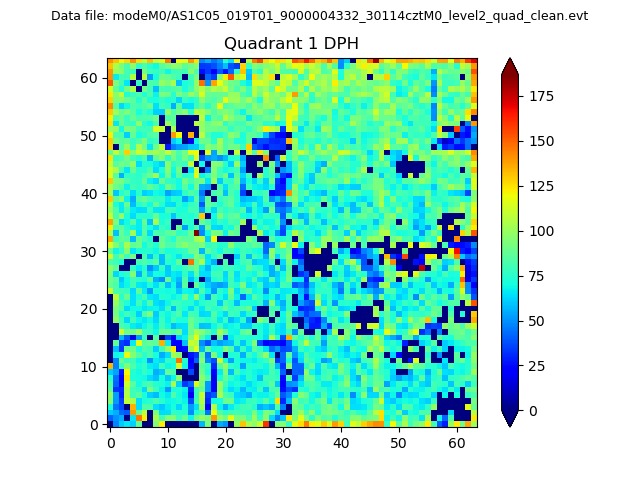
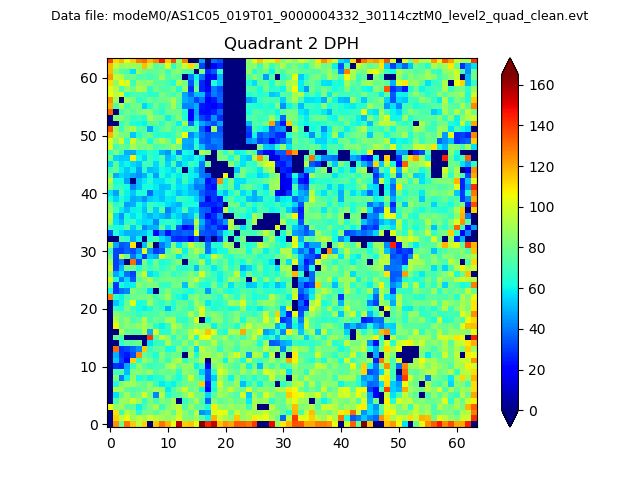
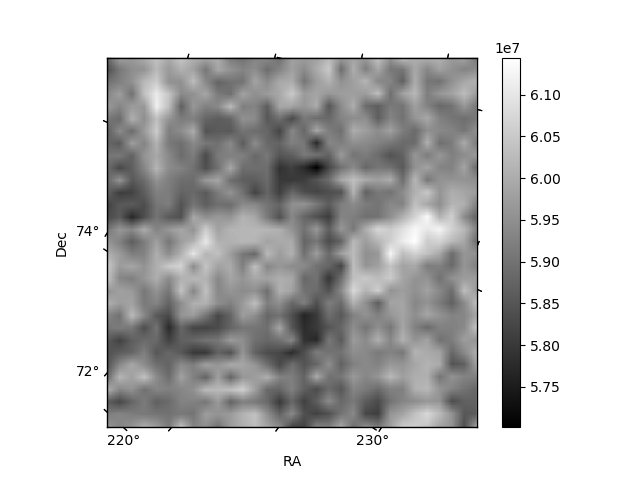
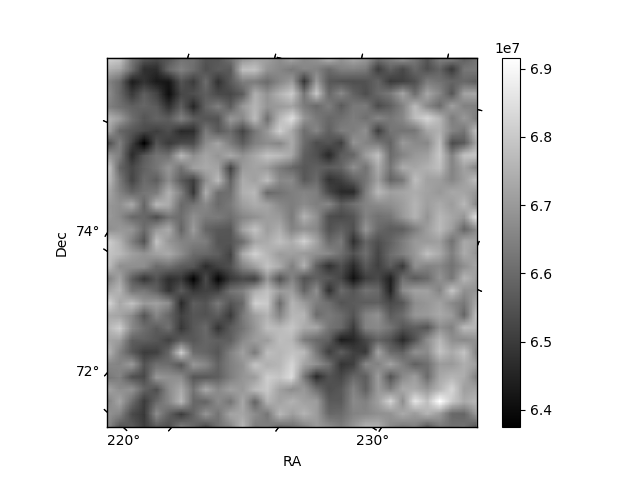
Histogram calculated using DETX and DETY for each event in the final _common_clean file
| Quadrant A |  |
 |
Quadrant B |
|---|---|---|---|
| Quadrant D |  |
 |
Quadrant C |
| Plot type | Count rate plots | Images |
|---|---|---|
| Comparison with Poisson distribution Blue bars denote a histogram of data divided into 1 sec bins. Red curve is a Poisson curve with rate = median count rate of data. |
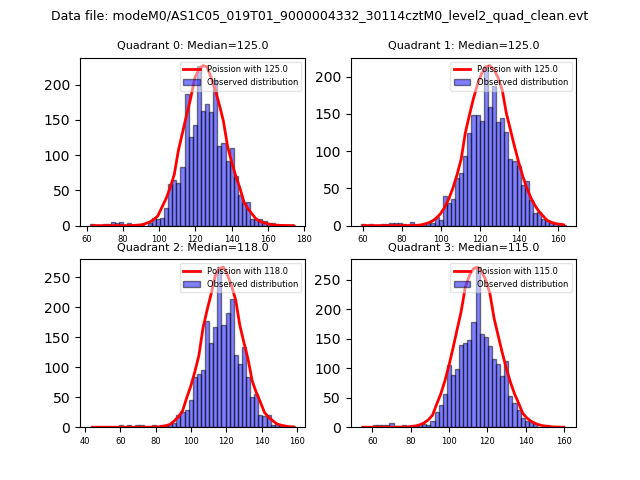 |
 |
| Quadrant-wise count rates Data is divided into 100 sec bins |
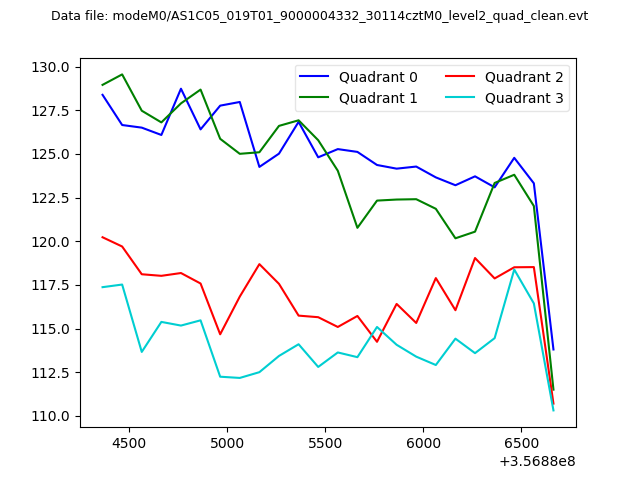 |
|
| Module-wise count rates for Quadrant A Data is divided into 100 sec bins |
 |
 |
| Module-wise count rates for Quadrant B Data is divided into 100 sec bins |
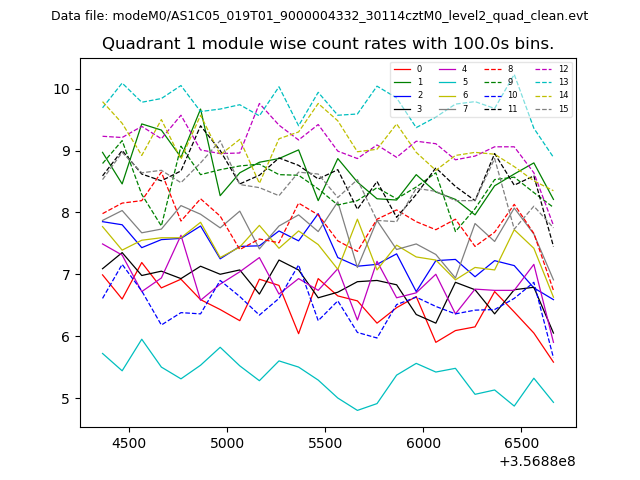 |
 |
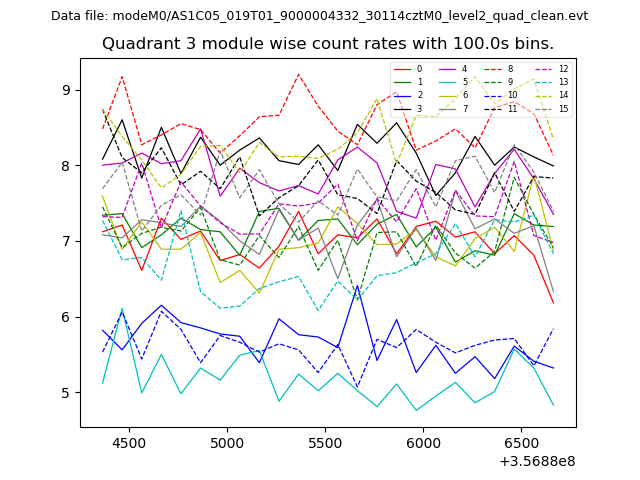
| Module-wise count rates for Quadrant C Data is divided into 100 sec bins |
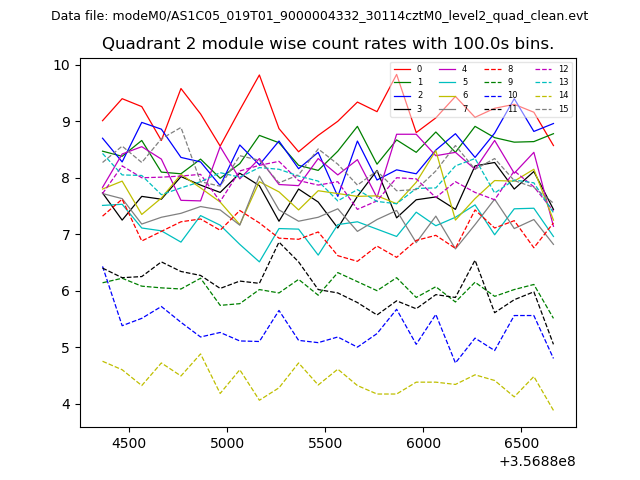 |
 |
| Module-wise count rates for Quadrant D Data is divided into 100 sec bins |
 |
 |
| Parameter | Plot |
|---|---|
| CZT HV Monitor | 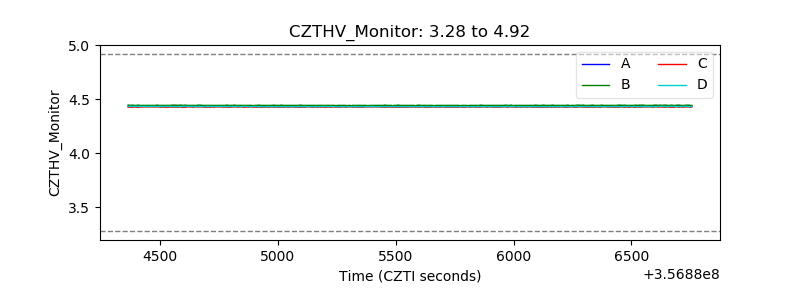 |
| D_VDD | 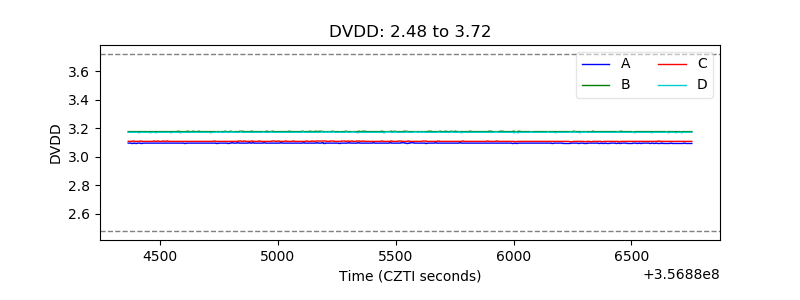 |
| Temperature 1 | 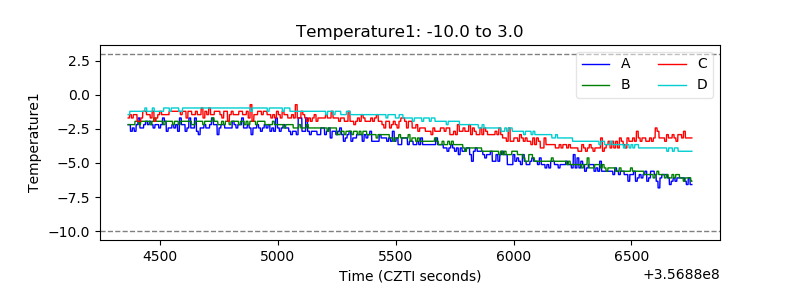 |
| Veto HV Monitor | 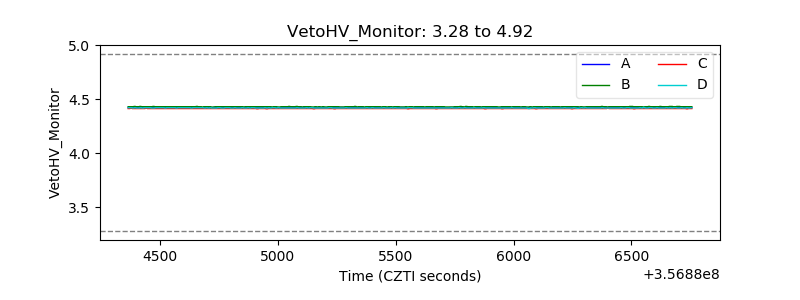 |
| Veto LLD | 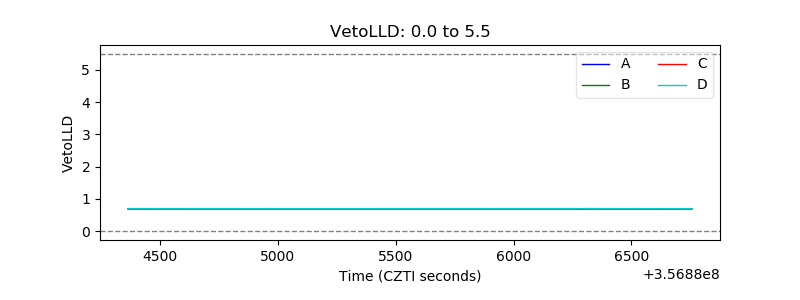 |
| Alpha Counter | 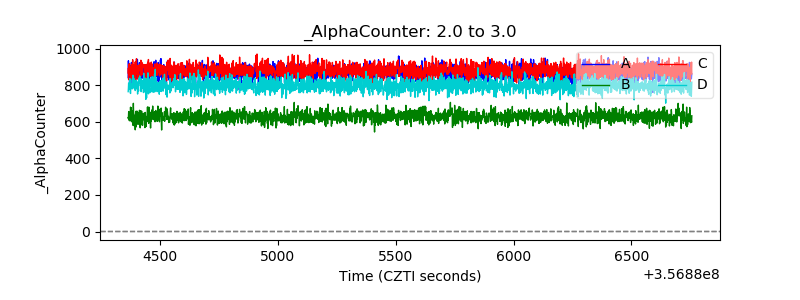 |
| _CPM_Rate | 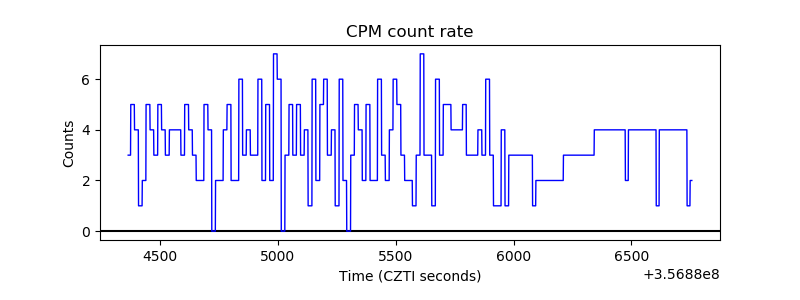 |
| CZT Counter | 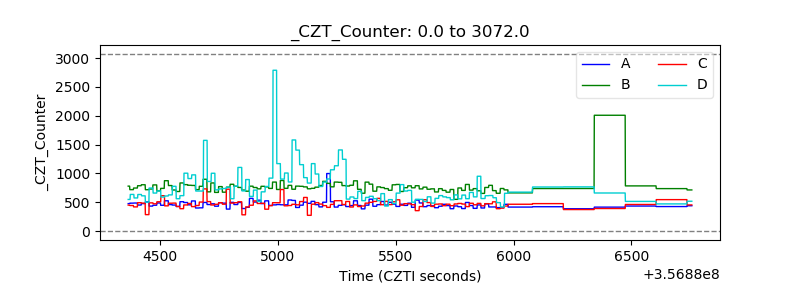 |
| +2.5 Volts monitor |  |
| +5 Volts monitor |  |
| _ROLL_ROT | 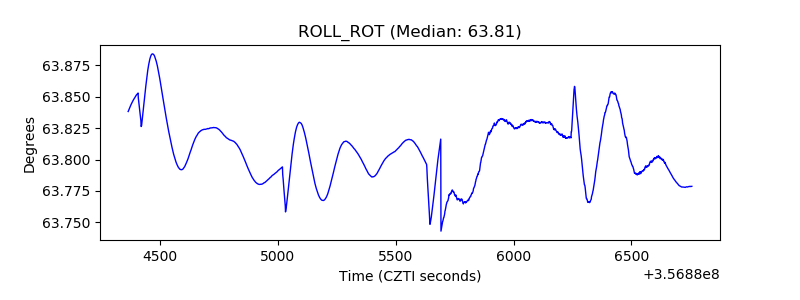 |
| _Roll_DEC | 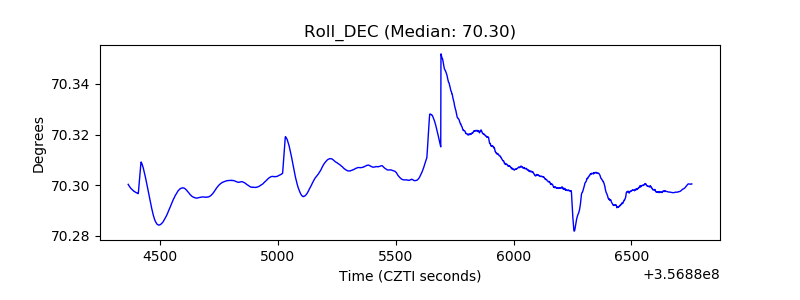 |
| _Roll_RA | 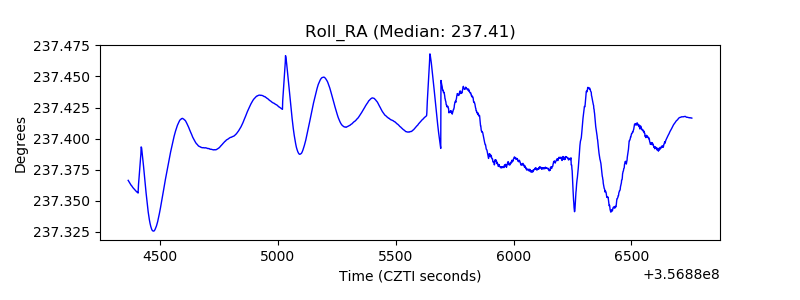 |
| Veto Counter | 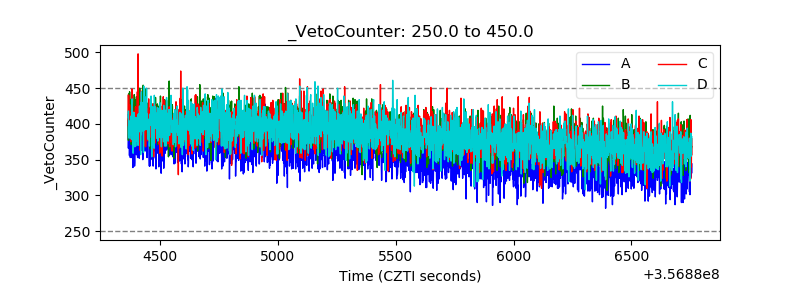 |