| Param | Original file | Final file |
|---|---|---|
| Filename | modeM0/AS1A10_097T01_9000004334cztM0_level2.fits | modeM0/AS1A10_097T01_9000004334cztM0_level2_quad_clean.evt |
| Size (bytes) | 952,012,800 | 930,386,880 |
| Size | 907.9 MB | 887.3 MB |
| Events in quadrant A | 5,935,518 | 5,831,856 |
| Events in quadrant B | 5,545,854 | 5,746,176 |
| Events in quadrant C | 5,452,594 | 4,719,596 |
| Events in quadrant D | 5,145,658 | 5,133,368 |
| Mode M9 | |||
|---|---|---|---|
| Quadrant | BADHDUFLAG | Total packets | Discarded packets |
| A | 0 | 144 | 0 |
| B | 0 | 144 | 0 |
| C | 0 | 144 | 0 |
| D | 0 | 144 | 0 |
| Mode SS | |||
|---|---|---|---|
| Quadrant | BADHDUFLAG | Total packets | Discarded packets |
| A | 0 | 2002 | 0 |
| B | 0 | 2002 | 0 |
| C | 0 | 2002 | 0 |
| D | 0 | 2002 | 0 |
| Mode M0 | |||
|---|---|---|---|
| Quadrant | BADHDUFLAG | Total packets | Discarded packets |
| A | 0 | 209491 | 0 |
| B | 0 | 298759 | 0 |
| C | 0 | 346890 | 0 |
| D | 0 | 226349 | 0 |
| Quadrant | Total seconds | Saturated seconds | Saturation percentage |
|---|---|---|---|
| A | 98410 | 1682 | 1.709176% |
| B | 98410 | 2222 | 2.257901% |
| C | 98410 | 15354 | 15.602073% |
| D | 98410 | 1270 | 1.290519% |
Noise dominated data is calculated using 1-second bins in cleaned event files. If a bin has >2000 counts, and if more than 50% of those come from <1% of pixels, then it is considered to be noise-dominated and hence unusable.
| Quadrant | # 1 sec bins | Bins with >0 counts | Bins with >2000 counts | High rate bins dominated by noise | Noise dominated (total time) | Noise dominated (detector-on time) | Marked lightcurve |
|---|---|---|---|---|---|---|---|
| A | 112820 | 98404 | 0 | 0 | 0.00% | 0.00% | 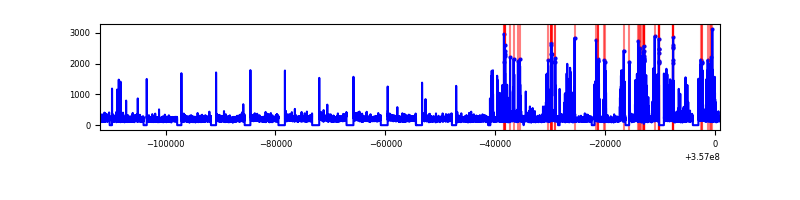 |
| B | 112820 | 98405 | 0 | 0 | 0.00% | 0.00% |  |
| C | 112819 | 98397 | 0 | 0 | 0.00% | 0.00% | 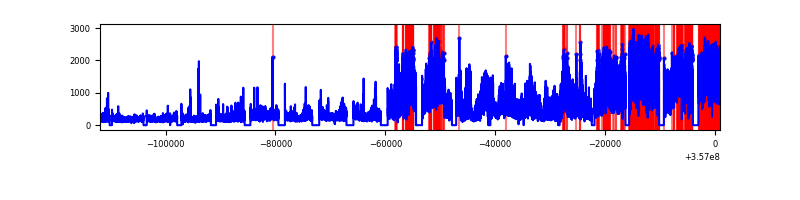 |
| D | 112820 | 98408 | 0 | 0 | 0.00% | 0.00% |  |
Top three noisy pixels from each quadrant. If the there are fewer than three noisy pixels in the level2.evt file, extra rows are filled as -1
| Pixel properties | Quadrant properties | ||||||
|---|---|---|---|---|---|---|---|
| Quadrant | DetID | PixID | Counts | Sigma | Mean | Median | Sigma |
| A | 0 | 29 | 5032 | 9.55 | 1543 | 1447 | 375.6 |
| A | 7 | 110 | 4661 | 8.56 | 1543 | 1447 | 375.6 |
| A | 0 | 30 | 4363 | 7.76 | 1543 | 1447 | 375.6 |
| B | 2 | 9 | 4640 | 11.44 | 1465 | 1403 | 282.9 |
| B | 5 | 255 | 3772 | 8.37 | 1465 | 1403 | 282.9 |
| B | 2 | 8 | 3746 | 8.28 | 1465 | 1403 | 282.9 |
| C | 12 | 241 | 3916 | 7.14 | 1441 | 1353 | 358.9 |
| C | 3 | 187 | 3794 | 6.8 | 1441 | 1353 | 358.9 |
| C | 9 | 209 | 3695 | 6.53 | 1441 | 1353 | 358.9 |
| D | 15 | 46 | 3951 | 6.74 | 1468 | 1338 | 387.7 |
| D | 10 | 189 | 3654 | 5.97 | 1468 | 1338 | 387.7 |
| D | 3 | 14 | 3596 | 5.82 | 1468 | 1338 | 387.7 |
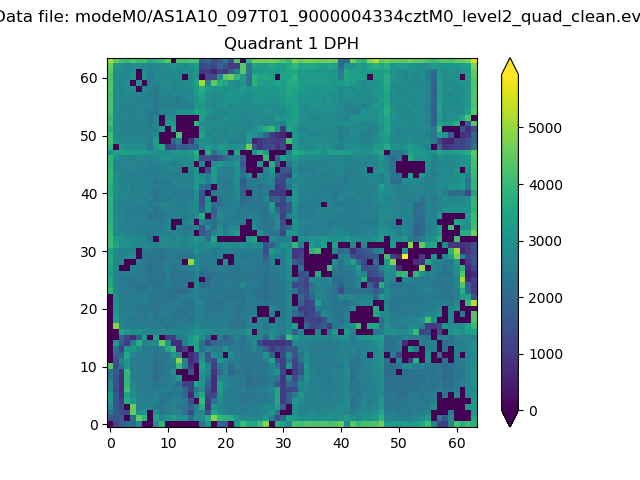
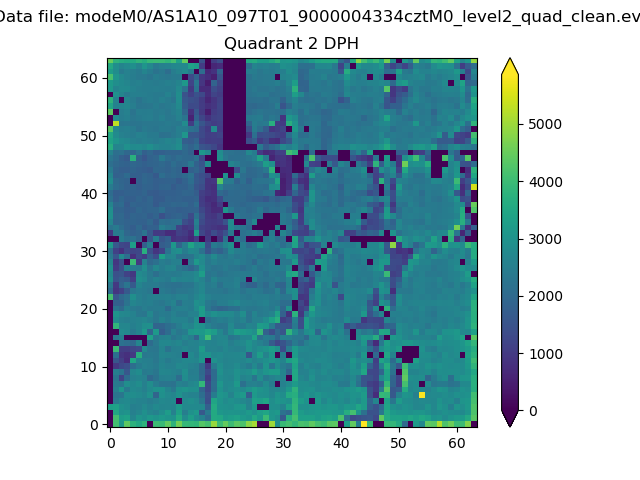
Histogram calculated using DETX and DETY for each event in the final _common_clean file
| Quadrant A |  |
 |
Quadrant B |
|---|---|---|---|
| Quadrant D | 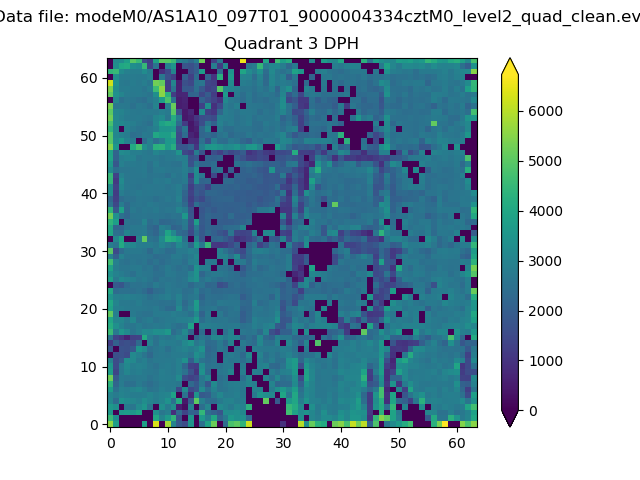 |
 |
Quadrant C |
| Plot type | Count rate plots | Images |
|---|---|---|
| Comparison with Poisson distribution Blue bars denote a histogram of data divided into 1 sec bins. Red curve is a Poisson curve with rate = median count rate of data. |
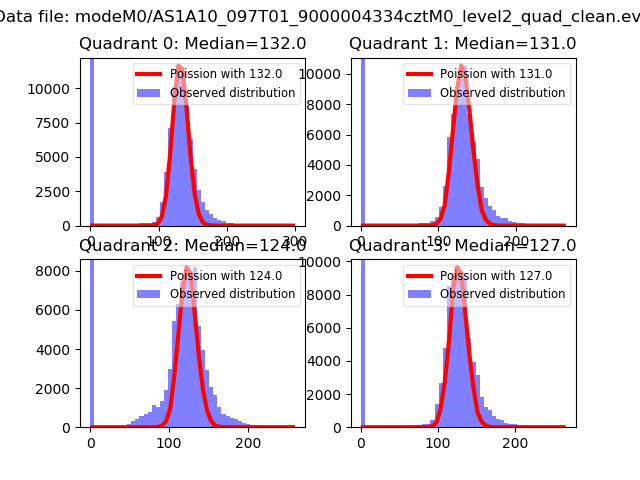 |
 |
| Quadrant-wise count rates Data is divided into 100 sec bins |
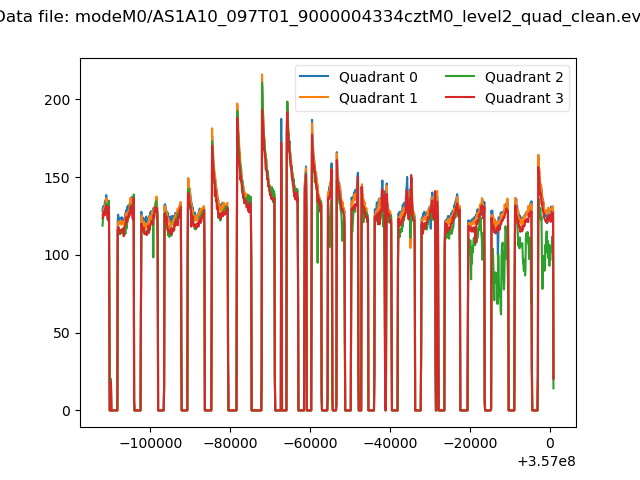 |
|
| Module-wise count rates for Quadrant A Data is divided into 100 sec bins |
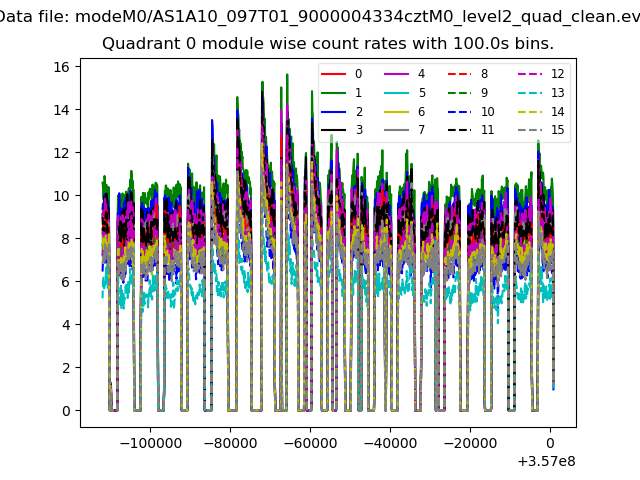 |
 |
| Module-wise count rates for Quadrant B Data is divided into 100 sec bins |
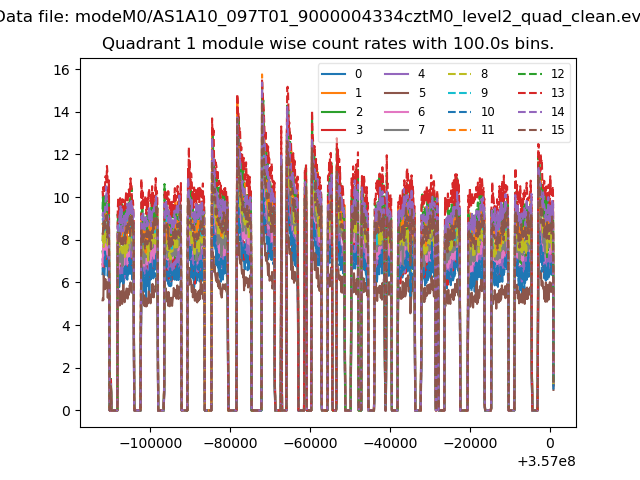 |
 |
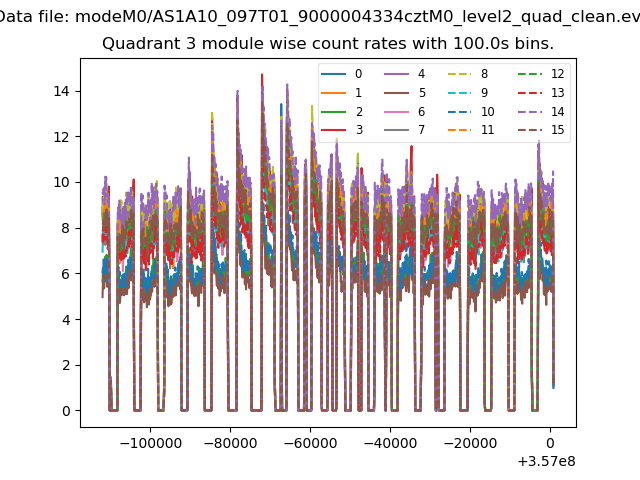
| Module-wise count rates for Quadrant C Data is divided into 100 sec bins |
 |
 |
| Module-wise count rates for Quadrant D Data is divided into 100 sec bins |
 |
 |
| Parameter | Plot |
|---|---|
| CZT HV Monitor |  |
| D_VDD | 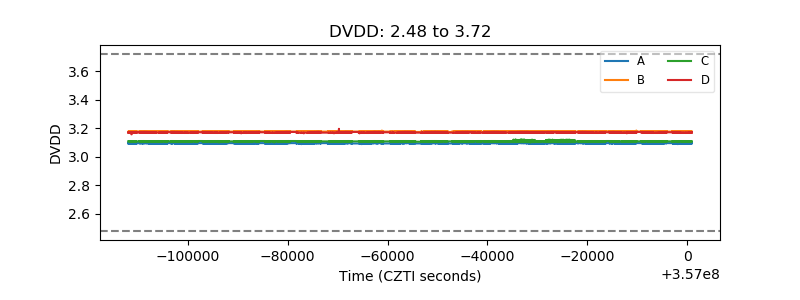 |
| Temperature 1 |  |
| Veto HV Monitor | 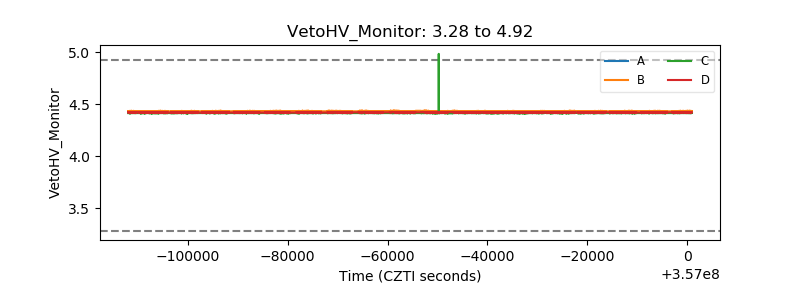 |
| Veto LLD | 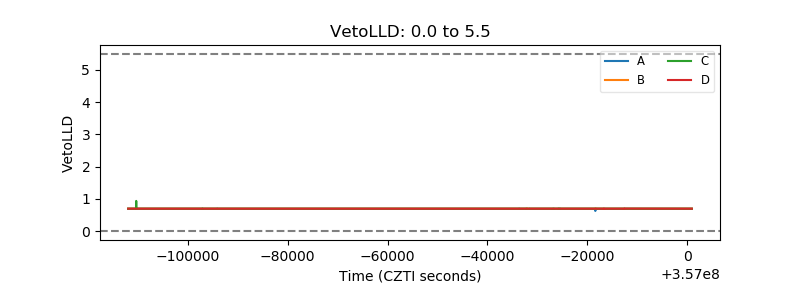 |
| Alpha Counter |  |
| _CPM_Rate | 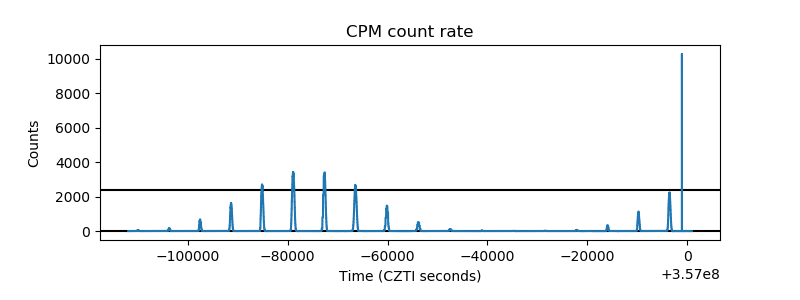 |
| CZT Counter | 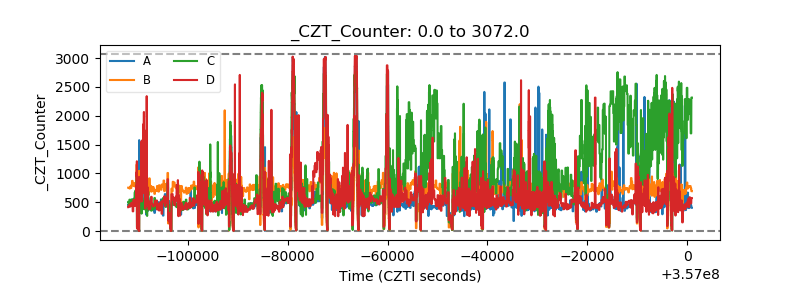 |
| +2.5 Volts monitor |  |
| +5 Volts monitor | 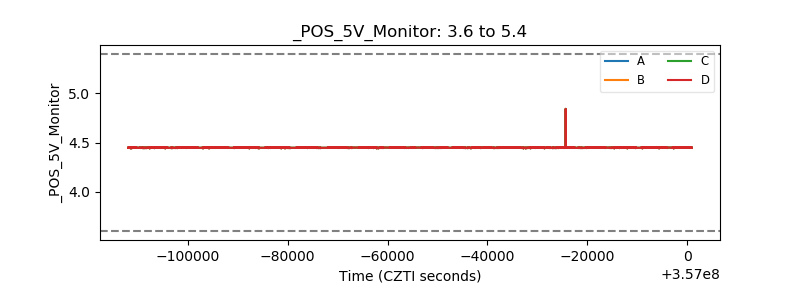 |
| _ROLL_ROT |  |
| _Roll_DEC | 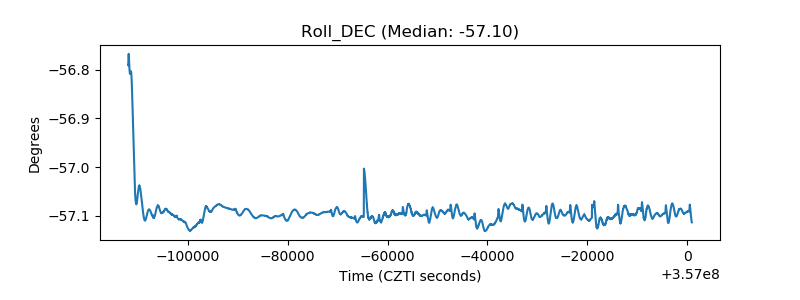 |
| _Roll_RA | 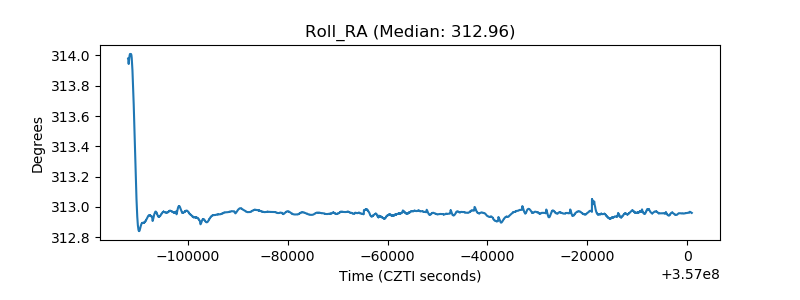 |
| Veto Counter | 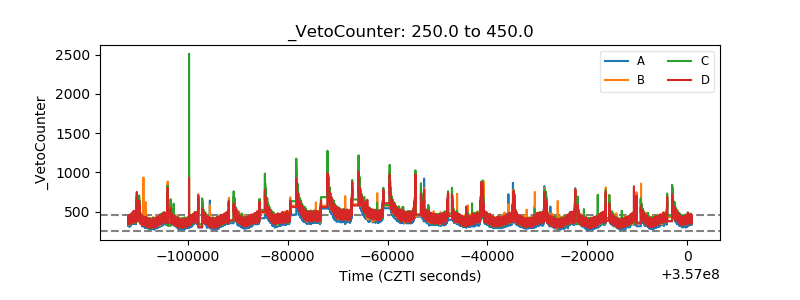 |