| Param | Original file | Final file |
|---|---|---|
| Filename | modeM0/AS1A10_097T01_9000004334_30116cztM0_level2.evt | modeM0/AS1A10_097T01_9000004334_30116cztM0_level2_quad_clean.evt |
| Size (bytes) | 996,883,200 | 179,988,480 |
| Size | 950.7 MB | 171.7 MB |
| Events in quadrant A | 5,961,034 | 1,173,406 |
| Events in quadrant B | 9,722,472 | 1,157,146 |
| Events in quadrant C | 6,201,131 | 1,115,552 |
| Events in quadrant D | 7,439,181 | 1,118,406 |
| Mode M9 | |||
|---|---|---|---|
| Quadrant | BADHDUFLAG | Total packets | Discarded packets |
| A | 0 | 14 | 0 |
| B | 0 | 14 | 0 |
| C | 0 | 14 | 0 |
| D | 0 | 14 | 0 |
| Mode SS | |||
|---|---|---|---|
| Quadrant | BADHDUFLAG | Total packets | Discarded packets |
| A | 0 | 260 | 0 |
| B | 0 | 260 | 0 |
| C | 0 | 260 | 0 |
| D | 0 | 260 | 0 |
| Mode M0 | |||
|---|---|---|---|
| Quadrant | BADHDUFLAG | Total packets | Discarded packets |
| A | 0 | 26235 | 3 |
| B | 0 | 38742 | 4 |
| C | 0 | 26603 | 3 |
| D | 0 | 30267 | 3 |
| Quadrant | Total seconds | Saturated seconds | Saturation percentage |
|---|---|---|---|
| A | 12836 | 116 | 0.903708% |
| B | 12836 | 215 | 1.674977% |
| C | 12836 | 239 | 1.861951% |
| D | 12836 | 127 | 0.989405% |
Noise dominated data is calculated using 1-second bins in cleaned event files. If a bin has >2000 counts, and if more than 50% of those come from <1% of pixels, then it is considered to be noise-dominated and hence unusable.
| Quadrant | # 1 sec bins | Bins with >0 counts | Bins with >2000 counts | High rate bins dominated by noise | Noise dominated (total time) | Noise dominated (detector-on time) | Marked lightcurve |
|---|---|---|---|---|---|---|---|
| A | 14211 | 12837 | 2 | 2 | 0.01% | 0.02% | 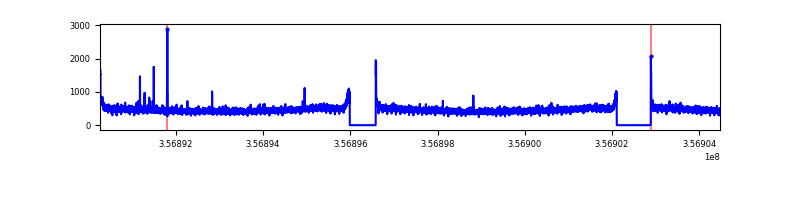 |
| B | 14211 | 12837 | 12 | 12 | 0.08% | 0.09% | 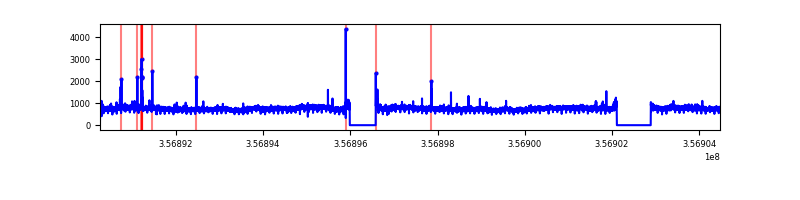 |
| C | 14211 | 12838 | 0 | 0 | 0.00% | 0.00% | 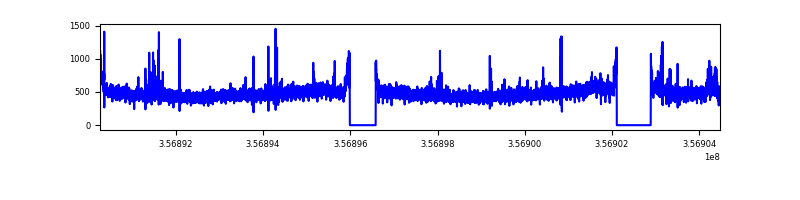 |
| D | 14211 | 12838 | 61 | 61 | 0.43% | 0.48% | 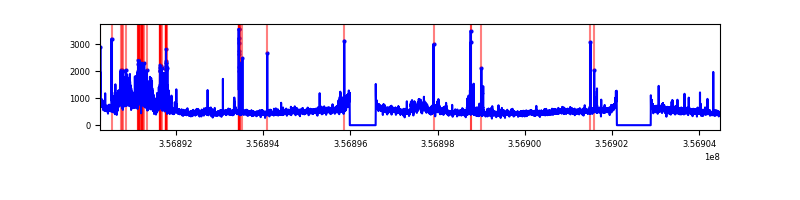 |
Top three noisy pixels from each quadrant. If the there are fewer than three noisy pixels in the level2.evt file, extra rows are filled as -1
| Pixel properties | Quadrant properties | ||||||
|---|---|---|---|---|---|---|---|
| Quadrant | DetID | PixID | Counts | Sigma | Mean | Median | Sigma |
| A | 8 | 192 | 35768 | 112.16 | 1527 | 1492 | 305.6 |
| A | 13 | 254 | 25395 | 78.22 | 1527 | 1492 | 305.6 |
| A | 0 | 128 | 23276 | 71.29 | 1527 | 1492 | 305.6 |
| B | 6 | 159 | 3706515 | 12886.75 | 1508 | 1469 | 287.5 |
| B | 0 | 190 | 44921 | 151.13 | 1508 | 1469 | 287.5 |
| B | 12 | 111 | 36383 | 121.44 | 1508 | 1469 | 287.5 |
| C | 14 | 238 | 274335 | 799.81 | 1454 | 1461 | 341.2 |
| C | 3 | 233 | 177212 | 515.14 | 1454 | 1461 | 341.2 |
| C | 14 | 254 | 58473 | 167.11 | 1454 | 1461 | 341.2 |
| D | 1 | 52 | 1167859 | 3076.56 | 1468 | 1433 | 379.1 |
| D | 8 | 195 | 452955 | 1190.93 | 1468 | 1433 | 379.1 |
| D | 12 | 227 | 73126 | 189.1 | 1468 | 1433 | 379.1 |
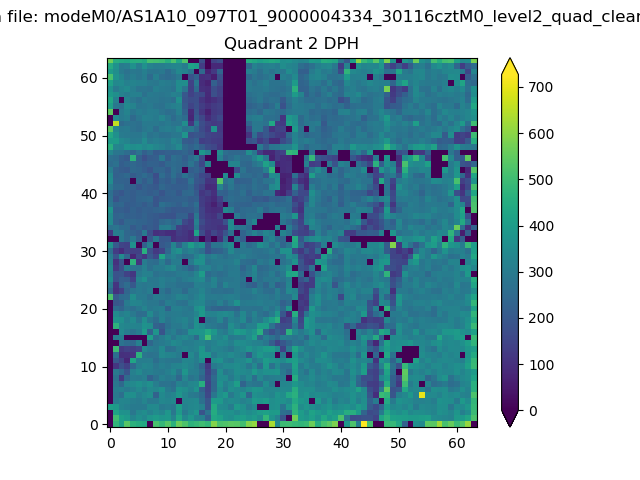
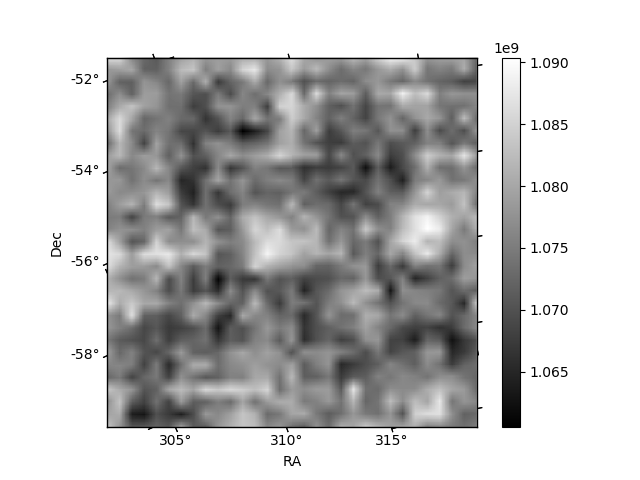
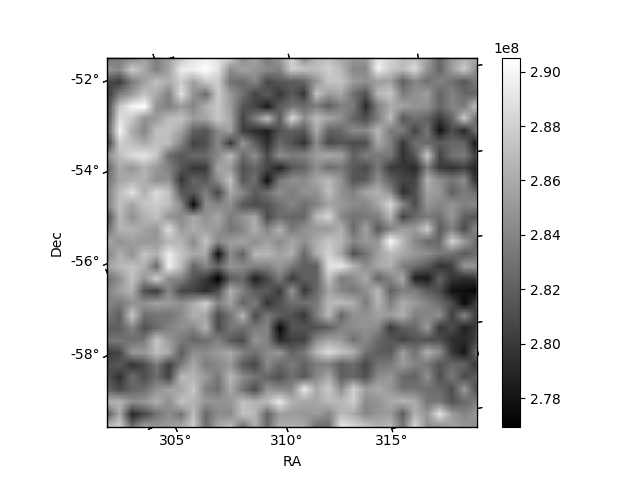
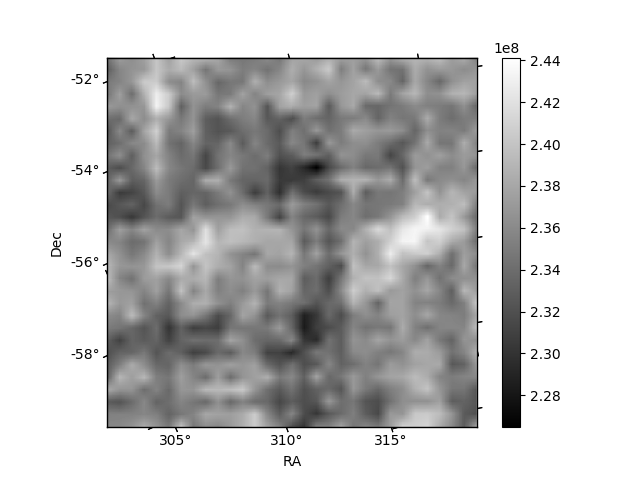
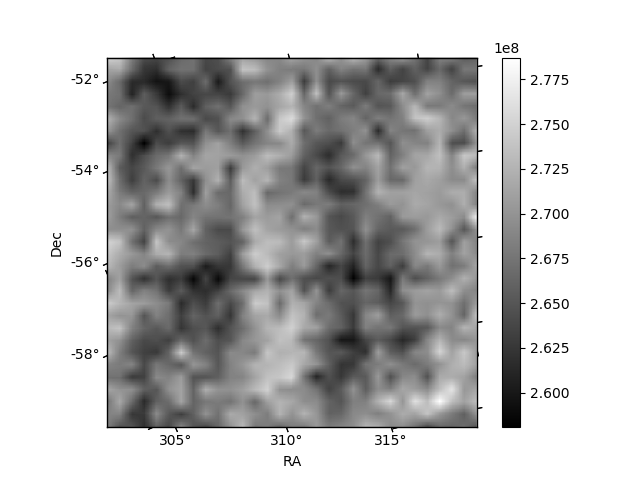
Histogram calculated using DETX and DETY for each event in the final _common_clean file
| Quadrant A | 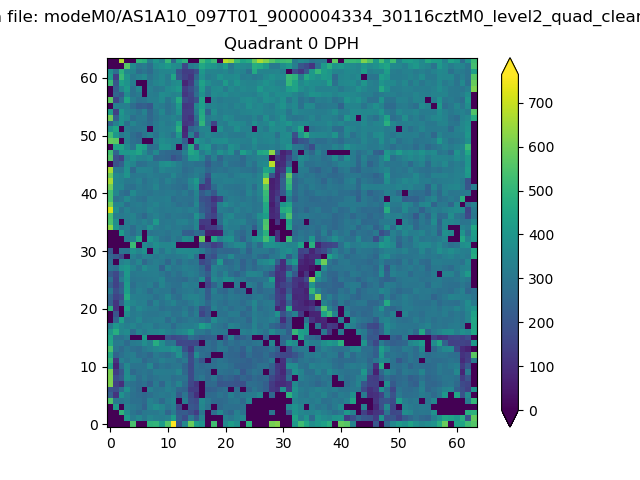 |
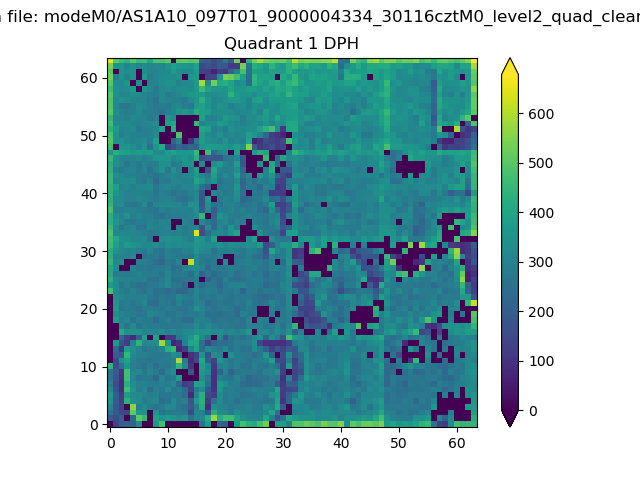 |
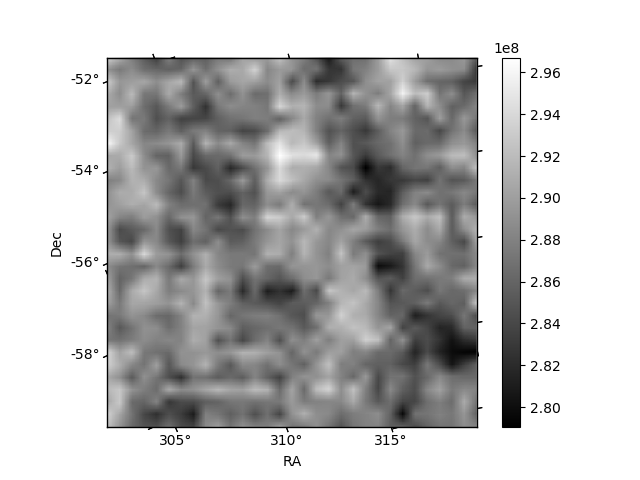
Quadrant B |
|---|---|---|---|
| Quadrant D | 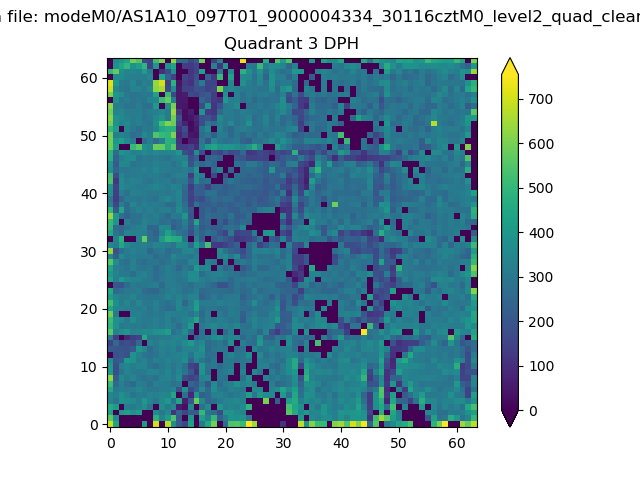 |
 |
Quadrant C |
| Plot type | Count rate plots | Images |
|---|---|---|
| Comparison with Poisson distribution Blue bars denote a histogram of data divided into 1 sec bins. Red curve is a Poisson curve with rate = median count rate of data. |
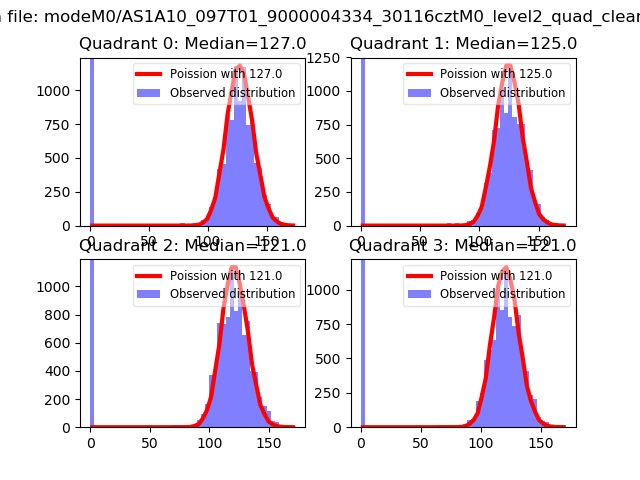 |
 |
| Quadrant-wise count rates Data is divided into 100 sec bins |
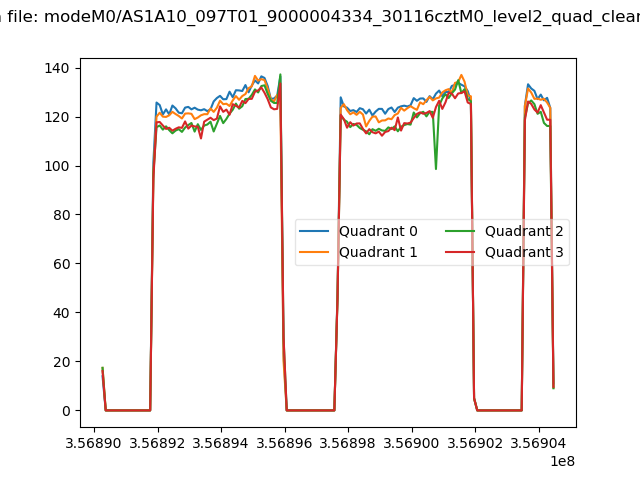 |
|
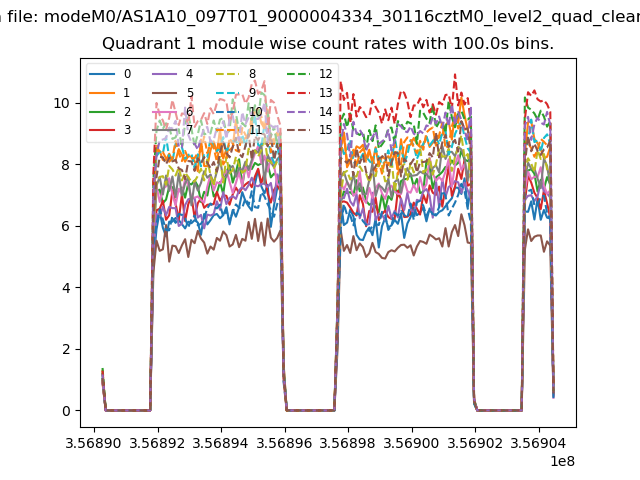
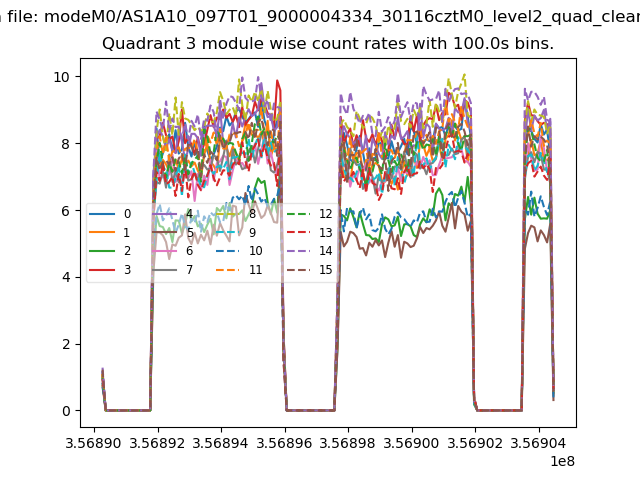
| Module-wise count rates for Quadrant A Data is divided into 100 sec bins |
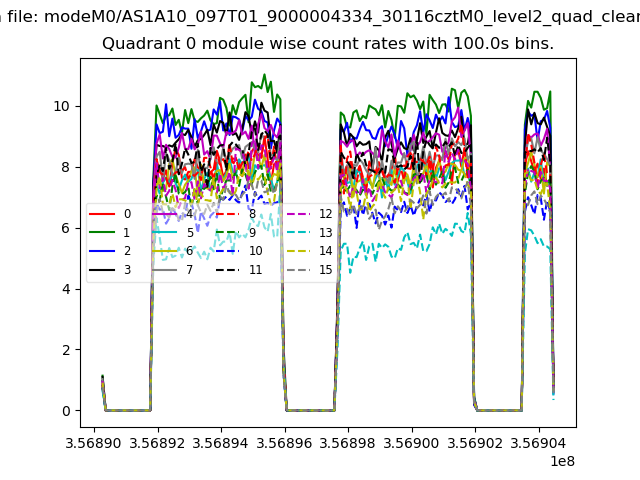 |
 |
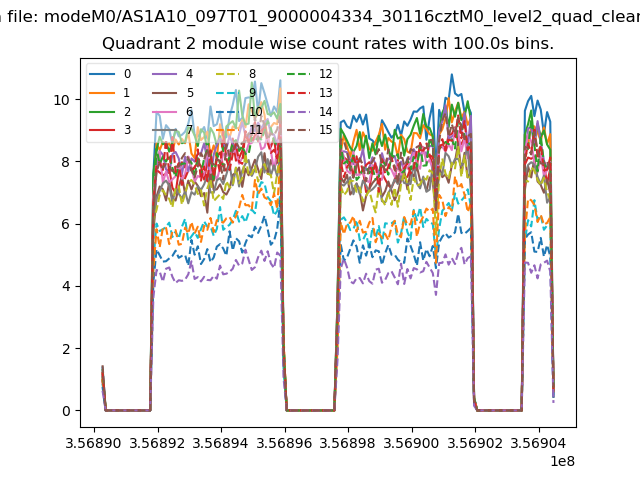
| Module-wise count rates for Quadrant B Data is divided into 100 sec bins |
 |
 |
| Module-wise count rates for Quadrant C Data is divided into 100 sec bins |
 |
 |
| Module-wise count rates for Quadrant D Data is divided into 100 sec bins |
 |
 |
| Parameter | Plot |
|---|---|
| CZT HV Monitor | 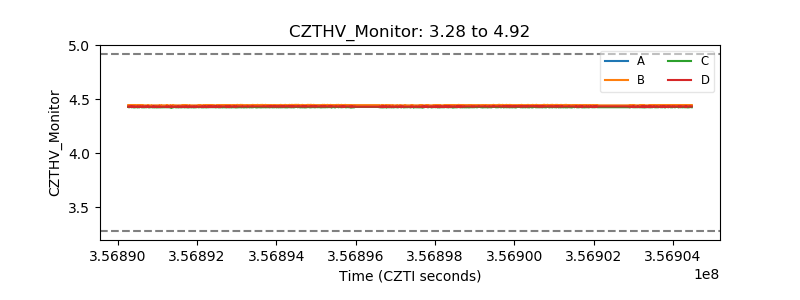 |
| D_VDD | 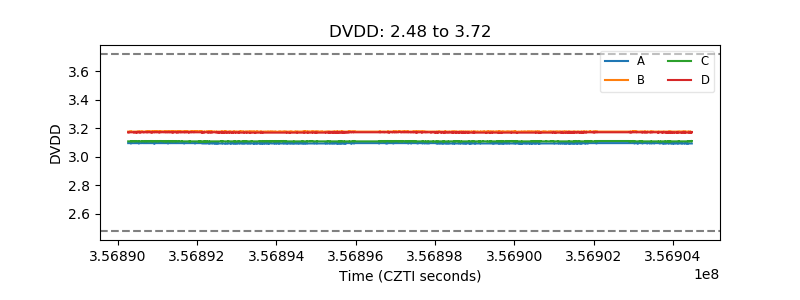 |
| Temperature 1 | 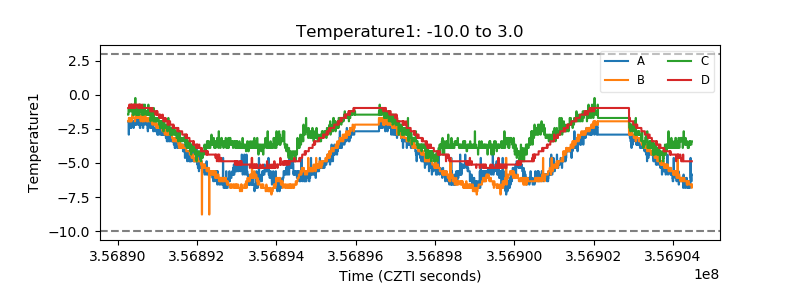 |
| Veto HV Monitor | 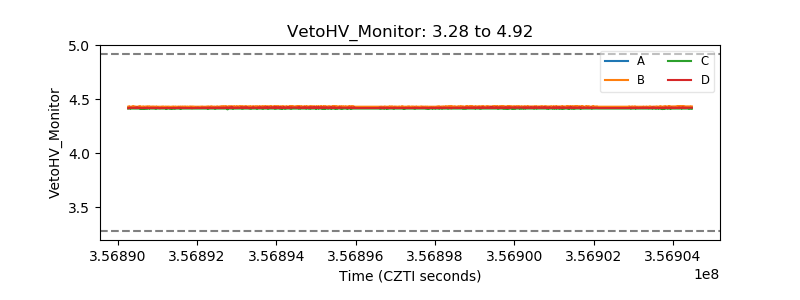 |
| Veto LLD | 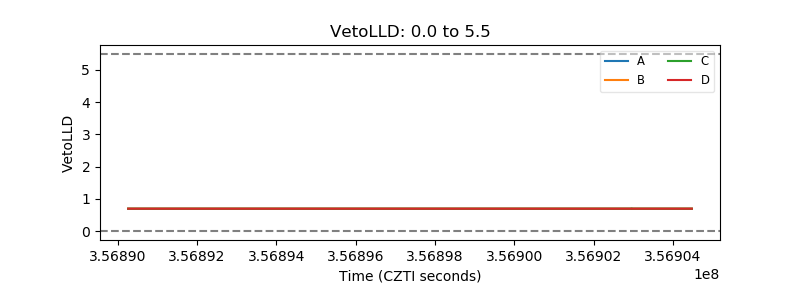 |
| Alpha Counter | 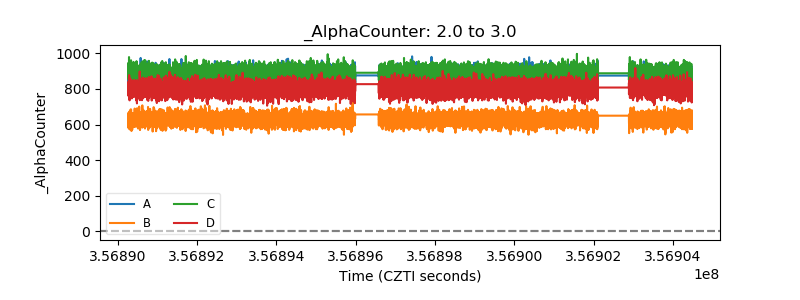 |
| _CPM_Rate | 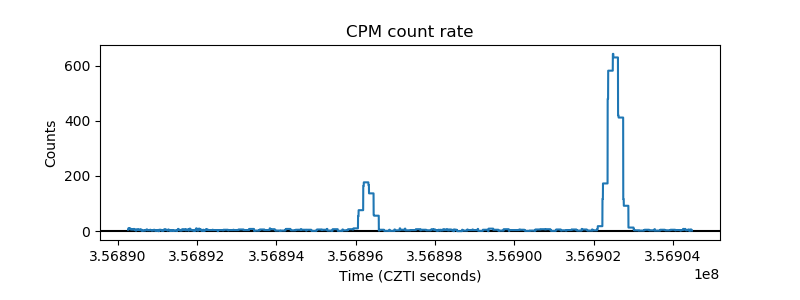 |
| CZT Counter | 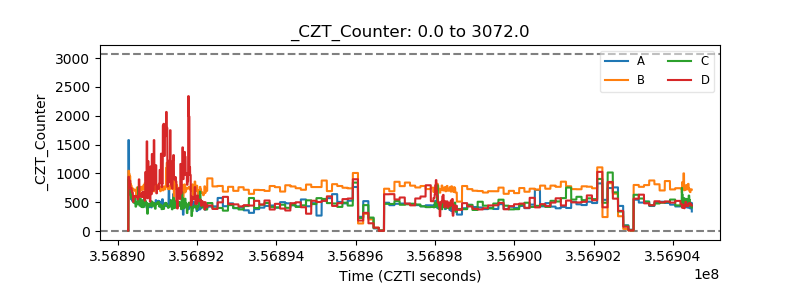 |
| +2.5 Volts monitor |  |
| +5 Volts monitor |  |
| _ROLL_ROT |  |
| _Roll_DEC |  |
| _Roll_RA | 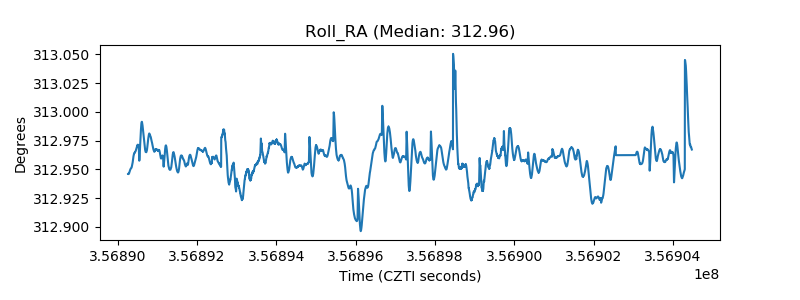 |
| Veto Counter | 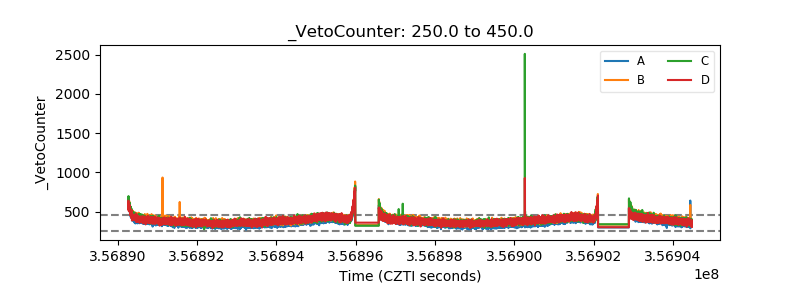 |