| Param | Original file | Final file |
|---|---|---|
| Filename | modeM0/AS1A10_097T01_9000004334_30118cztM0_level2.evt | modeM0/AS1A10_097T01_9000004334_30118cztM0_level2_quad_clean.evt |
| Size (bytes) | 513,383,040 | 114,298,560 |
| Size | 489.6 MB | 109.0 MB |
| Events in quadrant A | 3,149,208 | 765,891 |
| Events in quadrant B | 5,113,601 | 767,543 |
| Events in quadrant C | 3,521,597 | 739,067 |
| Events in quadrant D | 3,317,774 | 731,064 |
| Mode M9 | |||
|---|---|---|---|
| Quadrant | BADHDUFLAG | Total packets | Discarded packets |
| A | 0 | 12 | 0 |
| B | 0 | 13 | 0 |
| C | 0 | 13 | 0 |
| D | 0 | 13 | 0 |
| Mode SS | |||
|---|---|---|---|
| Quadrant | BADHDUFLAG | Total packets | Discarded packets |
| A | 0 | 134 | 0 |
| B | 0 | 134 | 0 |
| C | 0 | 134 | 0 |
| D | 0 | 134 | 0 |
| Mode M0 | |||
|---|---|---|---|
| Quadrant | BADHDUFLAG | Total packets | Discarded packets |
| A | 0 | 13569 | 2 |
| B | 0 | 19879 | 2 |
| C | 0 | 14603 | 2 |
| D | 0 | 14285 | 2 |
| Quadrant | Total seconds | Saturated seconds | Saturation percentage |
|---|---|---|---|
| A | 6571 | 45 | 0.684827% |
| B | 6571 | 81 | 1.232689% |
| C | 6570 | 173 | 2.633181% |
| D | 6570 | 61 | 0.928463% |
Noise dominated data is calculated using 1-second bins in cleaned event files. If a bin has >2000 counts, and if more than 50% of those come from <1% of pixels, then it is considered to be noise-dominated and hence unusable.
| Quadrant | # 1 sec bins | Bins with >0 counts | Bins with >2000 counts | High rate bins dominated by noise | Noise dominated (total time) | Noise dominated (detector-on time) | Marked lightcurve |
|---|---|---|---|---|---|---|---|
| A | 7626 | 6572 | 3 | 3 | 0.04% | 0.05% | 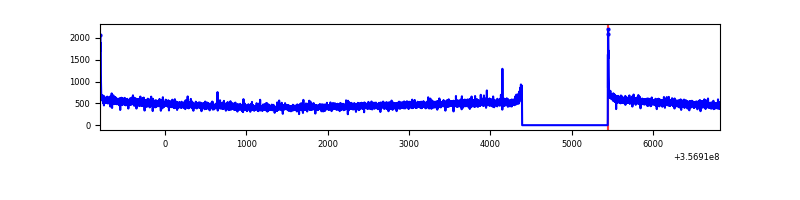 |
| B | 7626 | 6572 | 4 | 4 | 0.05% | 0.06% | 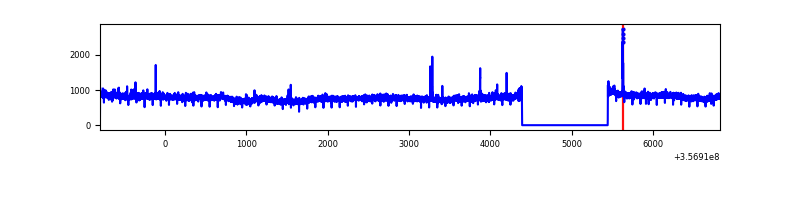 |
| C | 7625 | 6571 | 0 | 0 | 0.00% | 0.00% | 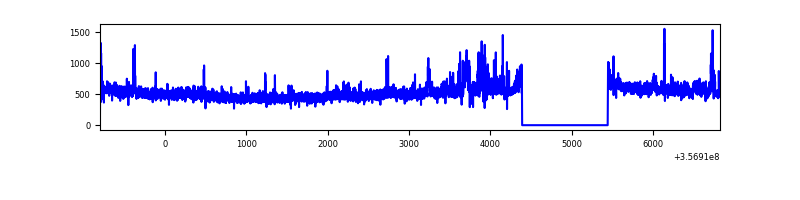 |
| D | 7625 | 6571 | 28 | 28 | 0.37% | 0.43% | 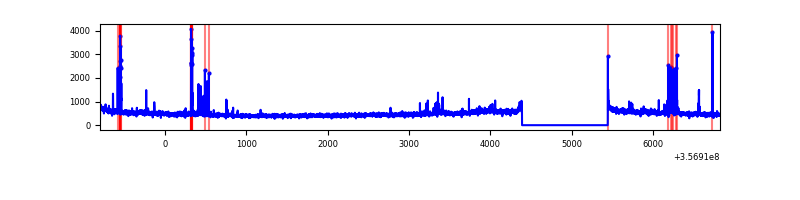 |
Top three noisy pixels from each quadrant. If the there are fewer than three noisy pixels in the level2.evt file, extra rows are filled as -1
| Pixel properties | Quadrant properties | ||||||
|---|---|---|---|---|---|---|---|
| Quadrant | DetID | PixID | Counts | Sigma | Mean | Median | Sigma |
| A | 8 | 192 | 28232 | 170.24 | 807 | 790 | 161.2 |
| A | 13 | 254 | 11940 | 69.17 | 807 | 790 | 161.2 |
| A | 3 | 137 | 8099 | 45.34 | 807 | 790 | 161.2 |
| B | 6 | 159 | 1918930 | 12504.43 | 803 | 784 | 153.4 |
| B | 0 | 190 | 20669 | 129.63 | 803 | 784 | 153.4 |
| B | 12 | 111 | 18889 | 118.03 | 803 | 784 | 153.4 |
| C | 3 | 233 | 212436 | 1166.81 | 777 | 783 | 181.4 |
| C | 14 | 238 | 157982 | 866.61 | 777 | 783 | 181.4 |
| C | 15 | 208 | 62638 | 340.99 | 777 | 783 | 181.4 |
| D | 2 | 250 | 101123 | 501.68 | 780 | 764 | 200.0 |
| D | 1 | 52 | 77321 | 382.7 | 780 | 764 | 200.0 |
| D | 8 | 195 | 63512 | 313.67 | 780 | 764 | 200.0 |
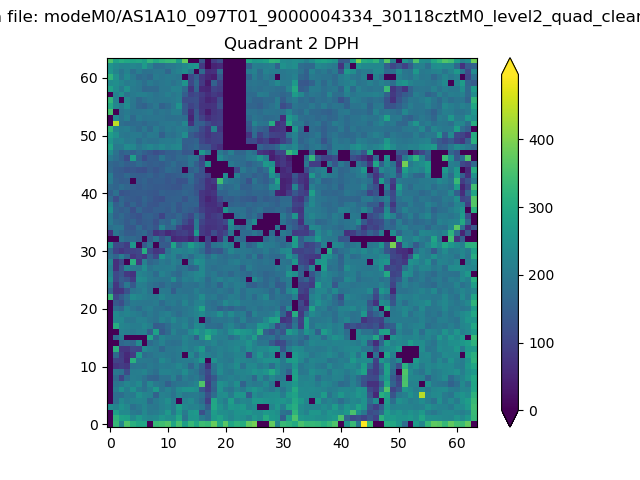
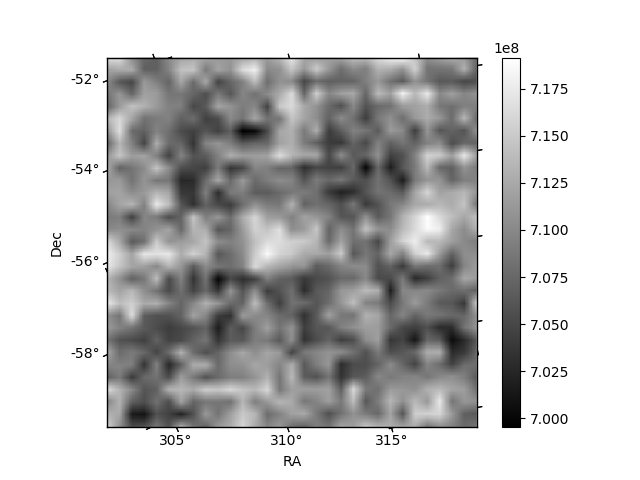
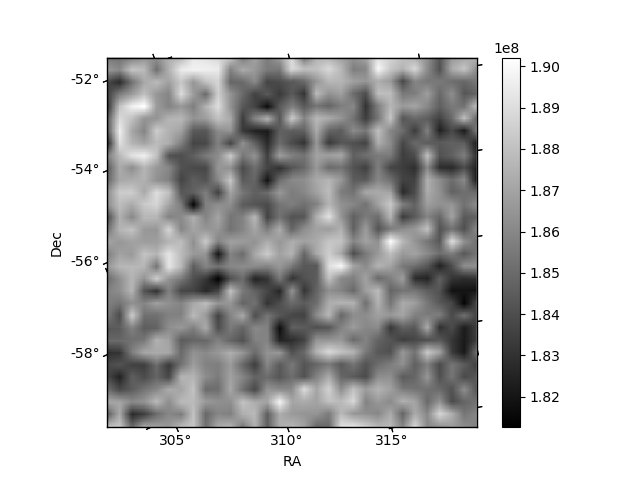
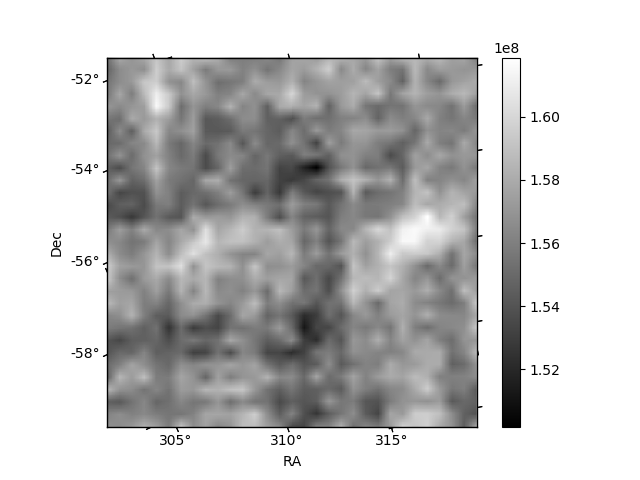
Histogram calculated using DETX and DETY for each event in the final _common_clean file
| Quadrant A | 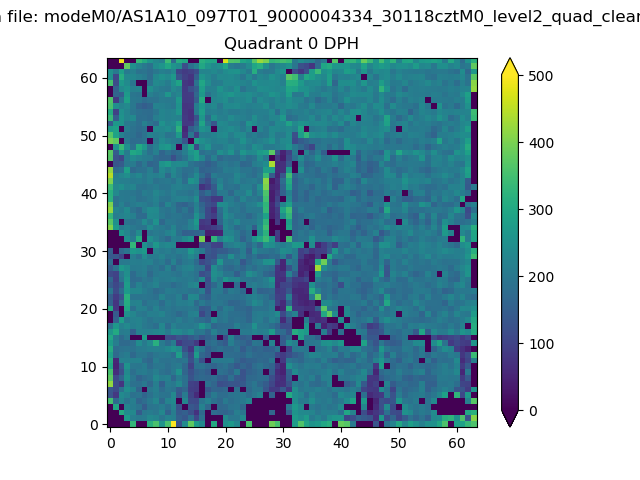 |
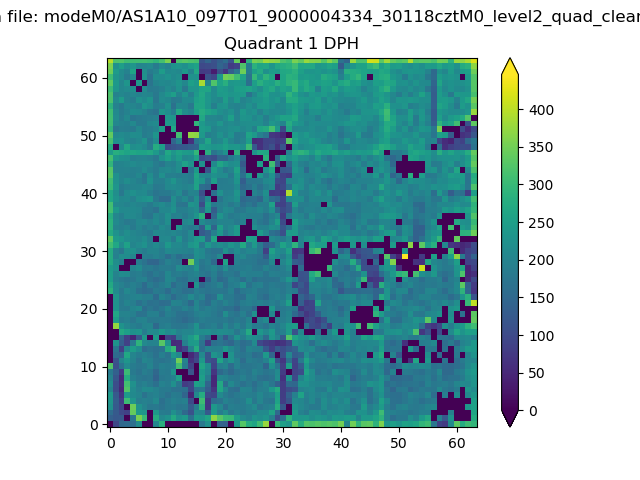 |
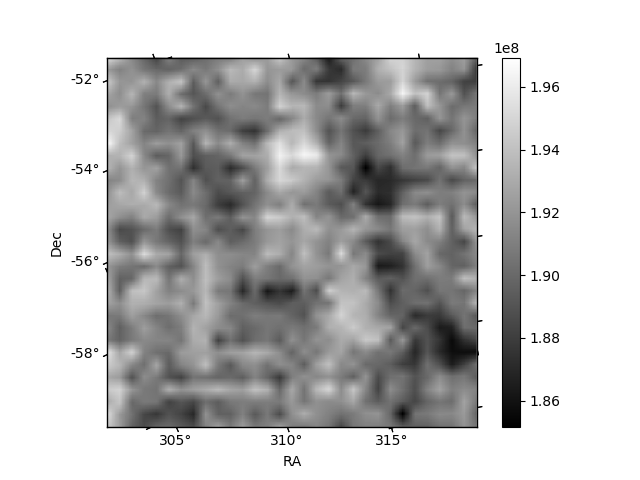
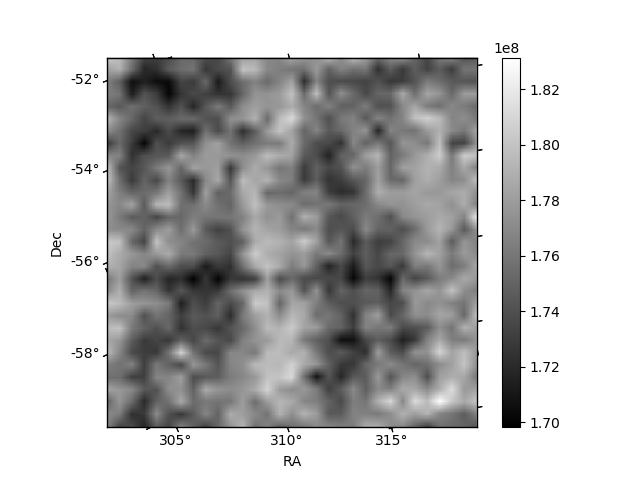
Quadrant B |
|---|---|---|---|
| Quadrant D | 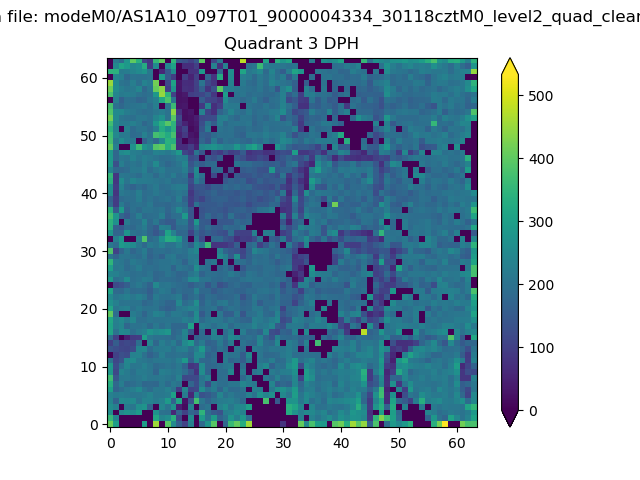 |
 |
Quadrant C |
| Plot type | Count rate plots | Images |
|---|---|---|
| Comparison with Poisson distribution Blue bars denote a histogram of data divided into 1 sec bins. Red curve is a Poisson curve with rate = median count rate of data. |
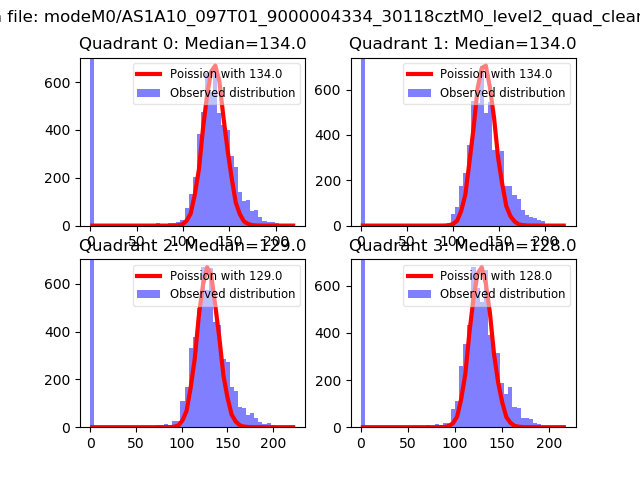 |
 |
| Quadrant-wise count rates Data is divided into 100 sec bins |
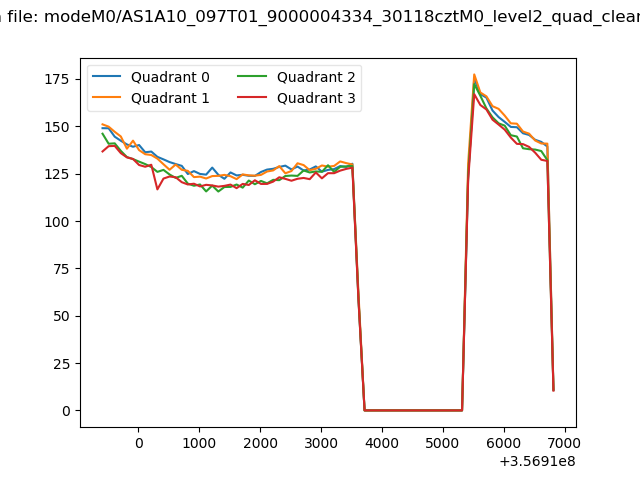 |
|
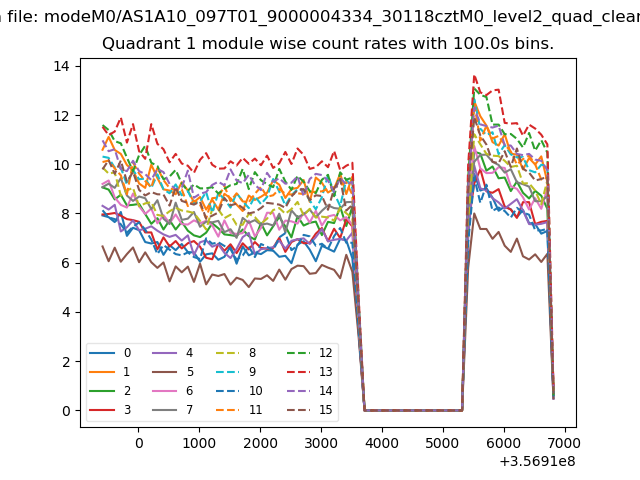
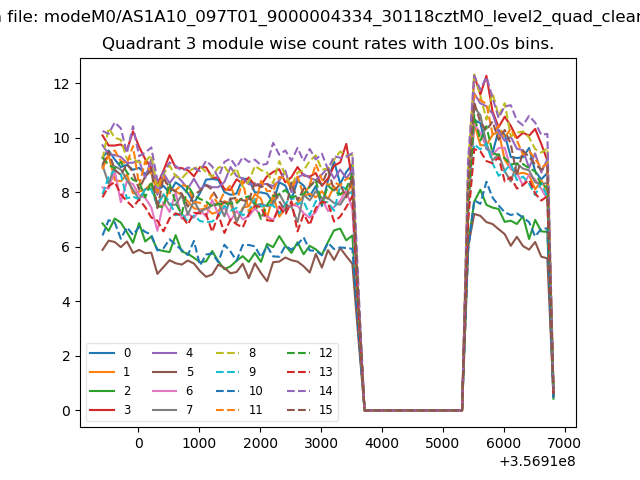
| Module-wise count rates for Quadrant A Data is divided into 100 sec bins |
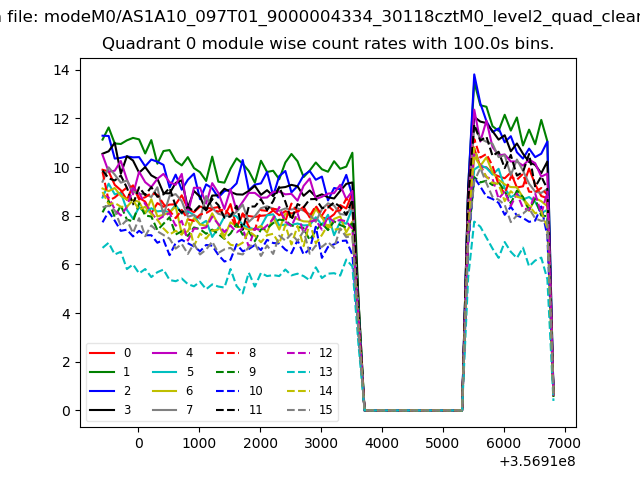 |
 |
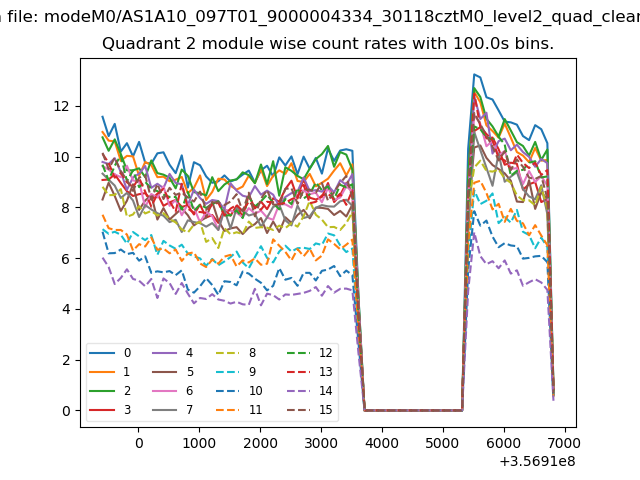
| Module-wise count rates for Quadrant B Data is divided into 100 sec bins |
 |
 |
| Module-wise count rates for Quadrant C Data is divided into 100 sec bins |
 |
 |
| Module-wise count rates for Quadrant D Data is divided into 100 sec bins |
 |
 |
| Parameter | Plot |
|---|---|
| CZT HV Monitor | 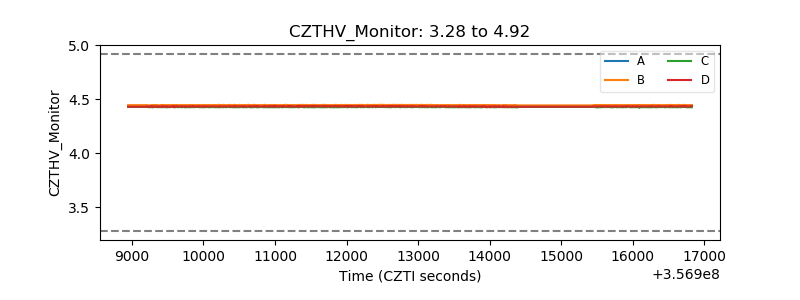 |
| D_VDD |  |
| Temperature 1 | 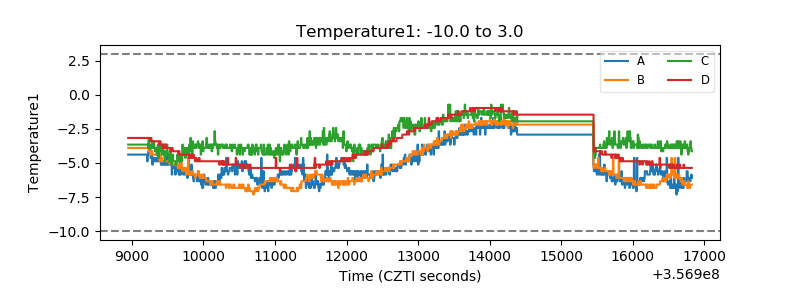 |
| Veto HV Monitor |  |
| Veto LLD | 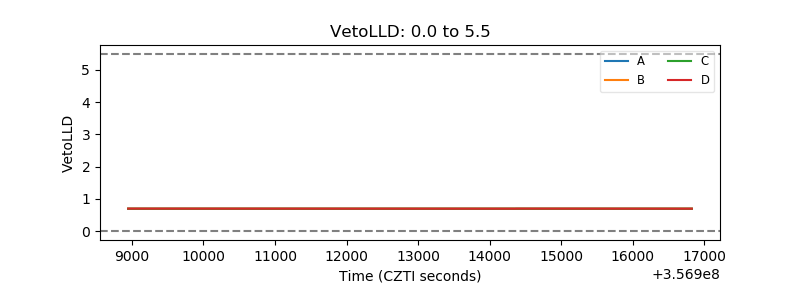 |
| Alpha Counter | 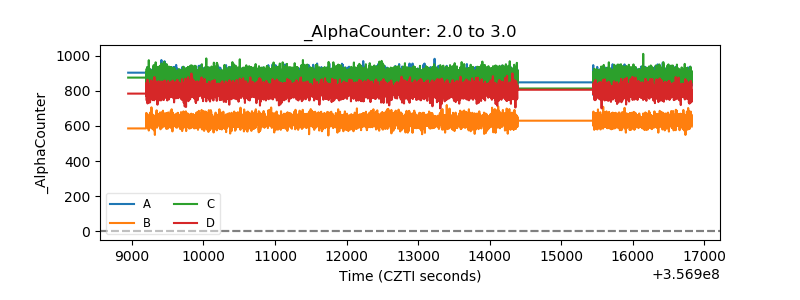 |
| _CPM_Rate | 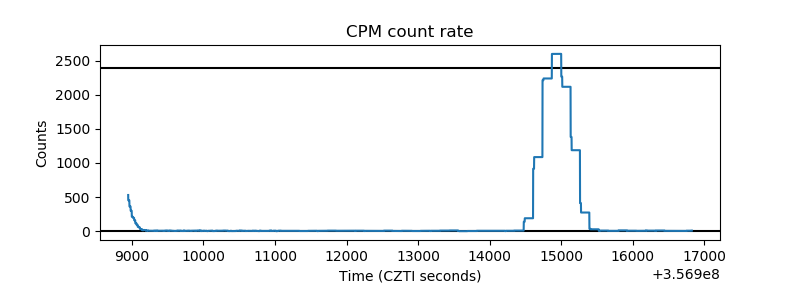 |
| CZT Counter | 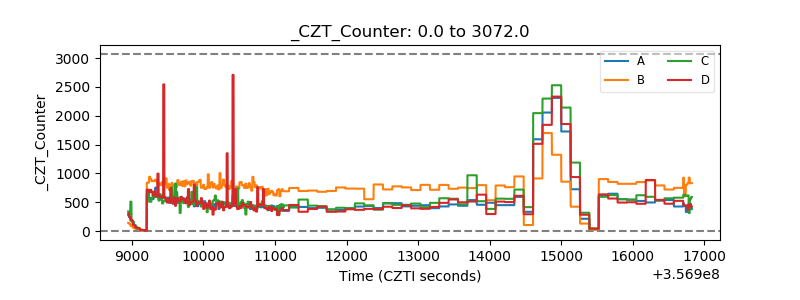 |
| +2.5 Volts monitor |  |
| +5 Volts monitor |  |
| _ROLL_ROT | 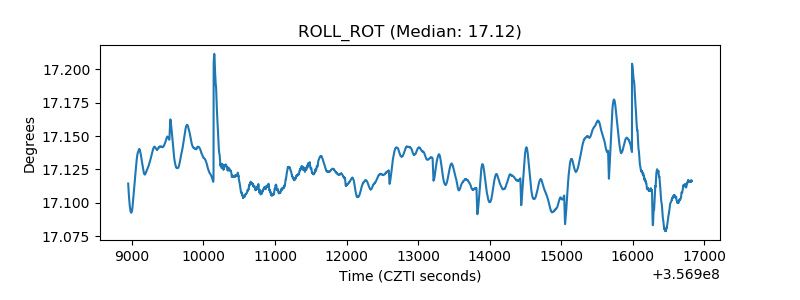 |
| _Roll_DEC | 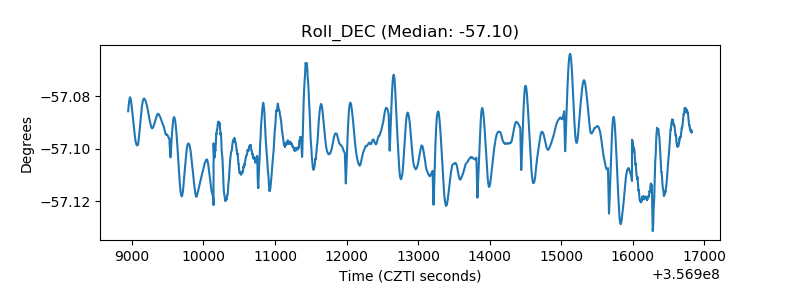 |
| _Roll_RA | 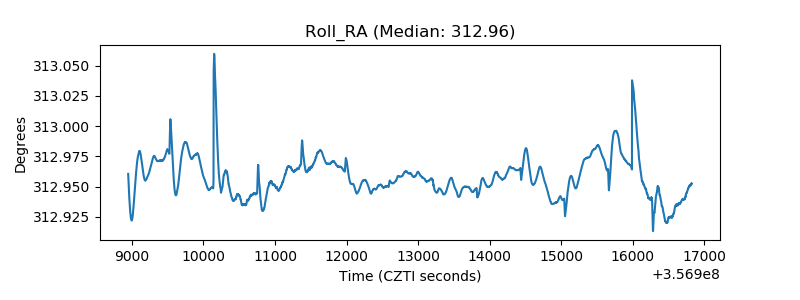 |
| Veto Counter | 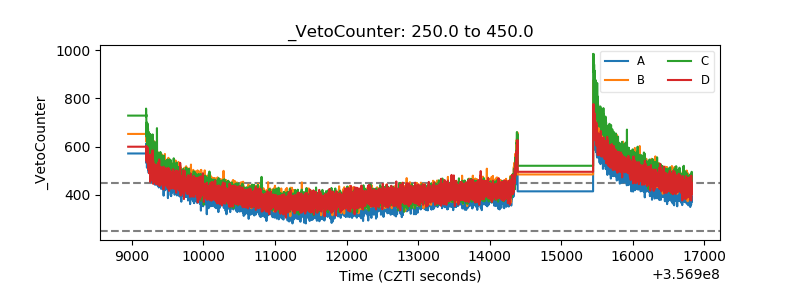 |