| Param | Original file | Final file |
|---|---|---|
| Filename | modeM0/AS1A10_097T01_9000004334_30120cztM0_level2.evt | modeM0/AS1A10_097T01_9000004334_30120cztM0_level2_quad_clean.evt |
| Size (bytes) | 538,868,160 | 116,821,440 |
| Size | 513.9 MB | 111.4 MB |
| Events in quadrant A | 3,169,383 | 782,070 |
| Events in quadrant B | 5,081,314 | 792,278 |
| Events in quadrant C | 3,833,217 | 765,135 |
| Events in quadrant D | 3,802,755 | 752,573 |
| Mode M9 | |||
|---|---|---|---|
| Quadrant | BADHDUFLAG | Total packets | Discarded packets |
| A | 0 | 14 | 0 |
| B | 0 | 15 | 0 |
| C | 0 | 15 | 0 |
| D | 0 | 15 | 0 |
| Mode SS | |||
|---|---|---|---|
| Quadrant | BADHDUFLAG | Total packets | Discarded packets |
| A | 0 | 130 | 0 |
| B | 0 | 130 | 0 |
| C | 0 | 130 | 0 |
| D | 0 | 130 | 0 |
| Mode M0 | |||
|---|---|---|---|
| Quadrant | BADHDUFLAG | Total packets | Discarded packets |
| A | 0 | 13448 | 2 |
| B | 0 | 19512 | 2 |
| C | 0 | 15666 | 2 |
| D | 0 | 15573 | 2 |
| Quadrant | Total seconds | Saturated seconds | Saturation percentage |
|---|---|---|---|
| A | 6394 | 29 | 0.453550% |
| B | 6394 | 61 | 0.954019% |
| C | 6394 | 123 | 1.923678% |
| D | 6394 | 73 | 1.141695% |
Noise dominated data is calculated using 1-second bins in cleaned event files. If a bin has >2000 counts, and if more than 50% of those come from <1% of pixels, then it is considered to be noise-dominated and hence unusable.
| Quadrant | # 1 sec bins | Bins with >0 counts | Bins with >2000 counts | High rate bins dominated by noise | Noise dominated (total time) | Noise dominated (detector-on time) | Marked lightcurve |
|---|---|---|---|---|---|---|---|
| A | 7584 | 6395 | 5 | 5 | 0.07% | 0.08% | 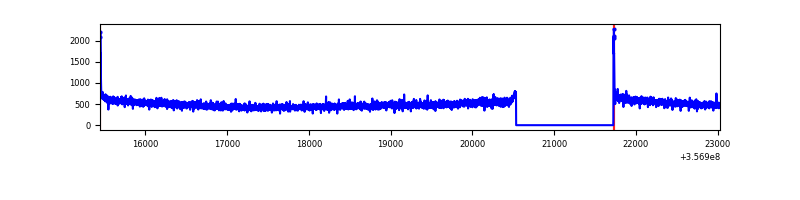 |
| B | 7584 | 6395 | 5 | 5 | 0.07% | 0.08% | 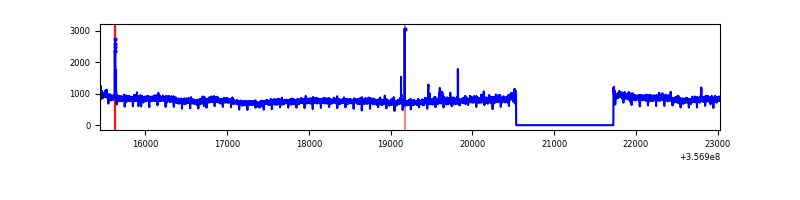 |
| C | 7584 | 6395 | 1 | 1 | 0.01% | 0.02% | 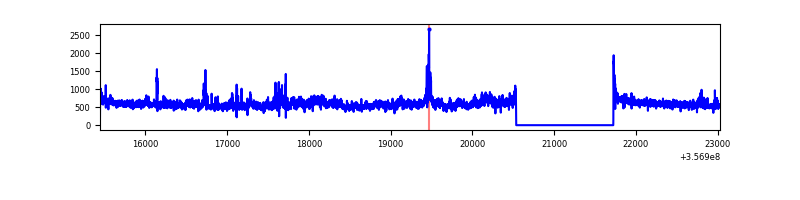 |
| D | 7584 | 6395 | 14 | 14 | 0.18% | 0.22% | 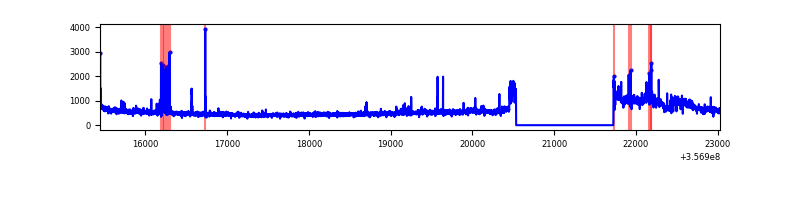 |
Top three noisy pixels from each quadrant. If the there are fewer than three noisy pixels in the level2.evt file, extra rows are filled as -1
| Pixel properties | Quadrant properties | ||||||
|---|---|---|---|---|---|---|---|
| Quadrant | DetID | PixID | Counts | Sigma | Mean | Median | Sigma |
| A | 8 | 192 | 27875 | 168.04 | 810 | 794 | 161.2 |
| A | 1 | 113 | 17130 | 101.36 | 810 | 794 | 161.2 |
| A | 13 | 254 | 11645 | 67.33 | 810 | 794 | 161.2 |
| B | 6 | 159 | 1864759 | 12168.52 | 809 | 789 | 153.2 |
| B | 0 | 190 | 27412 | 173.8 | 809 | 789 | 153.2 |
| B | 12 | 111 | 18283 | 114.21 | 809 | 789 | 153.2 |
| C | 3 | 233 | 522985 | 2820.36 | 795 | 801 | 185.1 |
| C | 14 | 238 | 147443 | 792.03 | 795 | 801 | 185.1 |
| C | 14 | 254 | 27553 | 144.49 | 795 | 801 | 185.1 |
| D | 1 | 52 | 547771 | 2682.3 | 792 | 777 | 203.9 |
| D | 2 | 250 | 71241 | 345.53 | 792 | 777 | 203.9 |
| D | 8 | 195 | 69475 | 336.87 | 792 | 777 | 203.9 |
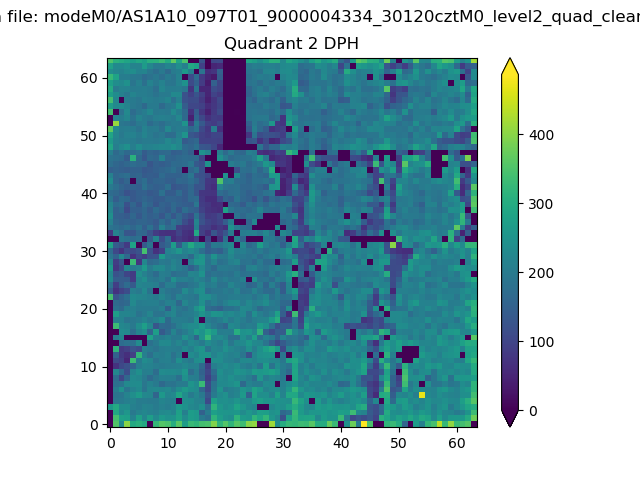
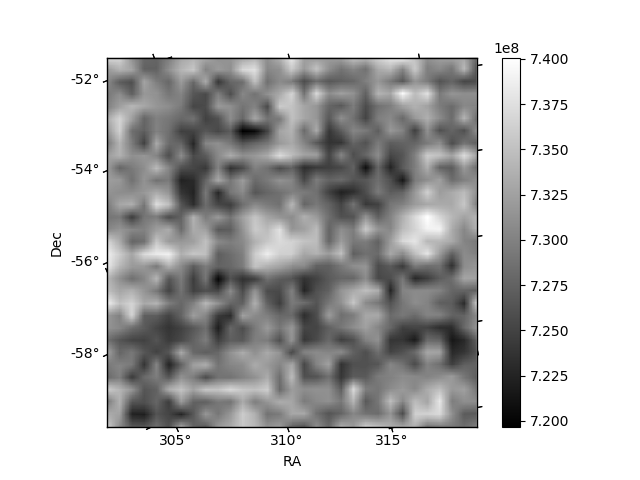
Histogram calculated using DETX and DETY for each event in the final _common_clean file
| Quadrant A | 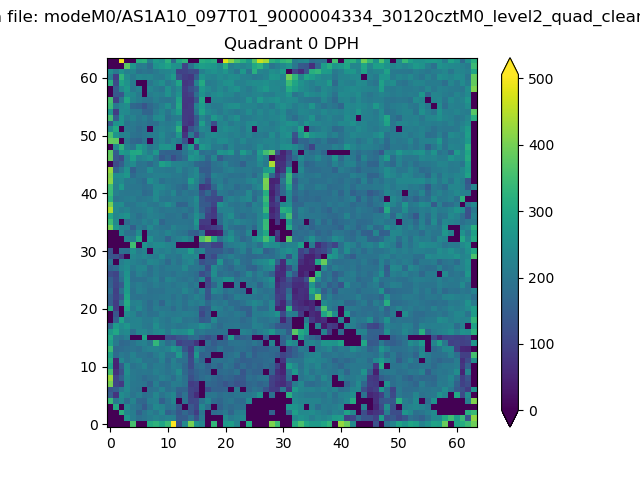 |
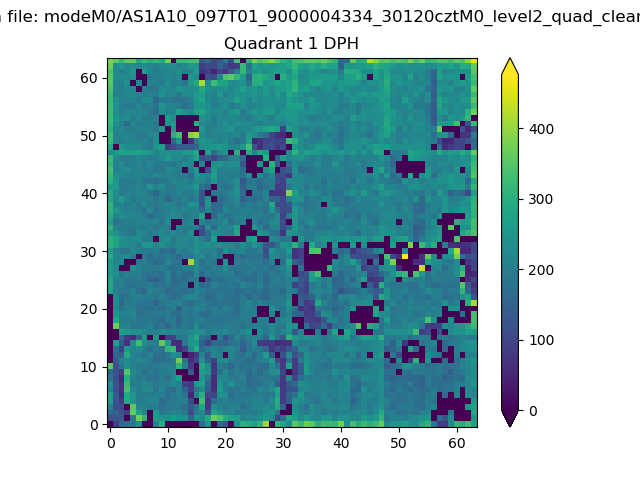 |
Quadrant B |
|---|---|---|---|
| Quadrant D | 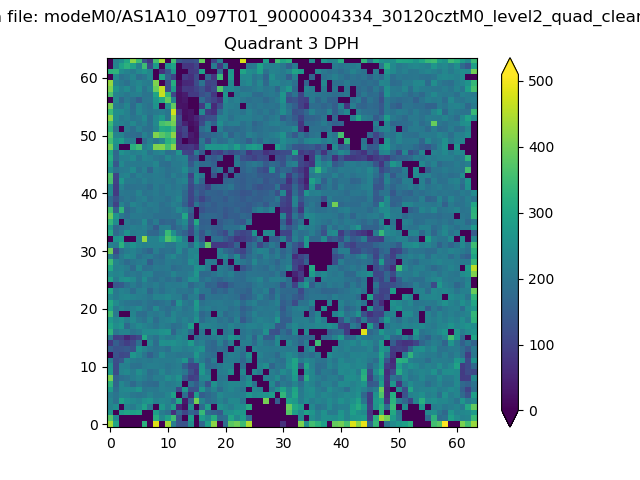 |
 |
Quadrant C |
| Plot type | Count rate plots | Images |
|---|---|---|
| Comparison with Poisson distribution Blue bars denote a histogram of data divided into 1 sec bins. Red curve is a Poisson curve with rate = median count rate of data. |
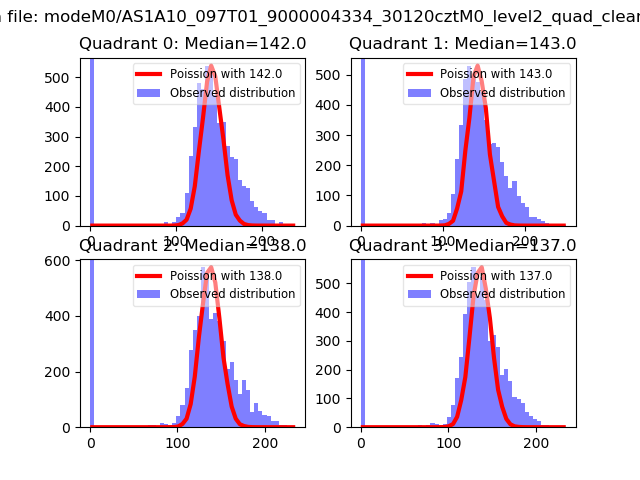 |
 |
| Quadrant-wise count rates Data is divided into 100 sec bins |
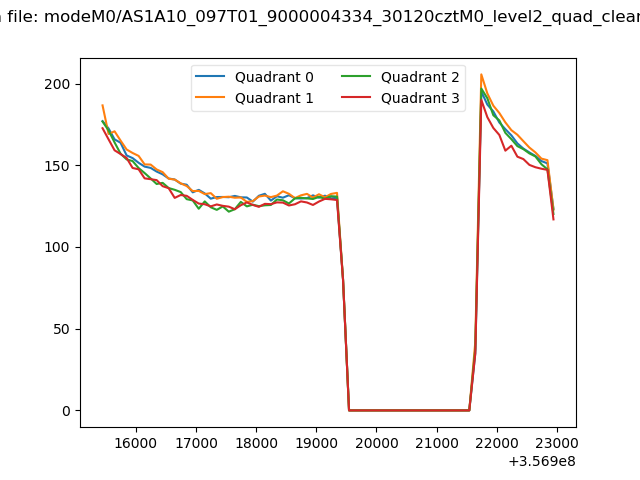 |
|
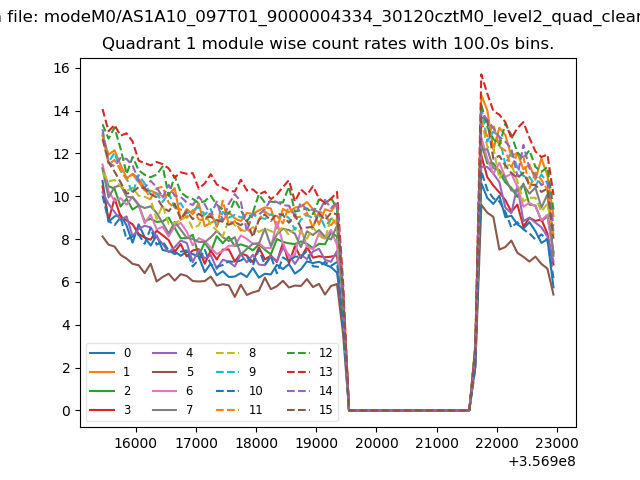
| Module-wise count rates for Quadrant A Data is divided into 100 sec bins |
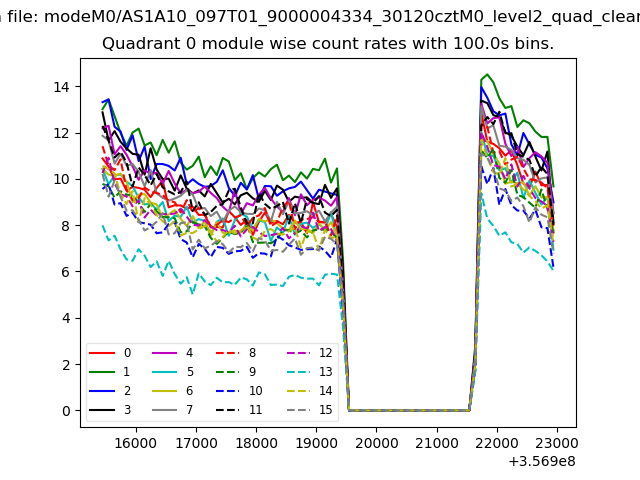 |
 |
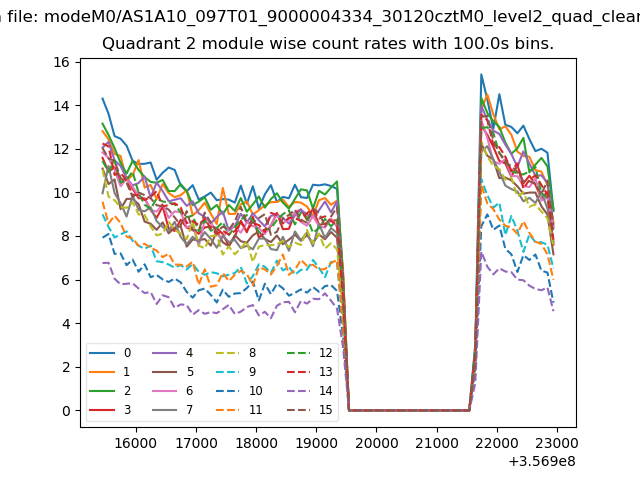
| Module-wise count rates for Quadrant B Data is divided into 100 sec bins |
 |
 |
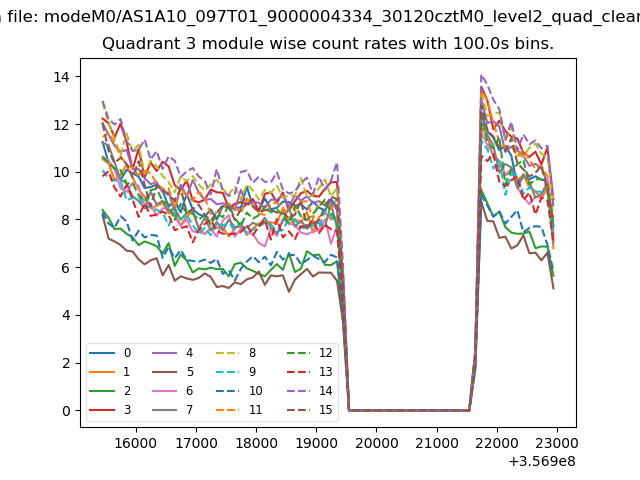
| Module-wise count rates for Quadrant C Data is divided into 100 sec bins |
 |
 |
| Module-wise count rates for Quadrant D Data is divided into 100 sec bins |
 |
 |
| Parameter | Plot |
|---|---|
| CZT HV Monitor | 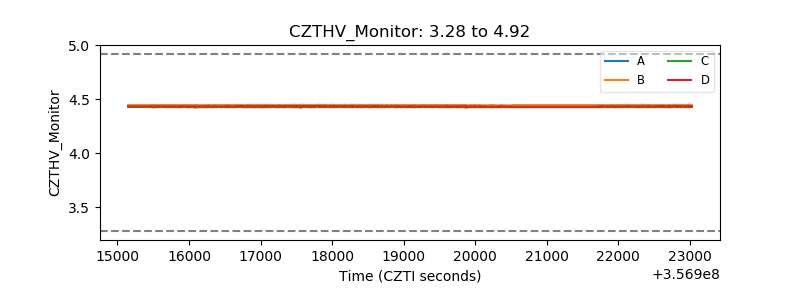 |
| D_VDD | 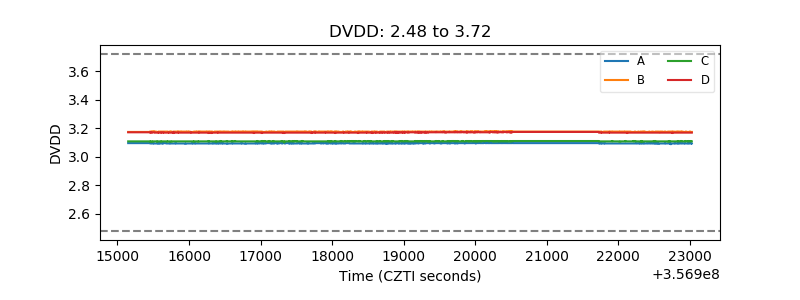 |
| Temperature 1 |  |
| Veto HV Monitor | 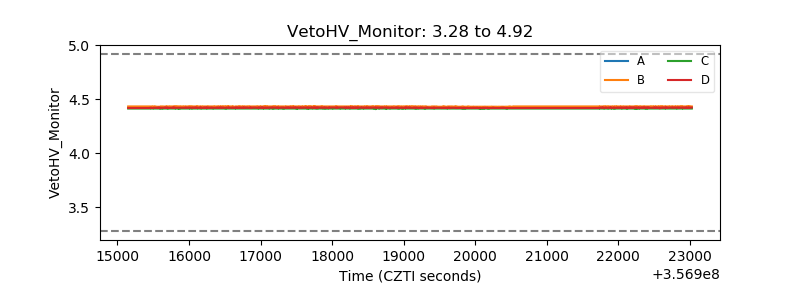 |
| Veto LLD |  |
| Alpha Counter | 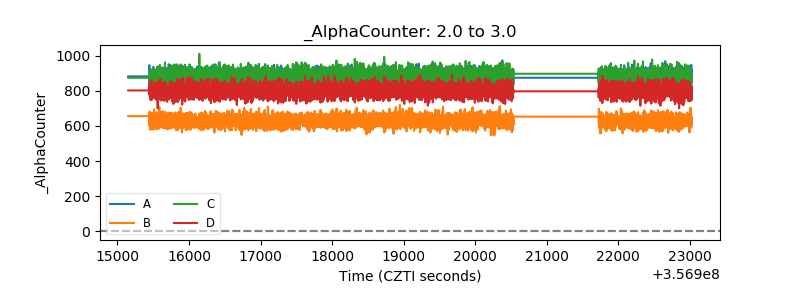 |
| _CPM_Rate | 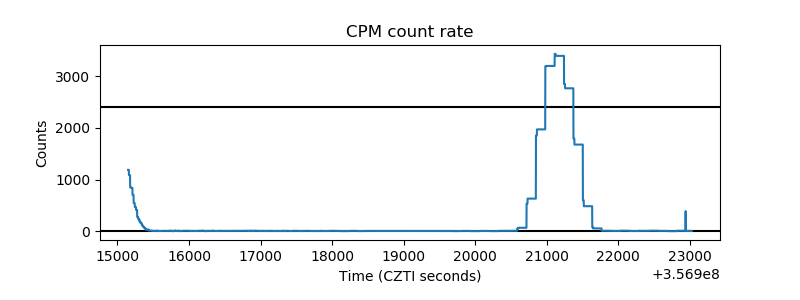 |
| CZT Counter | 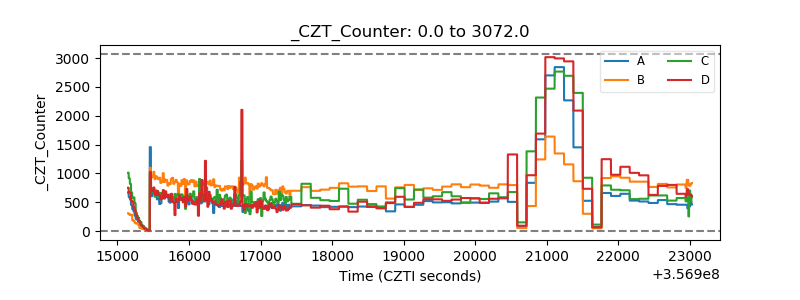 |
| +2.5 Volts monitor |  |
| +5 Volts monitor |  |
| _ROLL_ROT | 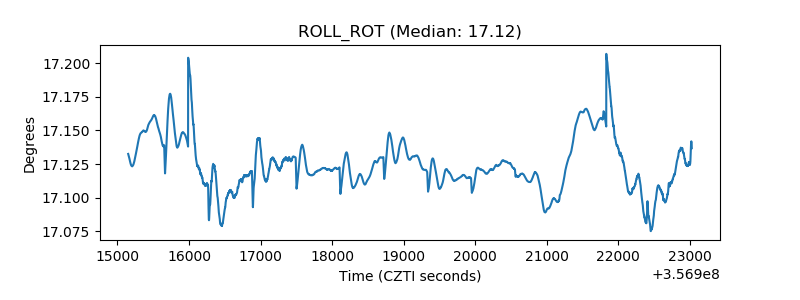 |
| _Roll_DEC | 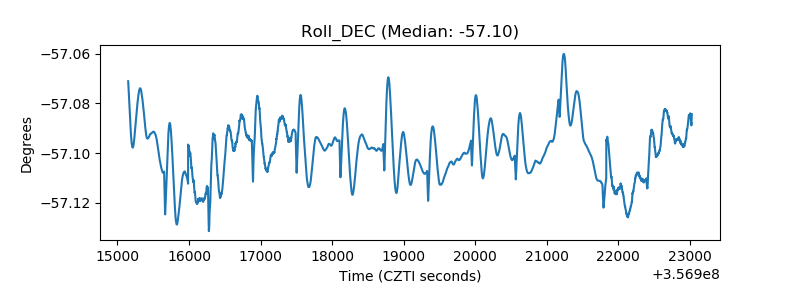 |
| _Roll_RA | 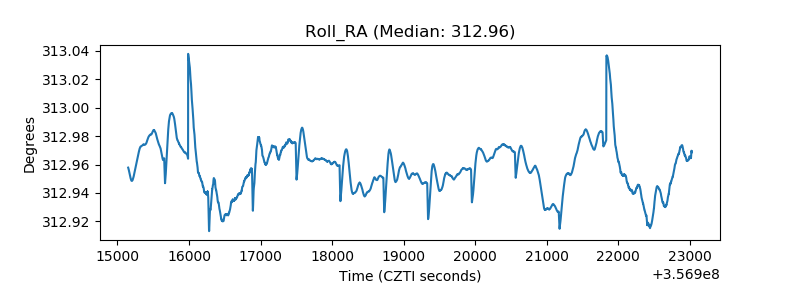 |
| Veto Counter | 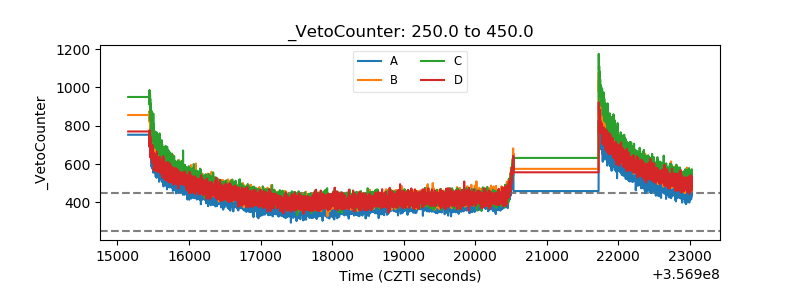 |