| Param | Original file | Final file |
|---|---|---|
| Filename | modeM0/AS1A10_097T01_9000004334_30121cztM0_level2.evt | modeM0/AS1A10_097T01_9000004334_30121cztM0_level2_quad_clean.evt |
| Size (bytes) | 582,822,720 | 114,361,920 |
| Size | 555.8 MB | 109.1 MB |
| Events in quadrant A | 3,168,003 | 761,070 |
| Events in quadrant B | 5,036,105 | 774,402 |
| Events in quadrant C | 3,652,242 | 758,766 |
| Events in quadrant D | 5,373,541 | 734,491 |
| Mode M9 | |||
|---|---|---|---|
| Quadrant | BADHDUFLAG | Total packets | Discarded packets |
| A | 0 | 18 | 0 |
| B | 0 | 19 | 0 |
| C | 0 | 19 | 0 |
| D | 0 | 19 | 0 |
| Mode SS | |||
|---|---|---|---|
| Quadrant | BADHDUFLAG | Total packets | Discarded packets |
| A | 0 | 126 | 0 |
| B | 0 | 126 | 0 |
| C | 0 | 126 | 0 |
| D | 0 | 126 | 0 |
| Mode M0 | |||
|---|---|---|---|
| Quadrant | BADHDUFLAG | Total packets | Discarded packets |
| A | 0 | 13259 | 2 |
| B | 0 | 19160 | 2 |
| C | 0 | 14925 | 2 |
| D | 0 | 20150 | 2 |
| Quadrant | Total seconds | Saturated seconds | Saturation percentage |
|---|---|---|---|
| A | 6234 | 29 | 0.465191% |
| B | 6234 | 55 | 0.882259% |
| C | 6234 | 103 | 1.652230% |
| D | 6234 | 98 | 1.572024% |
Noise dominated data is calculated using 1-second bins in cleaned event files. If a bin has >2000 counts, and if more than 50% of those come from <1% of pixels, then it is considered to be noise-dominated and hence unusable.
| Quadrant | # 1 sec bins | Bins with >0 counts | Bins with >2000 counts | High rate bins dominated by noise | Noise dominated (total time) | Noise dominated (detector-on time) | Marked lightcurve |
|---|---|---|---|---|---|---|---|
| A | 7519 | 6235 | 3 | 3 | 0.04% | 0.05% | 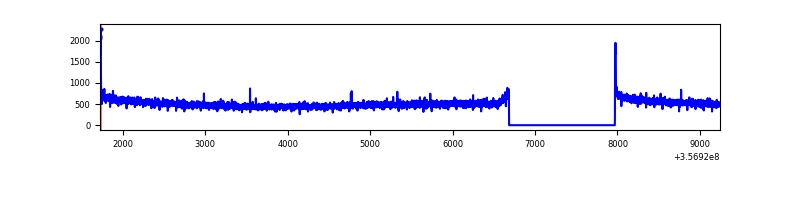 |
| B | 7519 | 6235 | 1 | 1 | 0.01% | 0.02% | 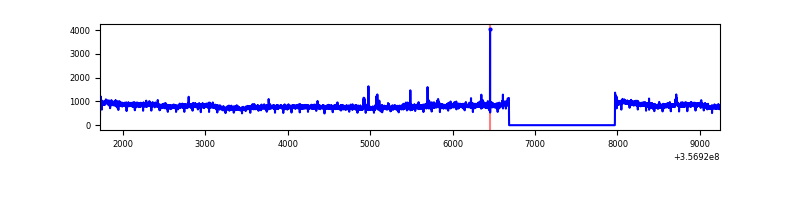 |
| C | 7519 | 6235 | 0 | 0 | 0.00% | 0.00% |  |
| D | 7519 | 6235 | 15 | 15 | 0.20% | 0.24% | 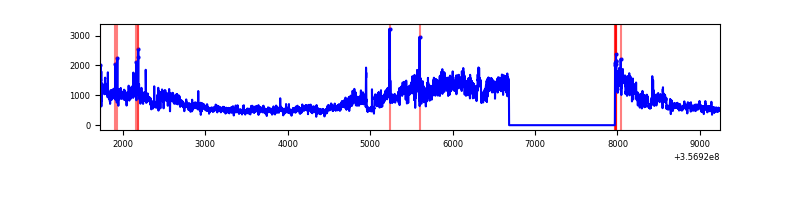 |
Top three noisy pixels from each quadrant. If the there are fewer than three noisy pixels in the level2.evt file, extra rows are filled as -1
| Pixel properties | Quadrant properties | ||||||
|---|---|---|---|---|---|---|---|
| Quadrant | DetID | PixID | Counts | Sigma | Mean | Median | Sigma |
| A | 8 | 192 | 26805 | 161.08 | 814 | 800 | 161.4 |
| A | 13 | 254 | 11535 | 66.49 | 814 | 800 | 161.4 |
| A | 3 | 137 | 7451 | 41.2 | 814 | 800 | 161.4 |
| B | 6 | 159 | 1787774 | 11771.91 | 814 | 794 | 151.8 |
| B | 0 | 190 | 47670 | 308.8 | 814 | 794 | 151.8 |
| B | 12 | 111 | 17945 | 112.98 | 814 | 794 | 151.8 |
| C | 3 | 233 | 318784 | 1702.19 | 809 | 817 | 186.8 |
| C | 14 | 238 | 144807 | 770.83 | 809 | 817 | 186.8 |
| C | 14 | 254 | 20614 | 105.98 | 809 | 817 | 186.8 |
| D | 1 | 52 | 1972554 | 9851.89 | 803 | 786 | 200.1 |
| D | 8 | 195 | 155772 | 774.38 | 803 | 786 | 200.1 |
| D | 13 | 104 | 99050 | 490.97 | 803 | 786 | 200.1 |
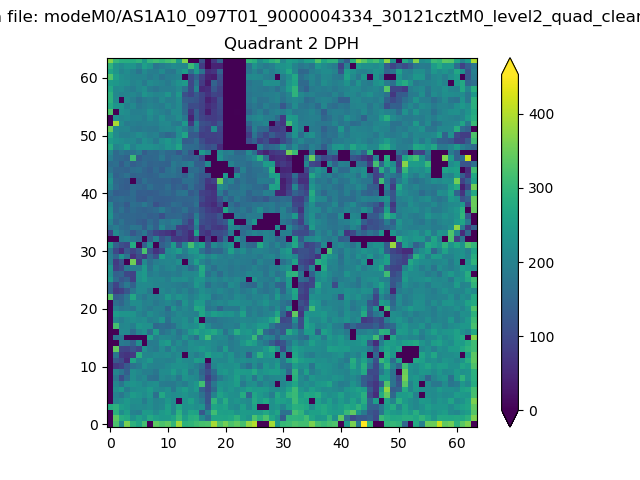
Histogram calculated using DETX and DETY for each event in the final _common_clean file
| Quadrant A | 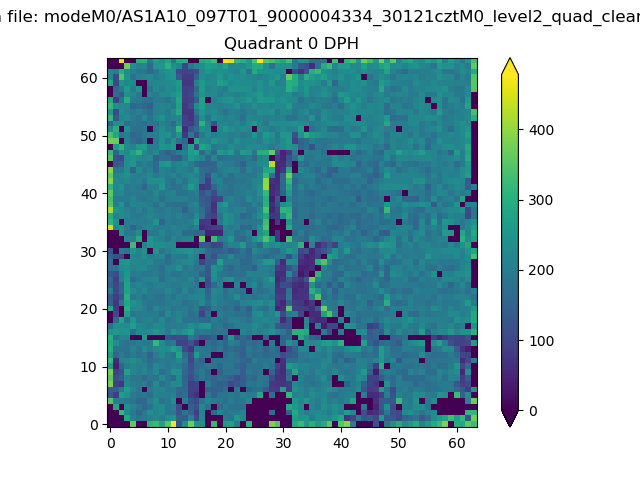 |
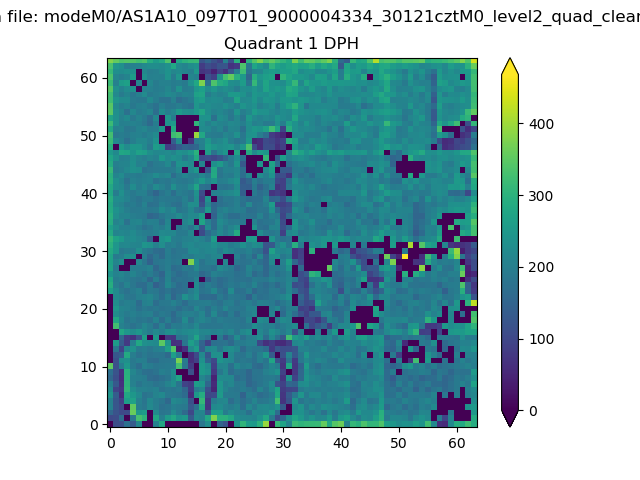 |
Quadrant B |
|---|---|---|---|
| Quadrant D | 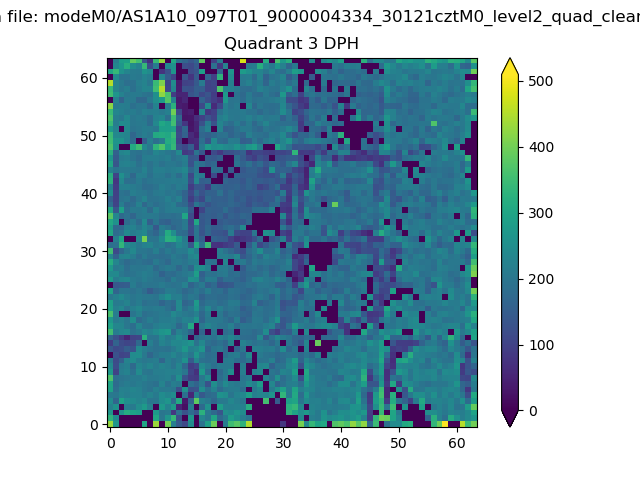 |
 |
Quadrant C |
| Plot type | Count rate plots | Images |
|---|---|---|
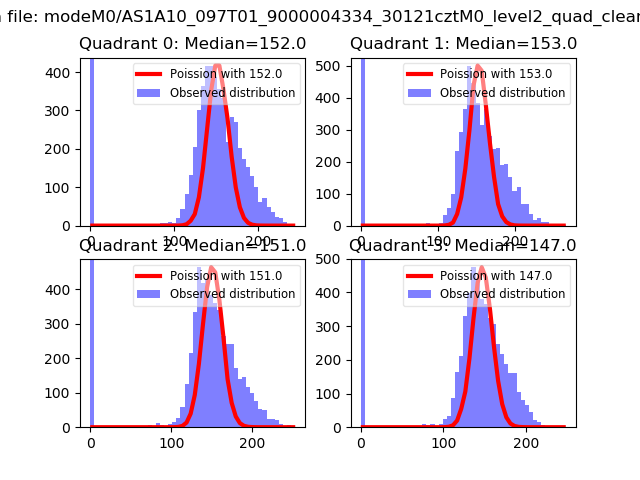
| Comparison with Poisson distribution Blue bars denote a histogram of data divided into 1 sec bins. Red curve is a Poisson curve with rate = median count rate of data. |
 |
 |
| Quadrant-wise count rates Data is divided into 100 sec bins |
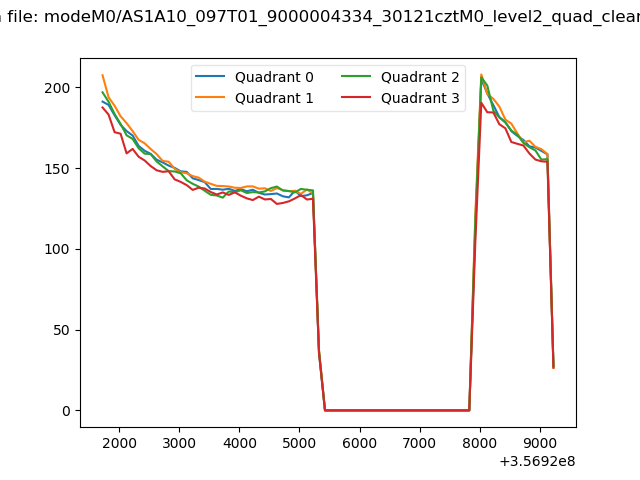 |
|
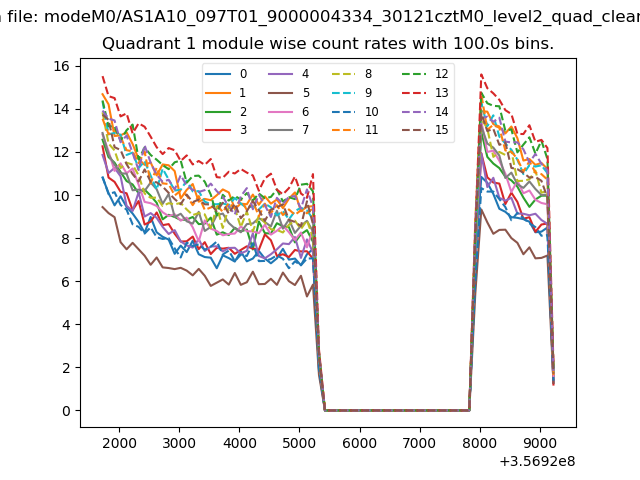
| Module-wise count rates for Quadrant A Data is divided into 100 sec bins |
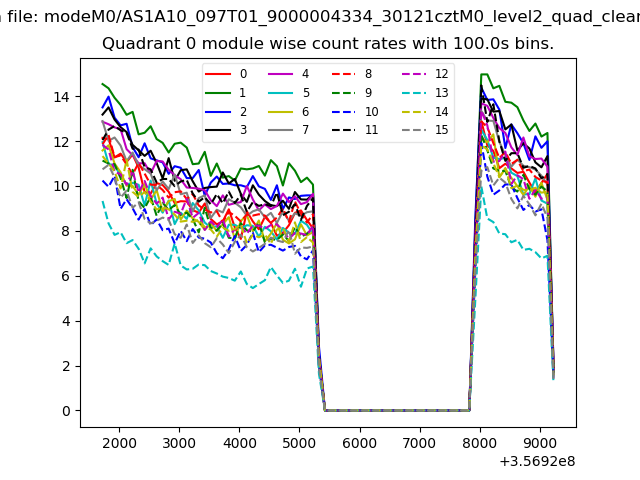 |
 |
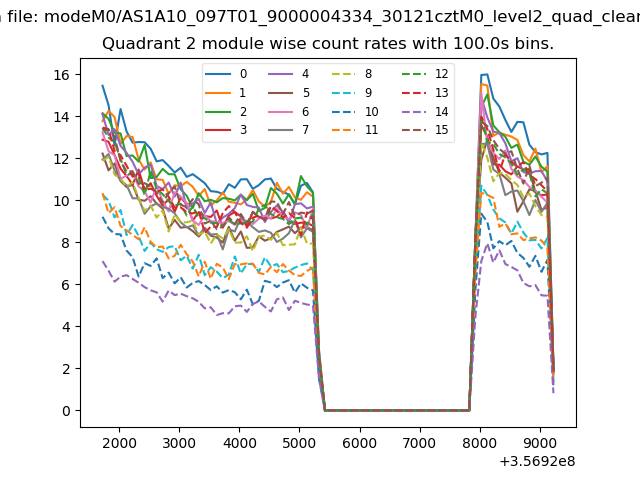
| Module-wise count rates for Quadrant B Data is divided into 100 sec bins |
 |
 |
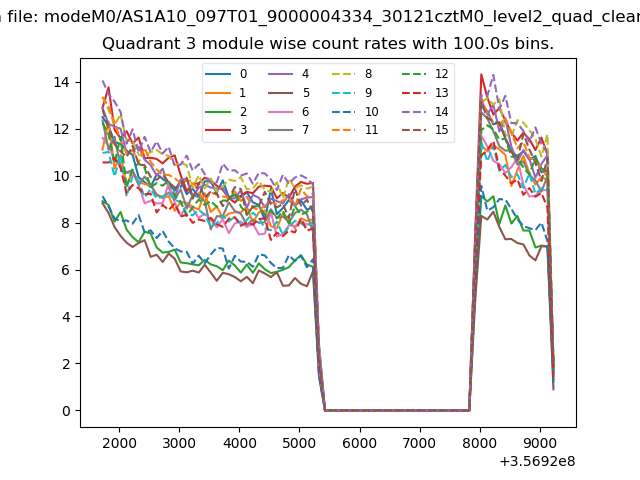
| Module-wise count rates for Quadrant C Data is divided into 100 sec bins |
 |
 |
| Module-wise count rates for Quadrant D Data is divided into 100 sec bins |
 |
 |
| Parameter | Plot |
|---|---|
| CZT HV Monitor | 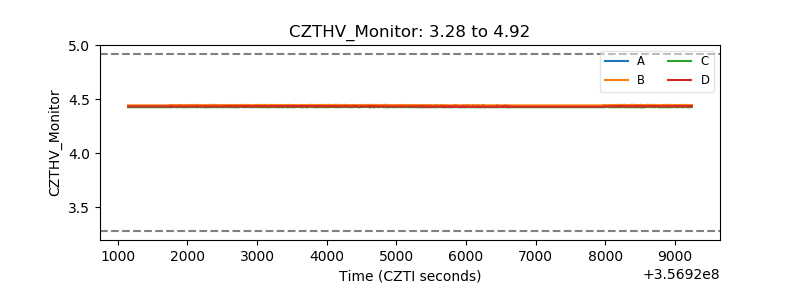 |
| D_VDD | 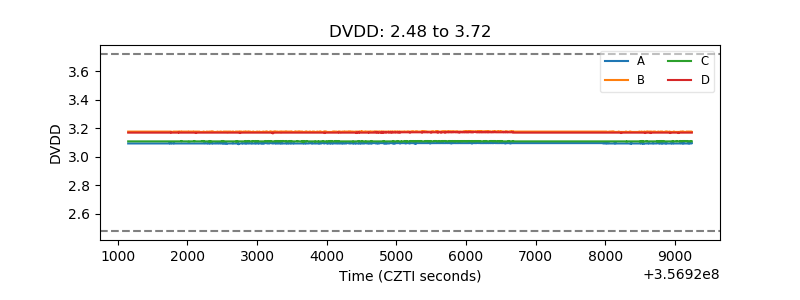 |
| Temperature 1 |  |
| Veto HV Monitor | 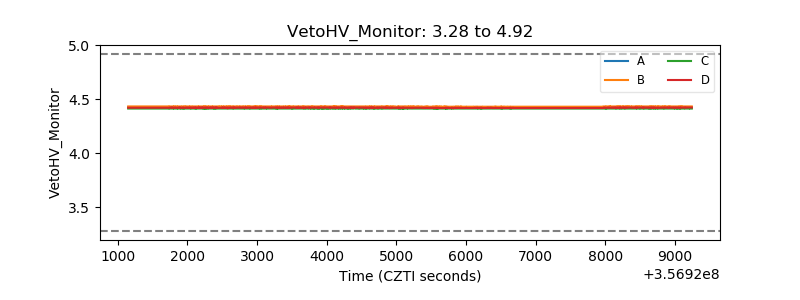 |
| Veto LLD | 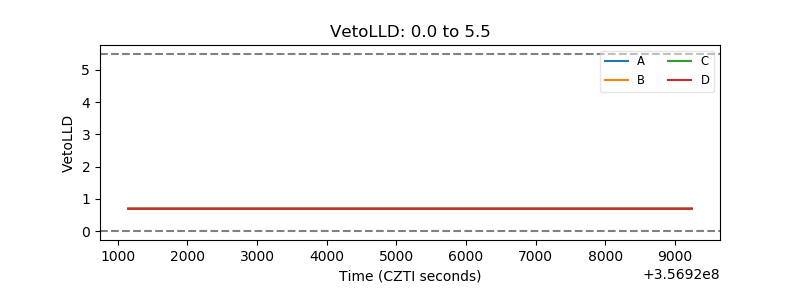 |
| Alpha Counter | 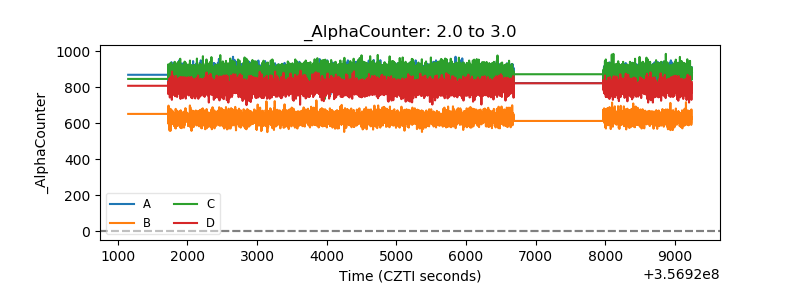 |
| _CPM_Rate | 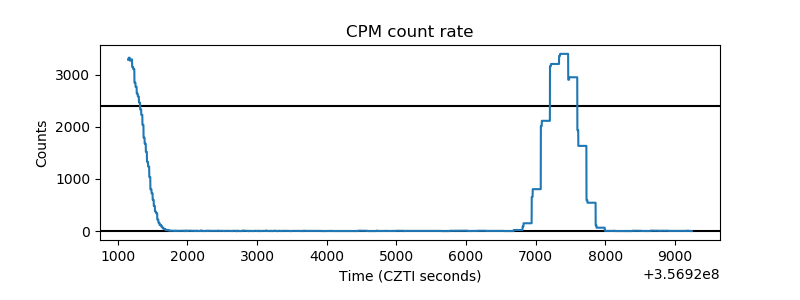 |
| CZT Counter | 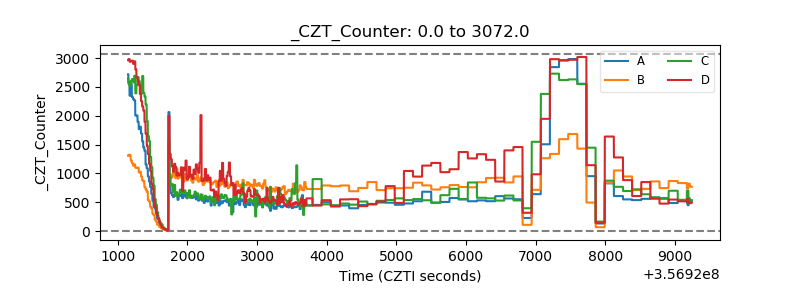 |
| +2.5 Volts monitor |  |
| +5 Volts monitor |  |
| _ROLL_ROT | 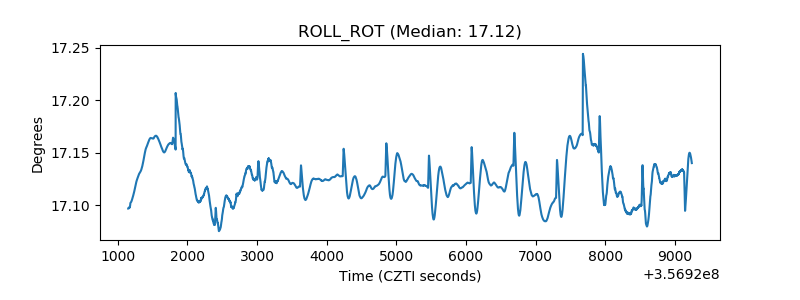 |
| _Roll_DEC | 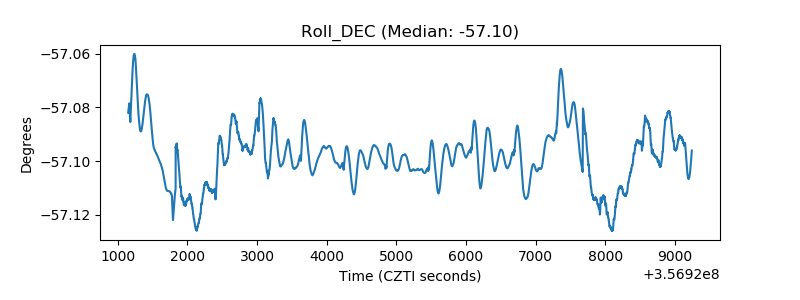 |
| _Roll_RA | 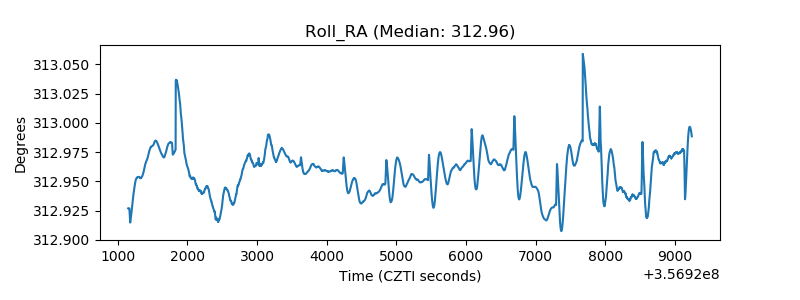 |
| Veto Counter | 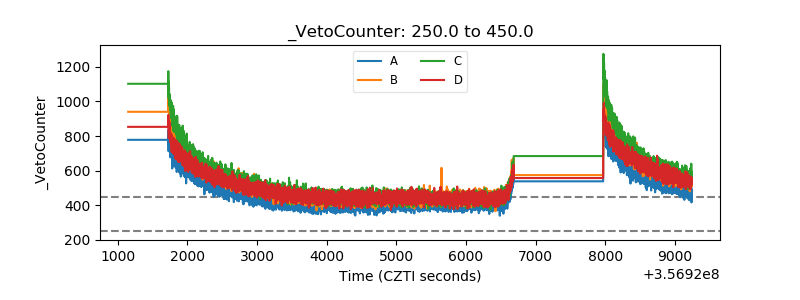 |