| Param | Original file | Final file |
|---|---|---|
| Filename | modeM0/AS1A10_097T01_9000004334_30122cztM0_level2.evt | modeM0/AS1A10_097T01_9000004334_30122cztM0_level2_quad_clean.evt |
| Size (bytes) | 535,959,360 | 112,207,680 |
| Size | 511.1 MB | 107.0 MB |
| Events in quadrant A | 3,214,054 | 746,143 |
| Events in quadrant B | 4,973,383 | 748,392 |
| Events in quadrant C | 3,800,991 | 740,646 |
| Events in quadrant D | 3,822,293 | 729,297 |
| Mode M9 | |||
|---|---|---|---|
| Quadrant | BADHDUFLAG | Total packets | Discarded packets |
| A | 0 | 13 | 0 |
| B | 0 | 13 | 0 |
| C | 0 | 13 | 0 |
| D | 0 | 13 | 0 |
| Mode SS | |||
|---|---|---|---|
| Quadrant | BADHDUFLAG | Total packets | Discarded packets |
| A | 0 | 126 | 0 |
| B | 0 | 126 | 0 |
| C | 0 | 126 | 0 |
| D | 0 | 126 | 0 |
| Mode M0 | |||
|---|---|---|---|
| Quadrant | BADHDUFLAG | Total packets | Discarded packets |
| A | 0 | 13252 | 2 |
| B | 0 | 19013 | 2 |
| C | 0 | 15397 | 2 |
| D | 0 | 15317 | 2 |
| Quadrant | Total seconds | Saturated seconds | Saturation percentage |
|---|---|---|---|
| A | 6217 | 55 | 0.884671% |
| B | 6218 | 116 | 1.865552% |
| C | 6218 | 162 | 2.605339% |
| D | 6218 | 64 | 1.029270% |
Noise dominated data is calculated using 1-second bins in cleaned event files. If a bin has >2000 counts, and if more than 50% of those come from <1% of pixels, then it is considered to be noise-dominated and hence unusable.
| Quadrant | # 1 sec bins | Bins with >0 counts | Bins with >2000 counts | High rate bins dominated by noise | Noise dominated (total time) | Noise dominated (detector-on time) | Marked lightcurve |
|---|---|---|---|---|---|---|---|
| A | 7487 | 6218 | 1 | 1 | 0.01% | 0.02% | 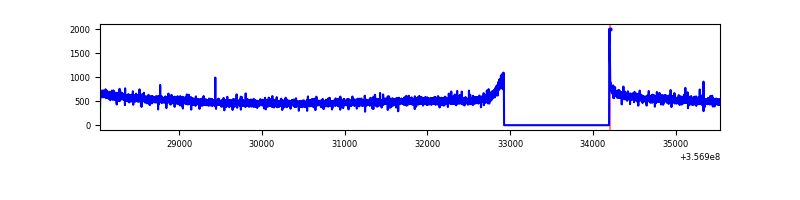 |
| B | 7488 | 6219 | 2 | 2 | 0.03% | 0.03% | 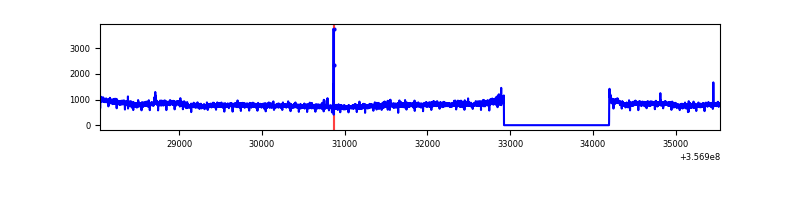 |
| C | 7488 | 6219 | 0 | 0 | 0.00% | 0.00% | 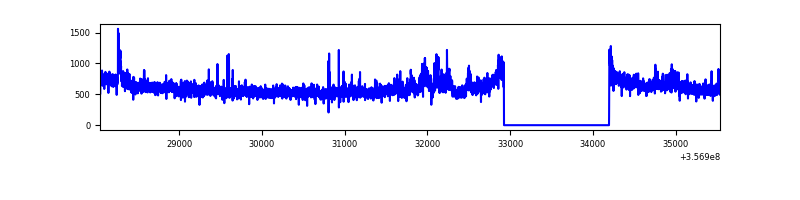 |
| D | 7488 | 6219 | 9 | 9 | 0.12% | 0.14% | 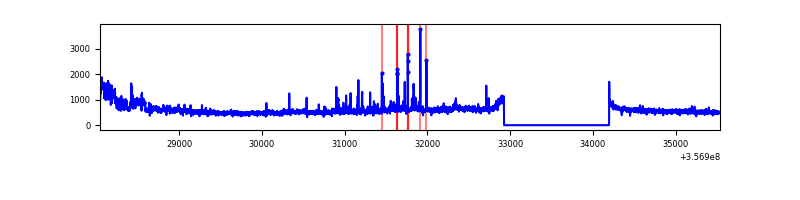 |
Top three noisy pixels from each quadrant. If the there are fewer than three noisy pixels in the level2.evt file, extra rows are filled as -1
| Pixel properties | Quadrant properties | ||||||
|---|---|---|---|---|---|---|---|
| Quadrant | DetID | PixID | Counts | Sigma | Mean | Median | Sigma |
| A | 8 | 192 | 11854 | 68.02 | 829 | 814 | 162.3 |
| A | 13 | 254 | 11772 | 67.51 | 829 | 814 | 162.3 |
| A | 3 | 137 | 7425 | 40.73 | 829 | 814 | 162.3 |
| B | 6 | 159 | 1721154 | 11296.8 | 822 | 803 | 152.3 |
| B | 0 | 190 | 19648 | 123.75 | 822 | 803 | 152.3 |
| B | 12 | 111 | 18058 | 113.31 | 822 | 803 | 152.3 |
| C | 3 | 233 | 413478 | 2174.22 | 823 | 834 | 189.8 |
| C | 14 | 238 | 140608 | 736.47 | 823 | 834 | 189.8 |
| C | 2 | 114 | 14515 | 72.09 | 823 | 834 | 189.8 |
| D | 1 | 52 | 366490 | 1829.3 | 825 | 810 | 199.9 |
| D | 8 | 195 | 162996 | 811.33 | 825 | 810 | 199.9 |
| D | 13 | 104 | 101847 | 505.43 | 825 | 810 | 199.9 |
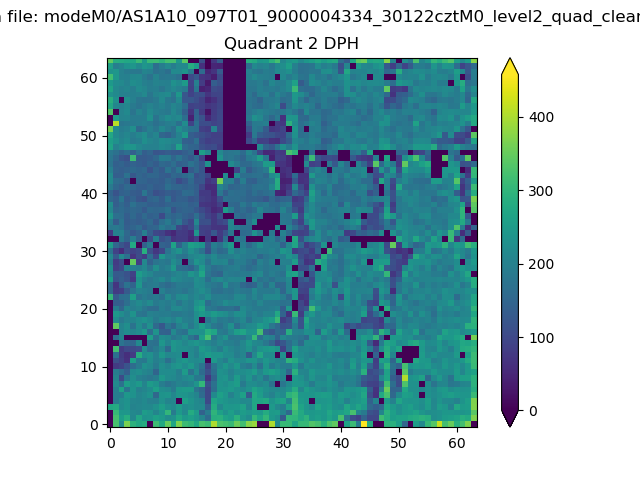
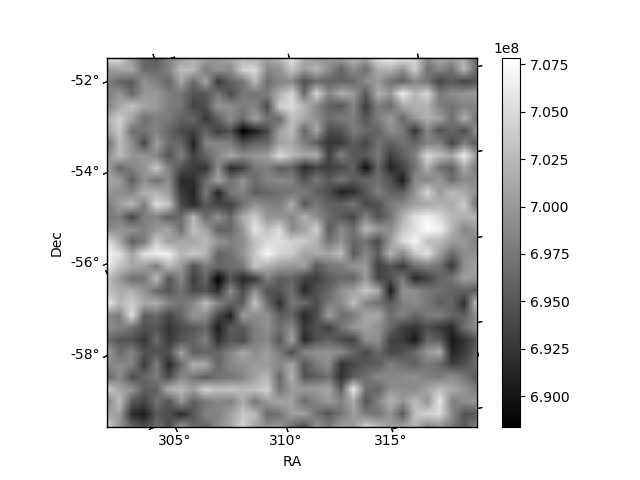
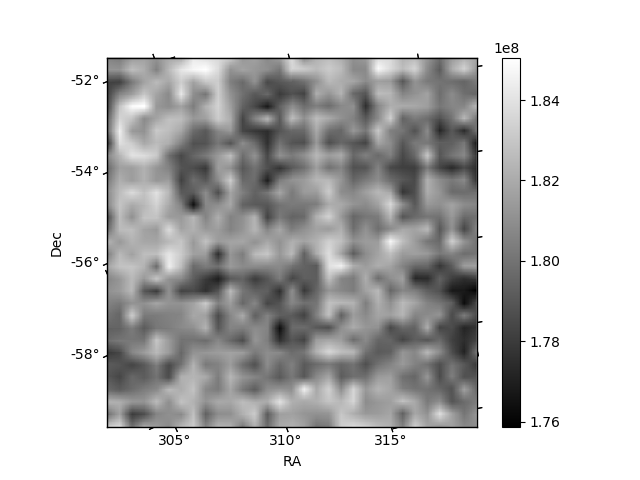
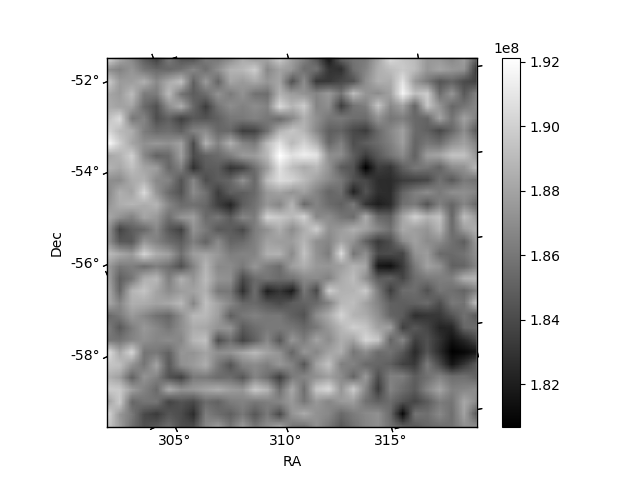
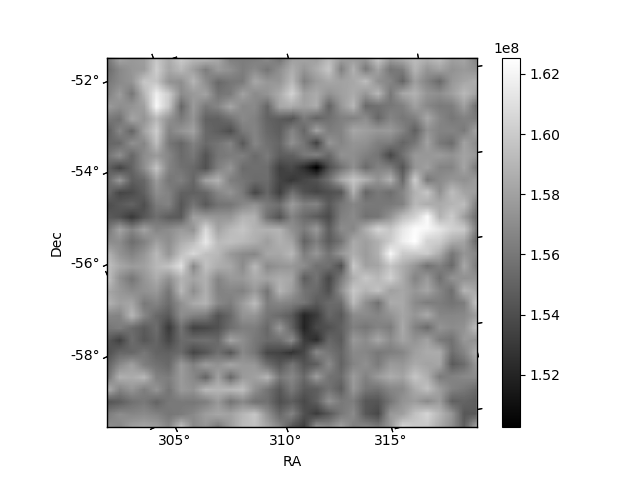
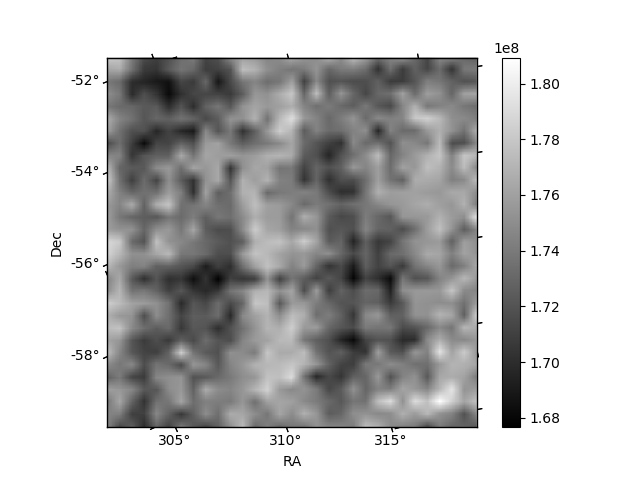
Histogram calculated using DETX and DETY for each event in the final _common_clean file
| Quadrant A | 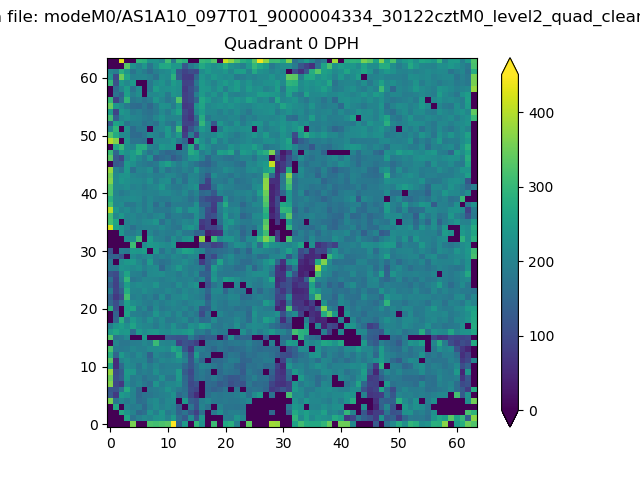 |
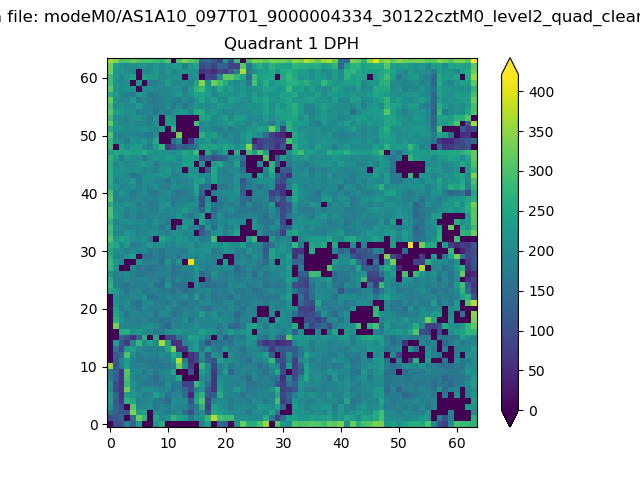 |
Quadrant B |
|---|---|---|---|
| Quadrant D | 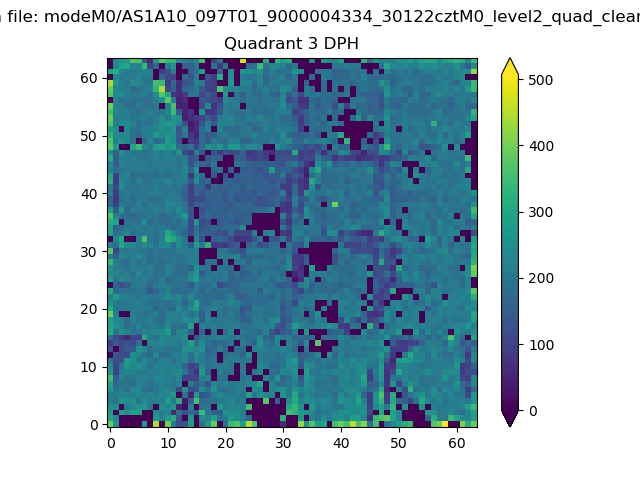 |
 |
Quadrant C |
| Plot type | Count rate plots | Images |
|---|---|---|
| Comparison with Poisson distribution Blue bars denote a histogram of data divided into 1 sec bins. Red curve is a Poisson curve with rate = median count rate of data. |
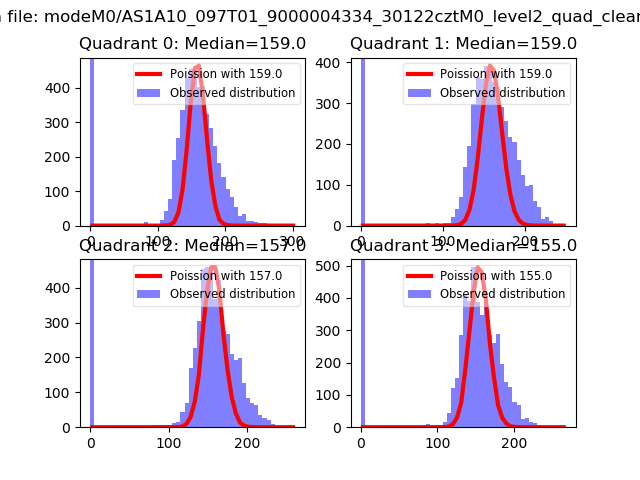 |
 |
| Quadrant-wise count rates Data is divided into 100 sec bins |
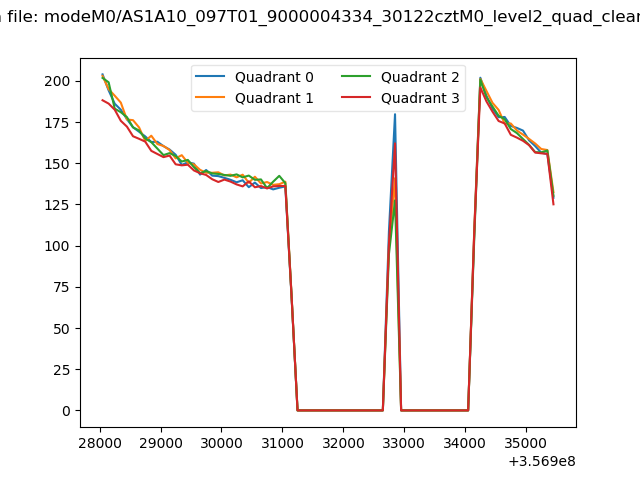 |
|
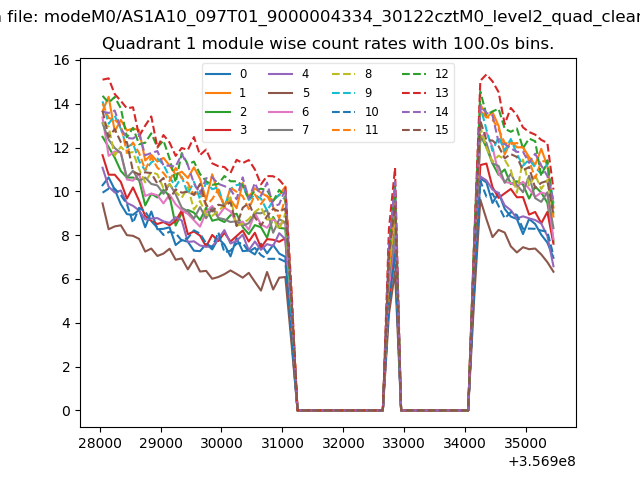
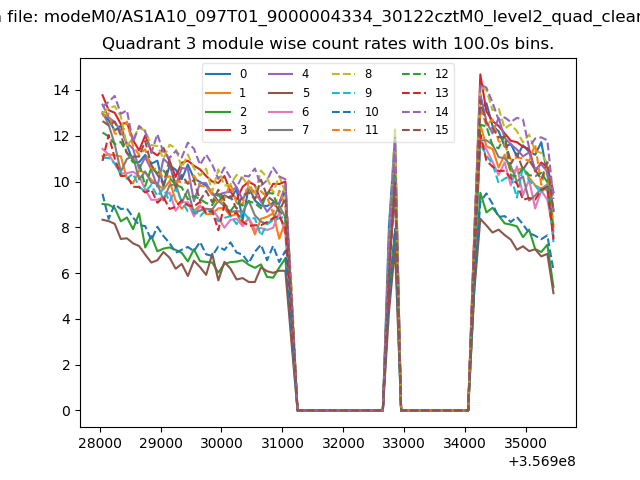
| Module-wise count rates for Quadrant A Data is divided into 100 sec bins |
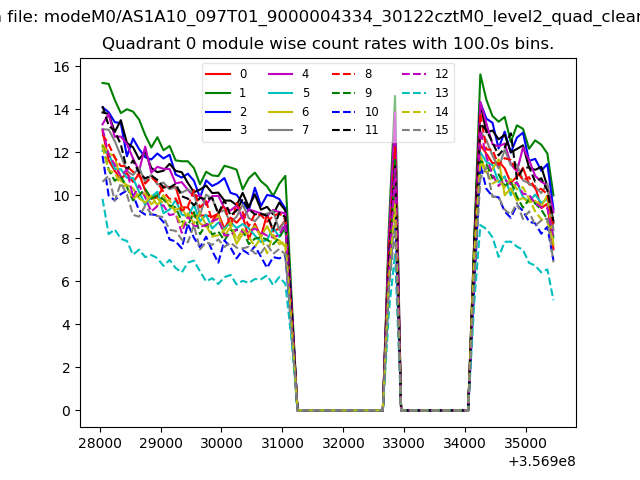 |
 |
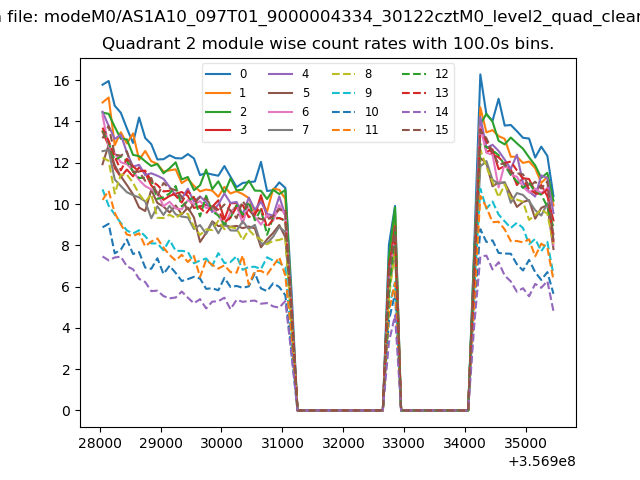
| Module-wise count rates for Quadrant B Data is divided into 100 sec bins |
 |
 |
| Module-wise count rates for Quadrant C Data is divided into 100 sec bins |
 |
 |
| Module-wise count rates for Quadrant D Data is divided into 100 sec bins |
 |
 |
| Parameter | Plot |
|---|---|
| CZT HV Monitor |  |
| D_VDD | 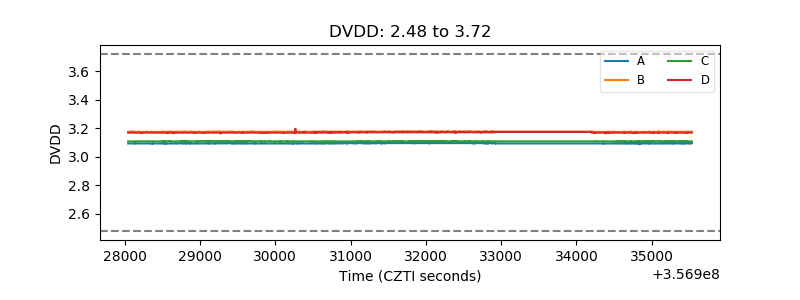 |
| Temperature 1 | 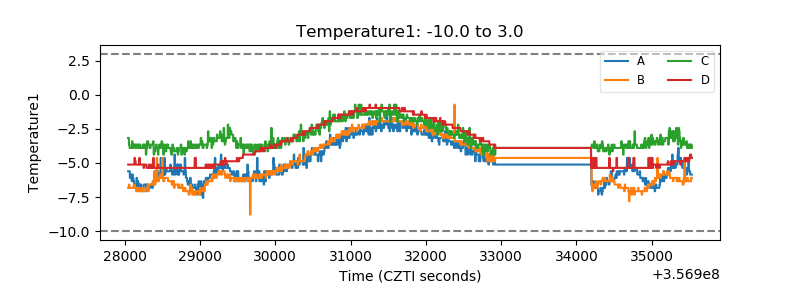 |
| Veto HV Monitor | 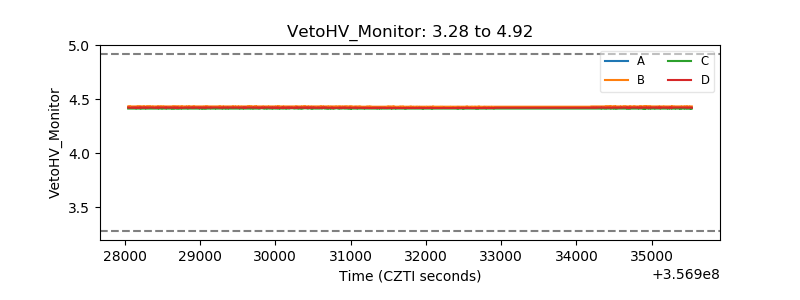 |
| Veto LLD | 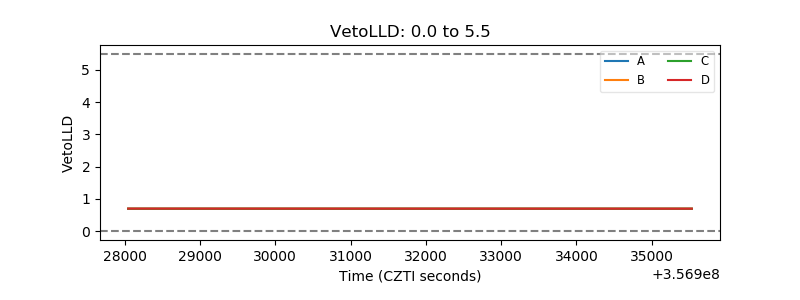 |
| Alpha Counter | 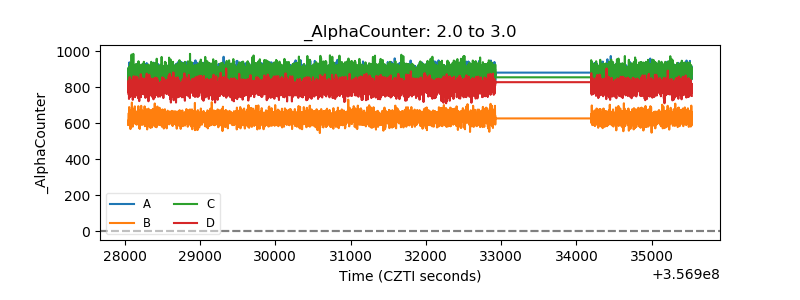 |
| _CPM_Rate | 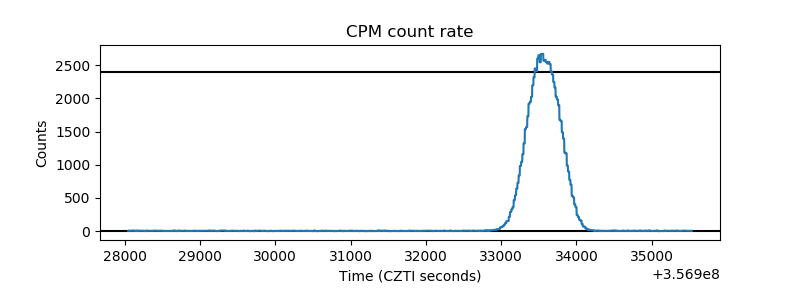 |
| CZT Counter | 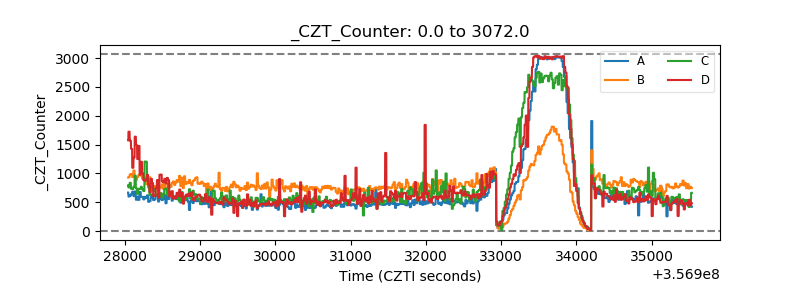 |
| +2.5 Volts monitor |  |
| +5 Volts monitor |  |
| _ROLL_ROT | 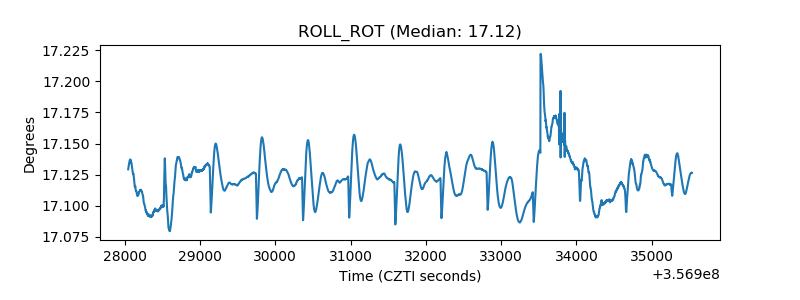 |
| _Roll_DEC | 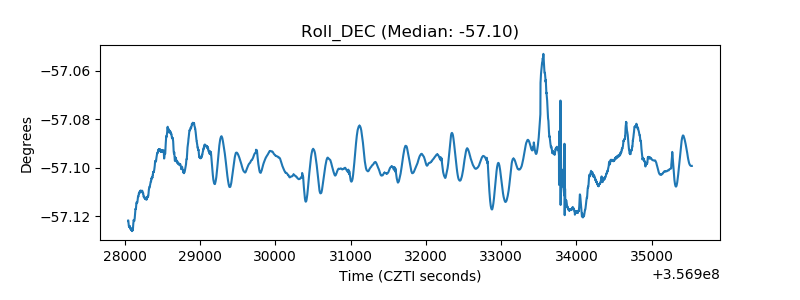 |
| _Roll_RA | 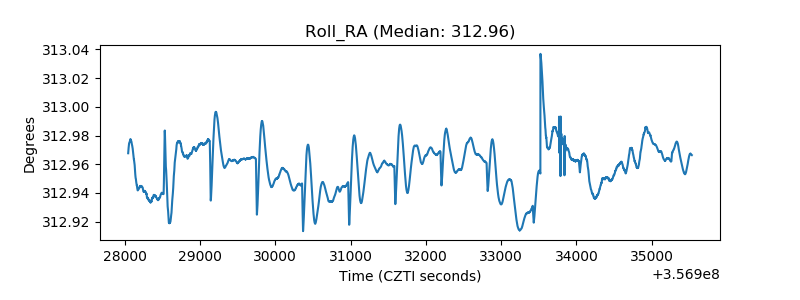 |
| Veto Counter | 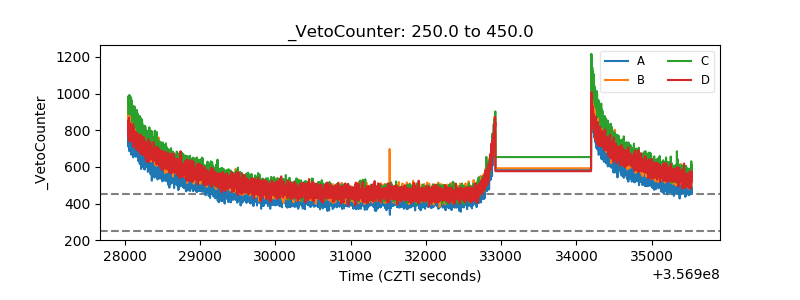 |