| Param | Original file | Final file |
|---|---|---|
| Filename | modeM0/AS1A10_097T01_9000004334_30123cztM0_level2.evt | modeM0/AS1A10_097T01_9000004334_30123cztM0_level2_quad_clean.evt |
| Size (bytes) | 544,003,200 | 113,518,080 |
| Size | 518.8 MB | 108.3 MB |
| Events in quadrant A | 3,282,106 | 755,070 |
| Events in quadrant B | 5,054,654 | 756,443 |
| Events in quadrant C | 4,112,194 | 742,528 |
| Events in quadrant D | 3,594,232 | 738,842 |
| Mode M9 | |||
|---|---|---|---|
| Quadrant | BADHDUFLAG | Total packets | Discarded packets |
| A | 0 | 15 | 0 |
| B | 0 | 16 | 0 |
| C | 0 | 16 | 0 |
| D | 0 | 16 | 0 |
| Mode SS | |||
|---|---|---|---|
| Quadrant | BADHDUFLAG | Total packets | Discarded packets |
| A | 0 | 130 | 0 |
| B | 0 | 130 | 0 |
| C | 0 | 130 | 0 |
| D | 0 | 130 | 0 |
| Mode M0 | |||
|---|---|---|---|
| Quadrant | BADHDUFLAG | Total packets | Discarded packets |
| A | 0 | 13469 | 2 |
| B | 0 | 19427 | 2 |
| C | 0 | 16467 | 2 |
| D | 0 | 14379 | 2 |
| Quadrant | Total seconds | Saturated seconds | Saturation percentage |
|---|---|---|---|
| A | 6380 | 53 | 0.830721% |
| B | 6380 | 138 | 2.163009% |
| C | 6380 | 185 | 2.899687% |
| D | 6380 | 49 | 0.768025% |
Noise dominated data is calculated using 1-second bins in cleaned event files. If a bin has >2000 counts, and if more than 50% of those come from <1% of pixels, then it is considered to be noise-dominated and hence unusable.
| Quadrant | # 1 sec bins | Bins with >0 counts | Bins with >2000 counts | High rate bins dominated by noise | Noise dominated (total time) | Noise dominated (detector-on time) | Marked lightcurve |
|---|---|---|---|---|---|---|---|
| A | 7645 | 6381 | 1 | 1 | 0.01% | 0.02% |  |
| B | 7645 | 6381 | 0 | 0 | 0.00% | 0.00% | 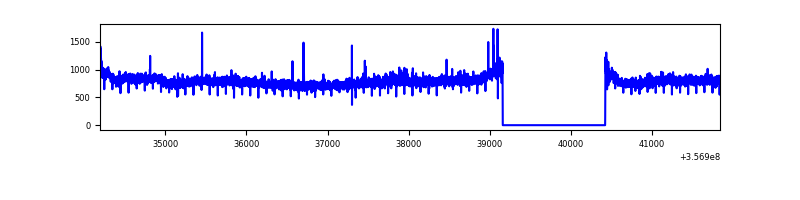 |
| C | 7645 | 6381 | 1 | 1 | 0.01% | 0.02% | 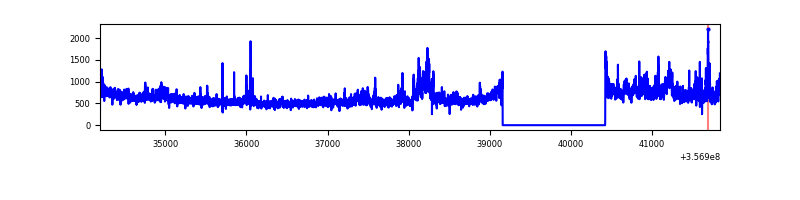 |
| D | 7645 | 6381 | 14 | 14 | 0.18% | 0.22% | 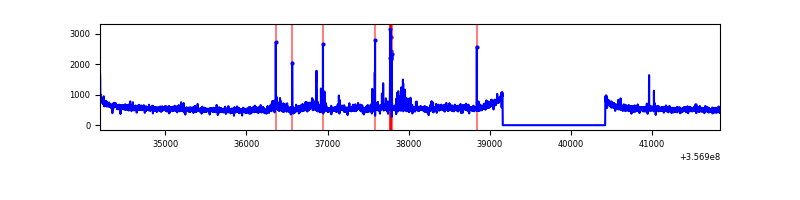 |
Top three noisy pixels from each quadrant. If the there are fewer than three noisy pixels in the level2.evt file, extra rows are filled as -1
| Pixel properties | Quadrant properties | ||||||
|---|---|---|---|---|---|---|---|
| Quadrant | DetID | PixID | Counts | Sigma | Mean | Median | Sigma |
| A | 8 | 192 | 21818 | 127.03 | 845 | 828 | 165.2 |
| A | 13 | 254 | 11327 | 63.54 | 845 | 828 | 165.2 |
| A | 3 | 137 | 7571 | 40.81 | 845 | 828 | 165.2 |
| B | 6 | 159 | 1755606 | 11352.69 | 833 | 813 | 154.6 |
| B | 0 | 190 | 21865 | 136.2 | 833 | 813 | 154.6 |
| B | 12 | 111 | 17955 | 110.9 | 833 | 813 | 154.6 |
| C | 3 | 233 | 676167 | 3513.68 | 832 | 838 | 192.2 |
| C | 14 | 238 | 144352 | 746.69 | 832 | 838 | 192.2 |
| C | 15 | 208 | 19207 | 95.57 | 832 | 838 | 192.2 |
| D | 1 | 52 | 119020 | 582.5 | 839 | 821 | 202.9 |
| D | 8 | 195 | 117180 | 573.43 | 839 | 821 | 202.9 |
| D | 12 | 227 | 74480 | 363.0 | 839 | 821 | 202.9 |
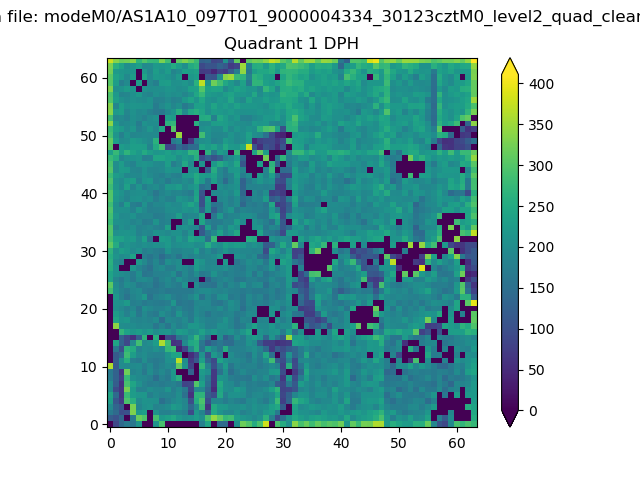
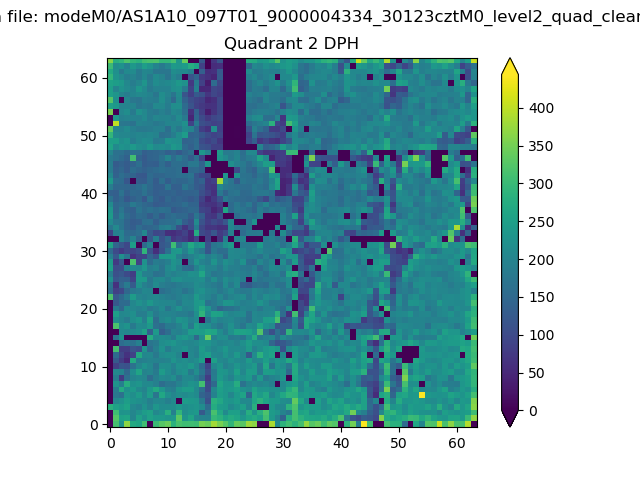
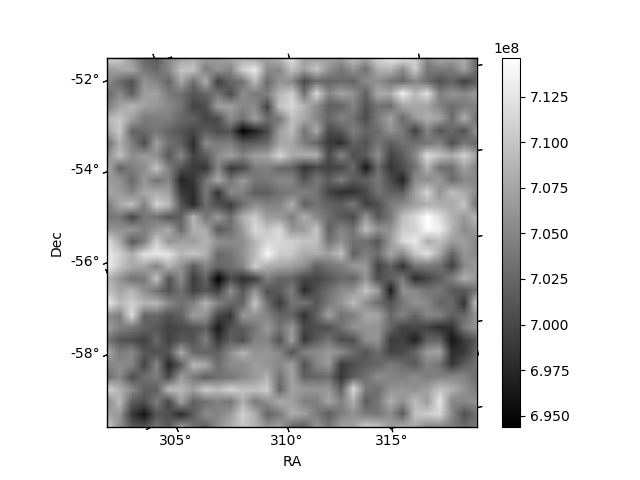
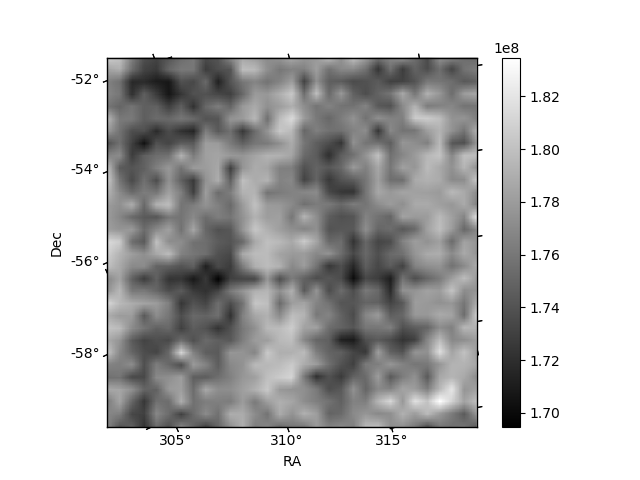
Histogram calculated using DETX and DETY for each event in the final _common_clean file
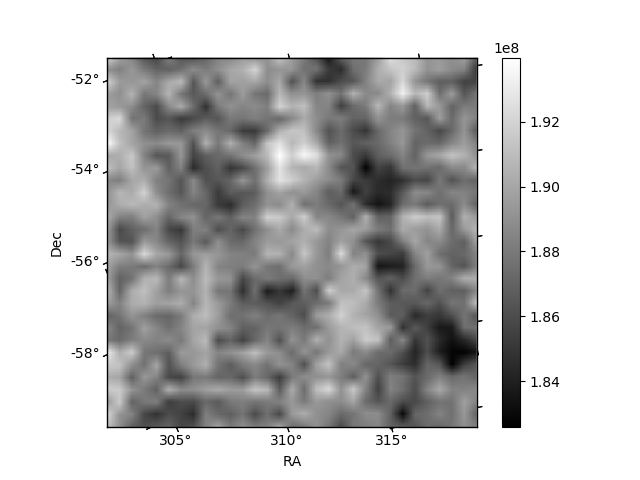
| Quadrant A | 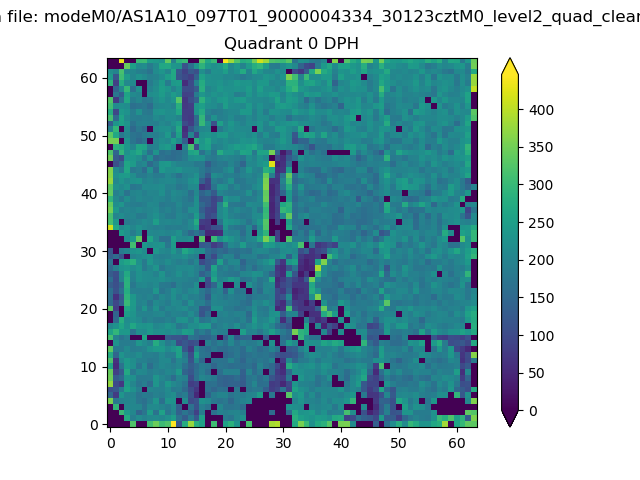 |
 |
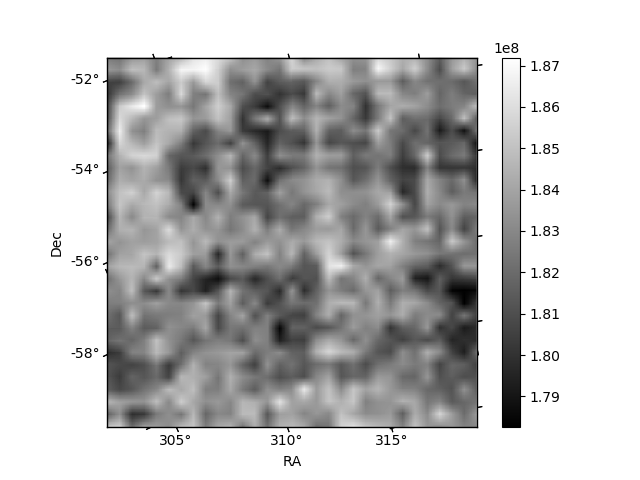
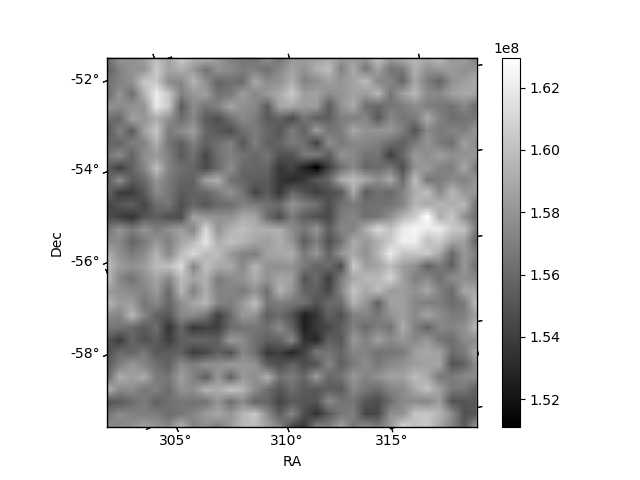
Quadrant B |
|---|---|---|---|
| Quadrant D | 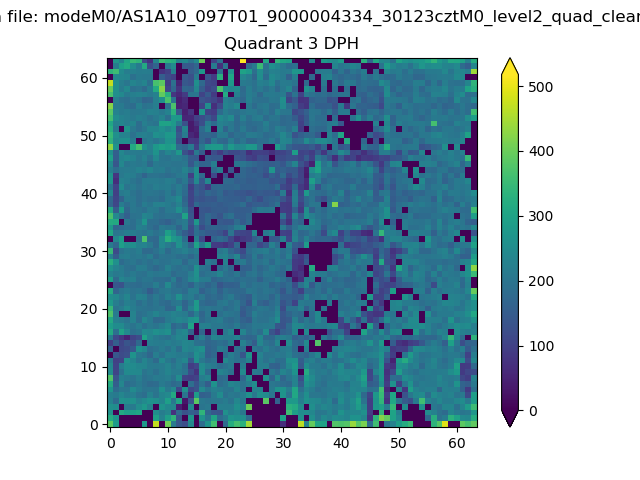 |
 |
Quadrant C |
| Plot type | Count rate plots | Images |
|---|---|---|
| Comparison with Poisson distribution Blue bars denote a histogram of data divided into 1 sec bins. Red curve is a Poisson curve with rate = median count rate of data. |
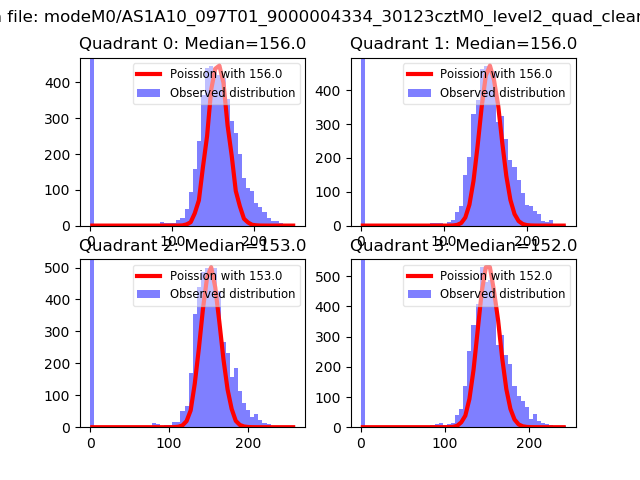 |
 |
| Quadrant-wise count rates Data is divided into 100 sec bins |
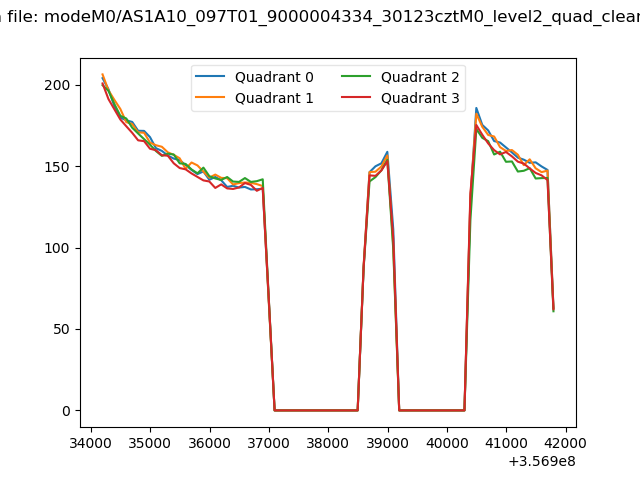 |
|
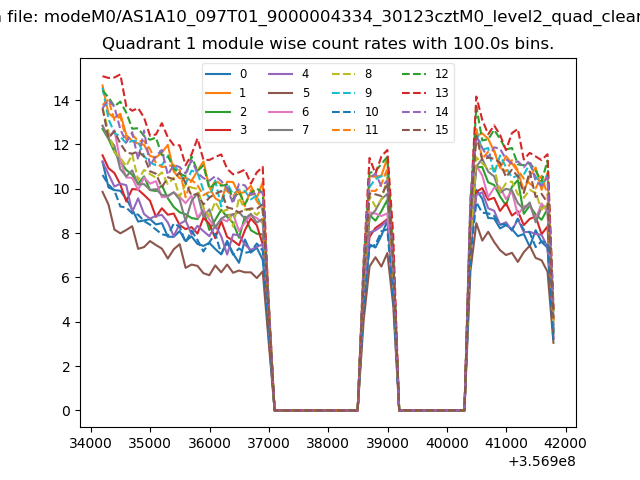
| Module-wise count rates for Quadrant A Data is divided into 100 sec bins |
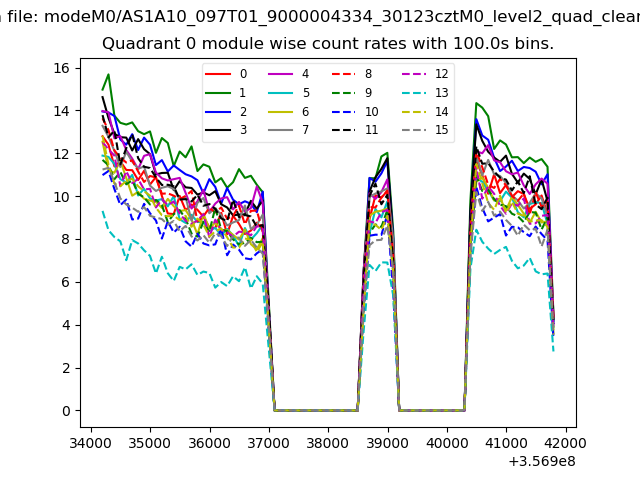 |
 |
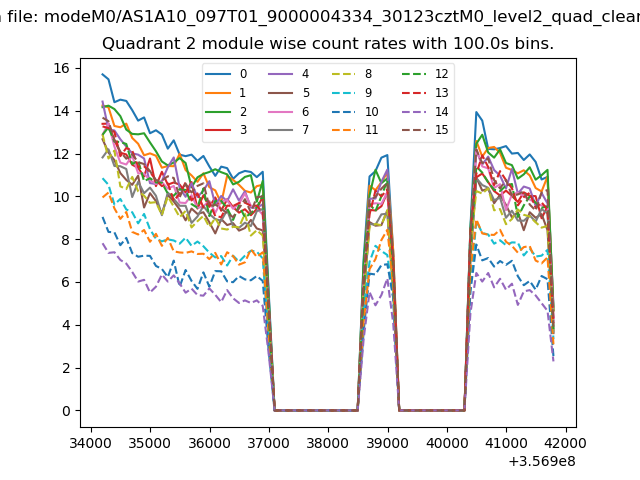
| Module-wise count rates for Quadrant B Data is divided into 100 sec bins |
 |
 |
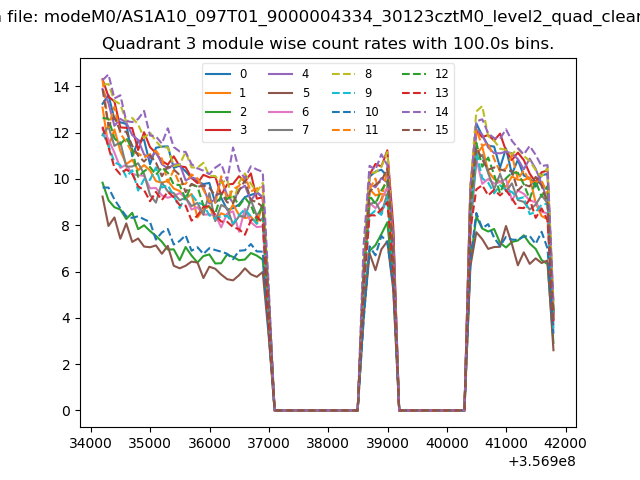
| Module-wise count rates for Quadrant C Data is divided into 100 sec bins |
 |
 |
| Module-wise count rates for Quadrant D Data is divided into 100 sec bins |
 |
 |
| Parameter | Plot |
|---|---|
| CZT HV Monitor | 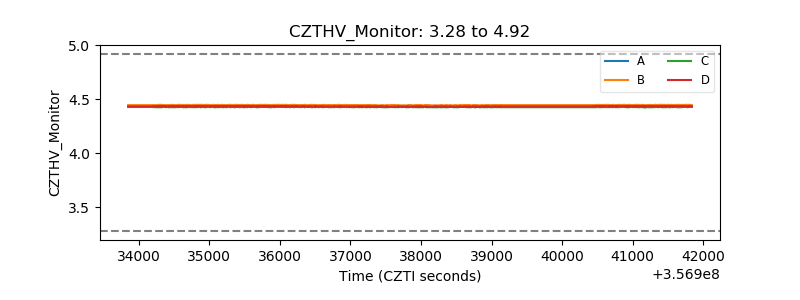 |
| D_VDD |  |
| Temperature 1 | 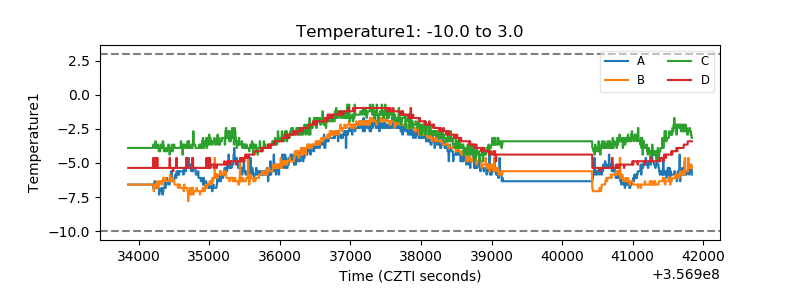 |
| Veto HV Monitor |  |
| Veto LLD | 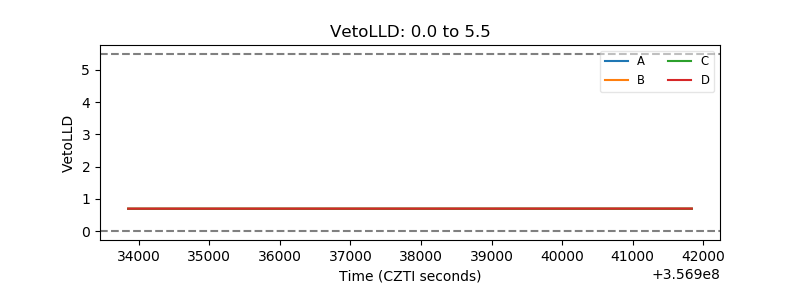 |
| Alpha Counter | 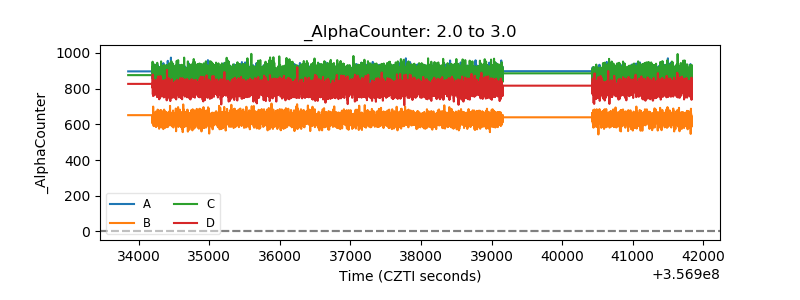 |
| _CPM_Rate | 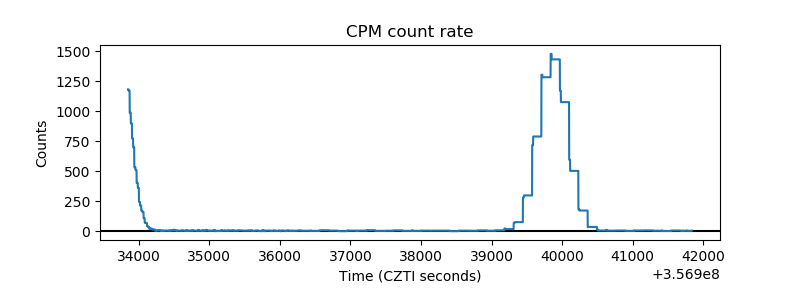 |
| CZT Counter | 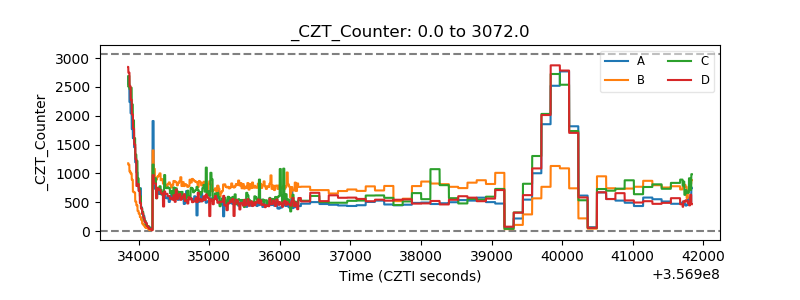 |
| +2.5 Volts monitor |  |
| +5 Volts monitor |  |
| _ROLL_ROT | 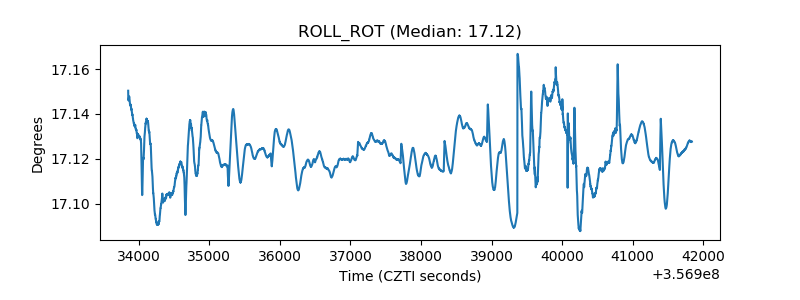 |
| _Roll_DEC | 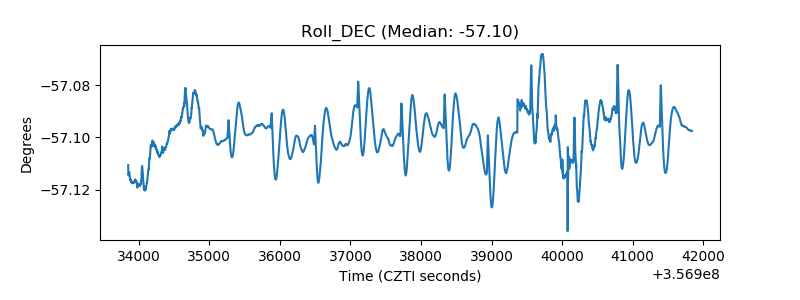 |
| _Roll_RA | 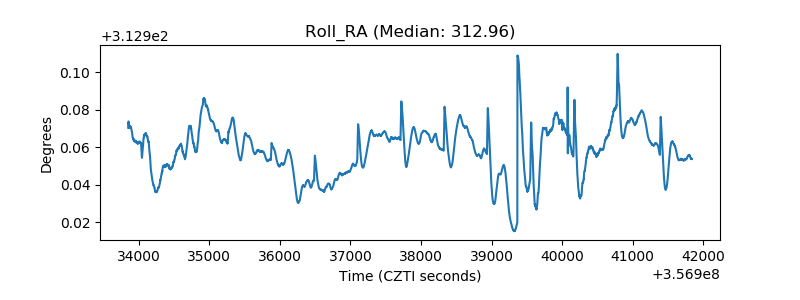 |
| Veto Counter | 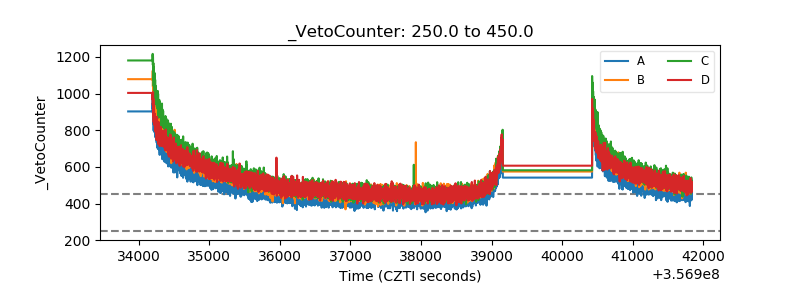 |