| Param | Original file | Final file |
|---|---|---|
| Filename | modeM0/AS1A10_097T01_9000004334_30124cztM0_level2.evt | modeM0/AS1A10_097T01_9000004334_30124cztM0_level2_quad_clean.evt |
| Size (bytes) | 656,982,720 | 101,871,360 |
| Size | 626.5 MB | 97.2 MB |
| Events in quadrant A | 3,099,689 | 682,371 |
| Events in quadrant B | 4,886,732 | 681,332 |
| Events in quadrant C | 7,966,561 | 621,454 |
| Events in quadrant D | 3,520,431 | 662,162 |
| Mode M9 | |||
|---|---|---|---|
| Quadrant | BADHDUFLAG | Total packets | Discarded packets |
| A | 0 | 11 | 0 |
| B | 0 | 11 | 0 |
| C | 0 | 11 | 0 |
| D | 0 | 11 | 0 |
| Mode SS | |||
|---|---|---|---|
| Quadrant | BADHDUFLAG | Total packets | Discarded packets |
| A | 0 | 128 | 0 |
| B | 0 | 128 | 0 |
| C | 0 | 128 | 0 |
| D | 0 | 128 | 0 |
| Mode M0 | |||
|---|---|---|---|
| Quadrant | BADHDUFLAG | Total packets | Discarded packets |
| A | 0 | 12953 | 1 |
| B | 0 | 18966 | 1 |
| C | 0 | 28169 | 1 |
| D | 0 | 14090 | 1 |
| Quadrant | Total seconds | Saturated seconds | Saturation percentage |
|---|---|---|---|
| A | 6266 | 79 | 1.260772% |
| B | 6266 | 141 | 2.250239% |
| C | 6266 | 1309 | 20.890520% |
| D | 6266 | 78 | 1.244813% |
Noise dominated data is calculated using 1-second bins in cleaned event files. If a bin has >2000 counts, and if more than 50% of those come from <1% of pixels, then it is considered to be noise-dominated and hence unusable.
| Quadrant | # 1 sec bins | Bins with >0 counts | Bins with >2000 counts | High rate bins dominated by noise | Noise dominated (total time) | Noise dominated (detector-on time) | Marked lightcurve |
|---|---|---|---|---|---|---|---|
| A | 7371 | 6268 | 0 | 0 | 0.00% | 0.00% |  |
| B | 7371 | 6268 | 0 | 0 | 0.00% | 0.00% | 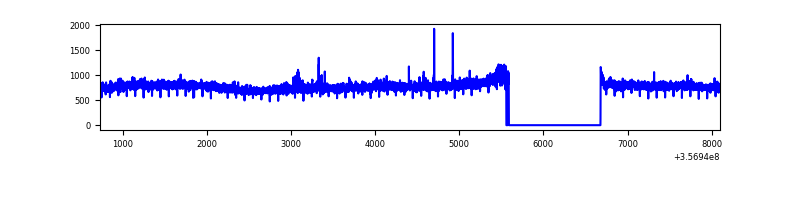 |
| C | 7371 | 6267 | 593 | 593 | 8.05% | 9.46% | 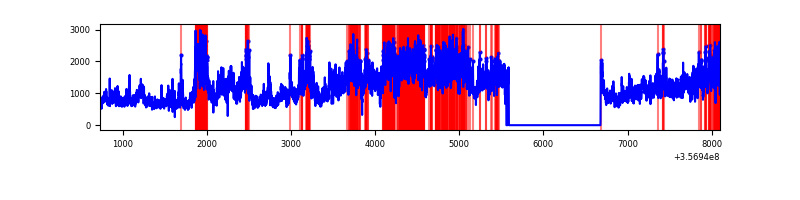 |
| D | 7371 | 6268 | 10 | 10 | 0.14% | 0.16% | 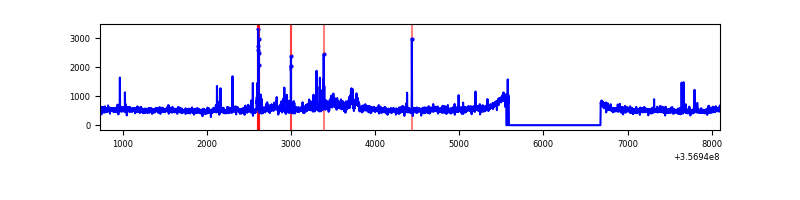 |
Top three noisy pixels from each quadrant. If the there are fewer than three noisy pixels in the level2.evt file, extra rows are filled as -1
| Pixel properties | Quadrant properties | ||||||
|---|---|---|---|---|---|---|---|
| Quadrant | DetID | PixID | Counts | Sigma | Mean | Median | Sigma |
| A | 8 | 192 | 11544 | 67.88 | 800 | 784 | 158.5 |
| A | 13 | 254 | 11019 | 64.57 | 800 | 784 | 158.5 |
| A | 3 | 137 | 7445 | 42.02 | 800 | 784 | 158.5 |
| B | 6 | 159 | 1780123 | 11984.21 | 783 | 760 | 148.5 |
| B | 0 | 190 | 39512 | 261.0 | 783 | 760 | 148.5 |
| B | 12 | 111 | 17805 | 114.8 | 783 | 760 | 148.5 |
| C | 3 | 233 | 4886106 | 28374.79 | 741 | 746 | 172.2 |
| C | 14 | 238 | 142022 | 820.55 | 741 | 746 | 172.2 |
| C | 14 | 254 | 36102 | 205.35 | 741 | 746 | 172.2 |
| D | 8 | 195 | 221639 | 1116.72 | 790 | 773 | 197.8 |
| D | 1 | 52 | 129957 | 653.17 | 790 | 773 | 197.8 |
| D | 12 | 227 | 60919 | 304.1 | 790 | 773 | 197.8 |
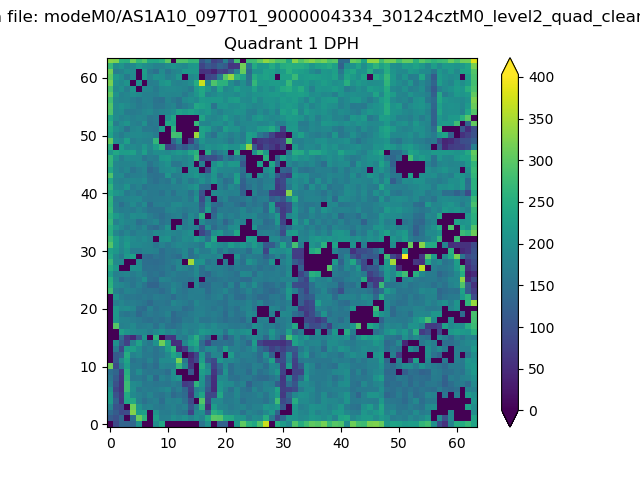
Histogram calculated using DETX and DETY for each event in the final _common_clean file
| Quadrant A | 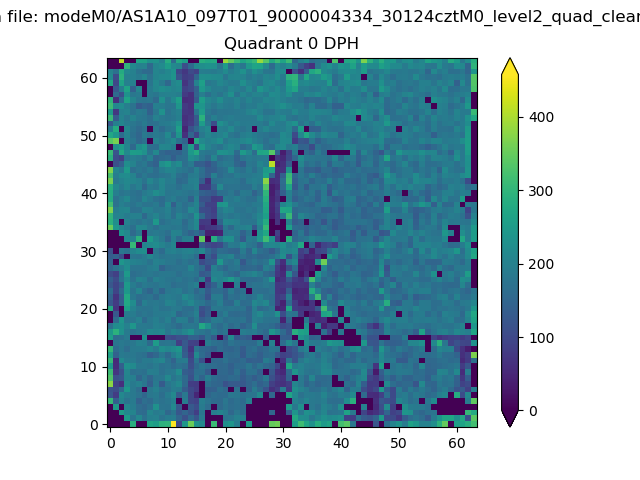 |
 |
Quadrant B |
|---|---|---|---|
| Quadrant D | 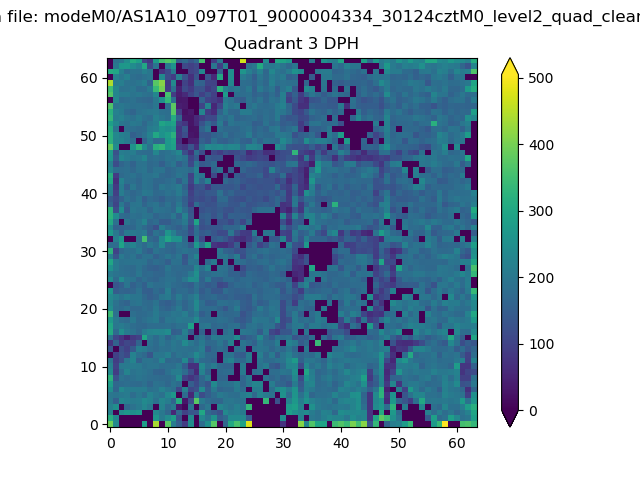 |
 |
Quadrant C |
| Plot type | Count rate plots | Images |
|---|---|---|
| Comparison with Poisson distribution Blue bars denote a histogram of data divided into 1 sec bins. Red curve is a Poisson curve with rate = median count rate of data. |
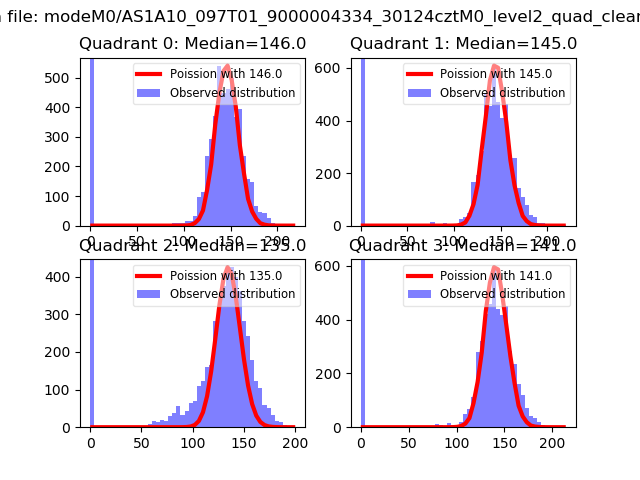 |
 |
| Quadrant-wise count rates Data is divided into 100 sec bins |
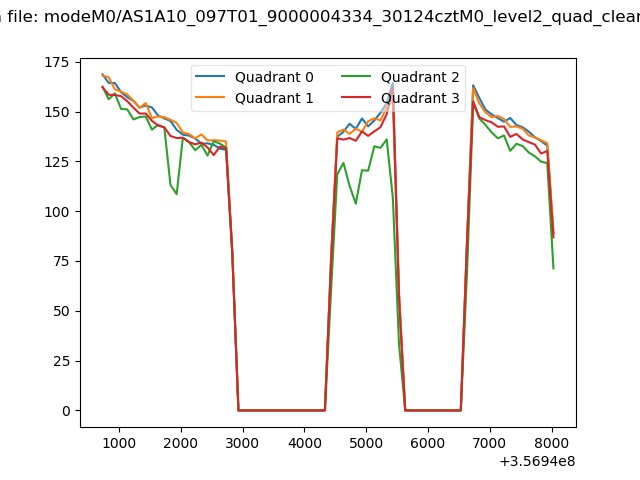 |
|
| Module-wise count rates for Quadrant A Data is divided into 100 sec bins |
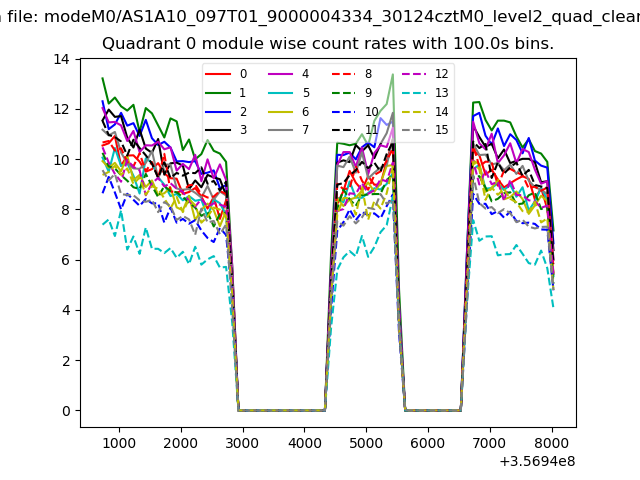 |
 |
| Module-wise count rates for Quadrant B Data is divided into 100 sec bins |
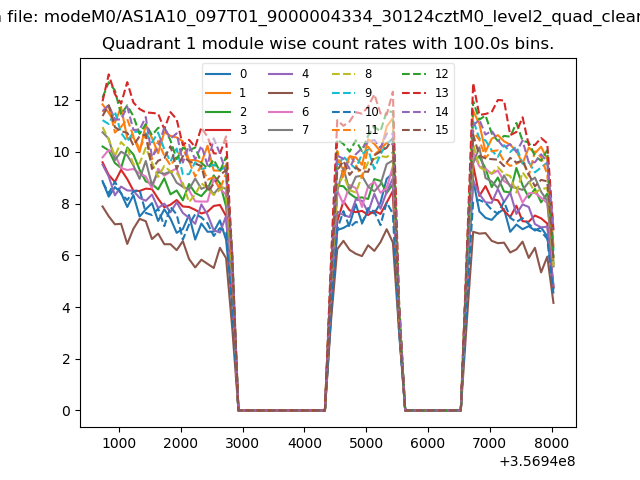 |
 |
| Module-wise count rates for Quadrant C Data is divided into 100 sec bins |
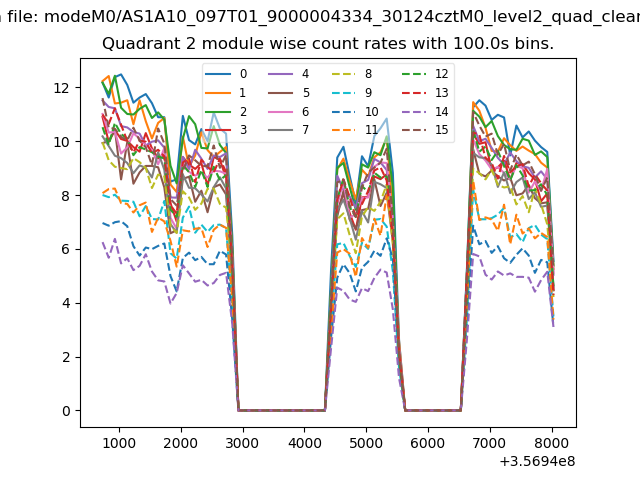 |
 |
| Module-wise count rates for Quadrant D Data is divided into 100 sec bins |
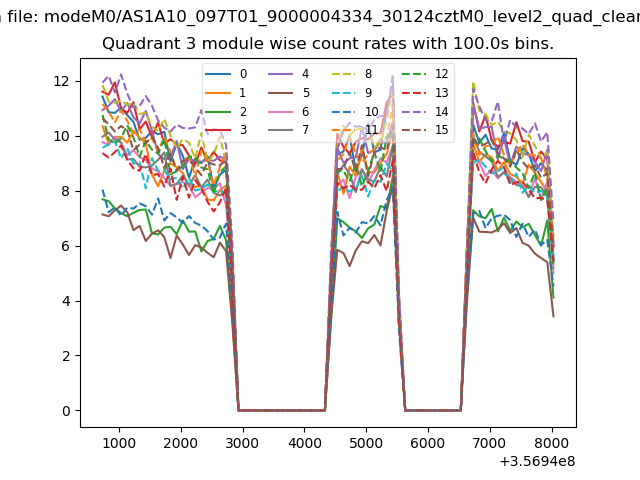 |
 |
| Parameter | Plot |
|---|---|
| CZT HV Monitor |  |
| D_VDD | 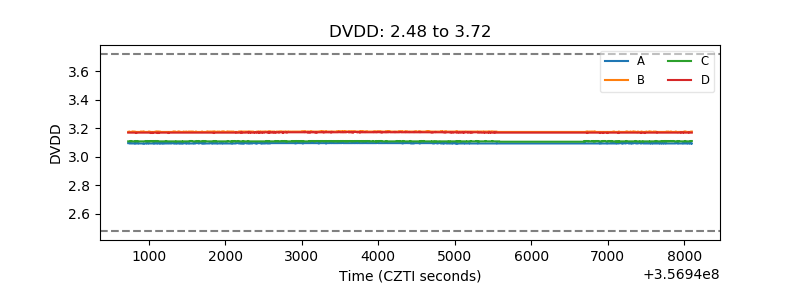 |
| Temperature 1 | 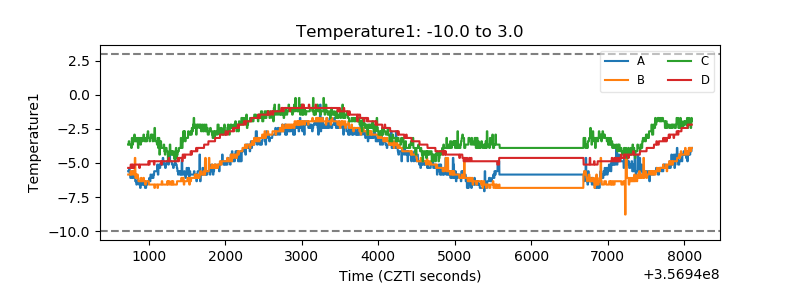 |
| Veto HV Monitor | 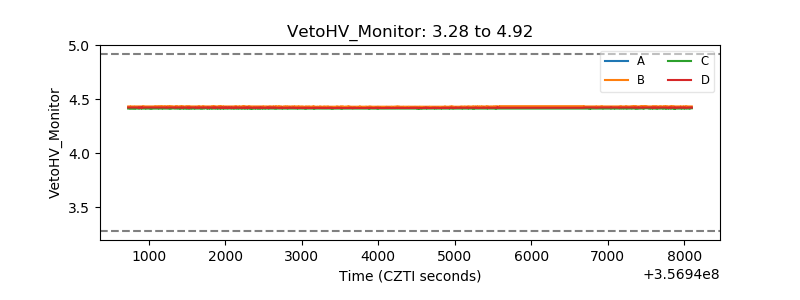 |
| Veto LLD | 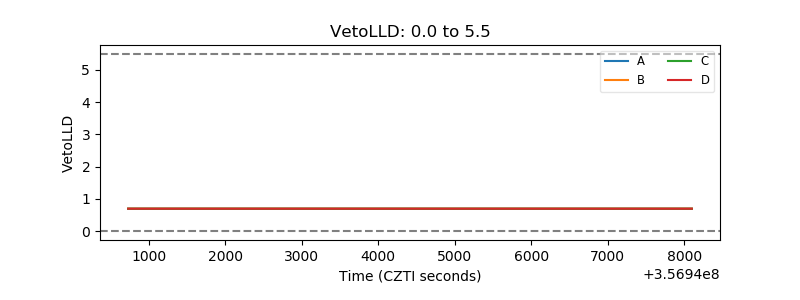 |
| Alpha Counter |  |
| _CPM_Rate | 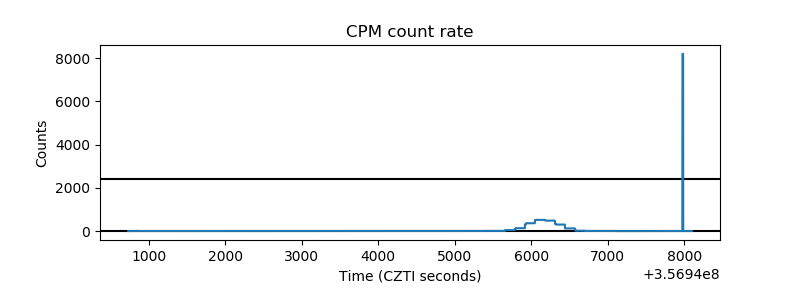 |
| CZT Counter |  |
| +2.5 Volts monitor |  |
| +5 Volts monitor |  |
| _ROLL_ROT | 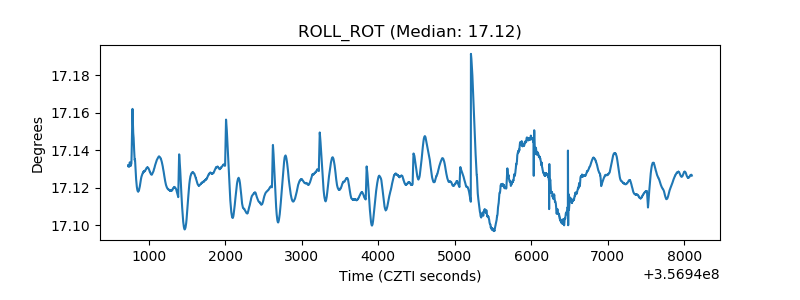 |
| _Roll_DEC | 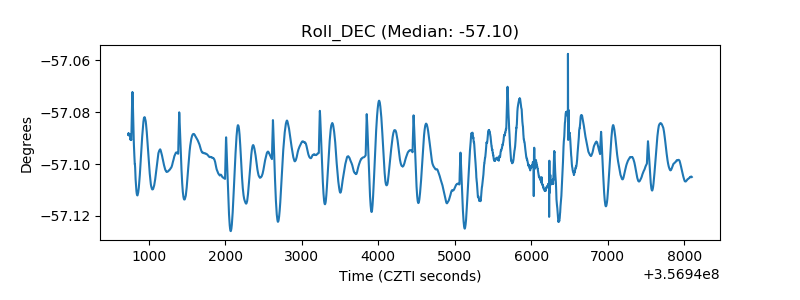 |
| _Roll_RA | 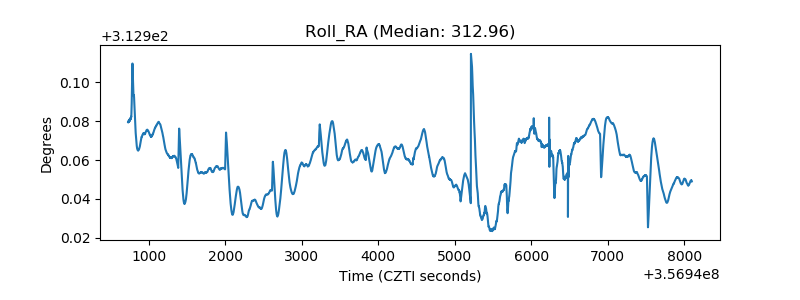 |
| Veto Counter | 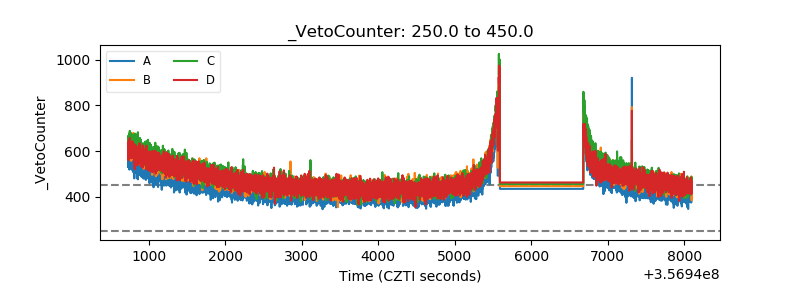 |