| Param | Original file | Final file |
|---|---|---|
| Filename | modeM0/AS1A10_097T01_9000004334_30125cztM0_level2.evt | modeM0/AS1A10_097T01_9000004334_30125cztM0_level2_quad_clean.evt |
| Size (bytes) | 696,715,200 | 102,839,040 |
| Size | 664.4 MB | 98.1 MB |
| Events in quadrant A | 3,176,008 | 678,936 |
| Events in quadrant B | 5,197,637 | 677,125 |
| Events in quadrant C | 8,471,131 | 633,286 |
| Events in quadrant D | 3,801,567 | 656,537 |
| Mode M9 | |||
|---|---|---|---|
| Quadrant | BADHDUFLAG | Total packets | Discarded packets |
| A | 0 | 8 | 0 |
| B | 0 | 8 | 0 |
| C | 0 | 8 | 0 |
| D | 0 | 8 | 0 |
| Mode SS | |||
|---|---|---|---|
| Quadrant | BADHDUFLAG | Total packets | Discarded packets |
| A | 0 | 136 | 0 |
| B | 0 | 136 | 0 |
| C | 0 | 136 | 0 |
| D | 0 | 136 | 0 |
| Mode M0 | |||
|---|---|---|---|
| Quadrant | BADHDUFLAG | Total packets | Discarded packets |
| A | 0 | 13752 | 1 |
| B | 0 | 20426 | 1 |
| C | 0 | 29847 | 1 |
| D | 0 | 15344 | 1 |
| Quadrant | Total seconds | Saturated seconds | Saturation percentage |
|---|---|---|---|
| A | 6720 | 86 | 1.279762% |
| B | 6720 | 146 | 2.172619% |
| C | 6720 | 1397 | 20.788690% |
| D | 6720 | 78 | 1.160714% |
Noise dominated data is calculated using 1-second bins in cleaned event files. If a bin has >2000 counts, and if more than 50% of those come from <1% of pixels, then it is considered to be noise-dominated and hence unusable.
| Quadrant | # 1 sec bins | Bins with >0 counts | Bins with >2000 counts | High rate bins dominated by noise | Noise dominated (total time) | Noise dominated (detector-on time) | Marked lightcurve |
|---|---|---|---|---|---|---|---|
| A | 7505 | 6721 | 0 | 0 | 0.00% | 0.00% |  |
| B | 7505 | 6721 | 8 | 8 | 0.11% | 0.12% |  |
| C | 7505 | 6721 | 891 | 891 | 11.87% | 13.26% |  |
| D | 7505 | 6721 | 16 | 16 | 0.21% | 0.24% |  |
Top three noisy pixels from each quadrant. If the there are fewer than three noisy pixels in the level2.evt file, extra rows are filled as -1
| Pixel properties | Quadrant properties | ||||||
|---|---|---|---|---|---|---|---|
| Quadrant | DetID | PixID | Counts | Sigma | Mean | Median | Sigma |
| A | 13 | 254 | 11906 | 68.0 | 820 | 802 | 163.3 |
| A | 8 | 192 | 10647 | 60.29 | 820 | 802 | 163.3 |
| A | 3 | 137 | 7976 | 43.93 | 820 | 802 | 163.3 |
| B | 6 | 159 | 1889202 | 12343.79 | 802 | 780 | 153.0 |
| B | 4 | 171 | 90711 | 587.84 | 802 | 780 | 153.0 |
| B | 0 | 190 | 57380 | 369.97 | 802 | 780 | 153.0 |
| C | 3 | 233 | 5384784 | 30608.44 | 756 | 760 | 175.9 |
| C | 14 | 238 | 121859 | 688.45 | 756 | 760 | 175.9 |
| C | 2 | 114 | 15059 | 81.29 | 756 | 760 | 175.9 |
| D | 12 | 227 | 318358 | 1636.01 | 802 | 784 | 194.1 |
| D | 8 | 195 | 232460 | 1193.5 | 802 | 784 | 194.1 |
| D | 2 | 250 | 84086 | 429.14 | 802 | 784 | 194.1 |
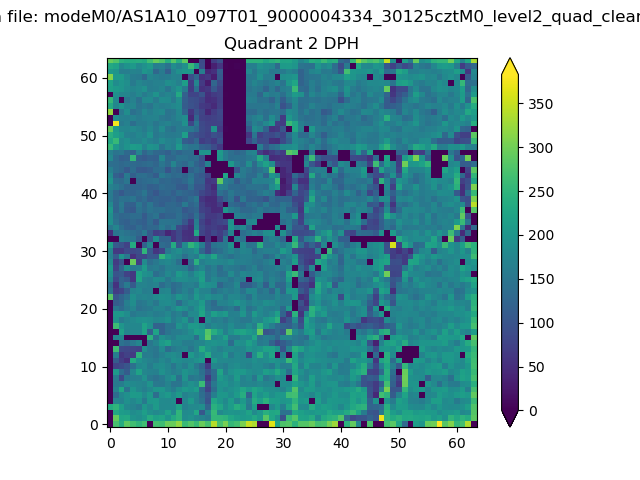
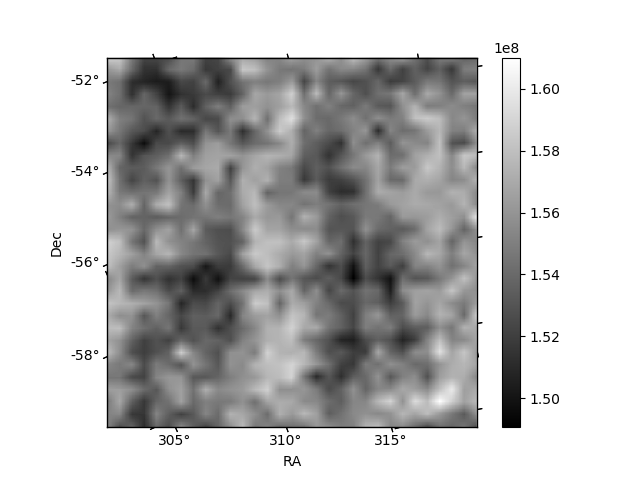
Histogram calculated using DETX and DETY for each event in the final _common_clean file
| Quadrant A | 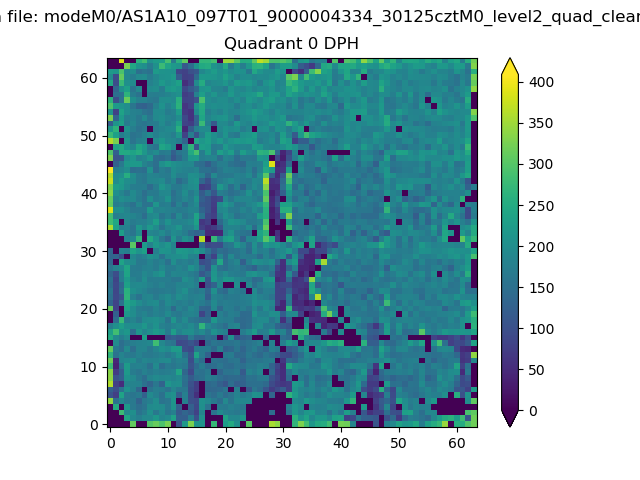 |
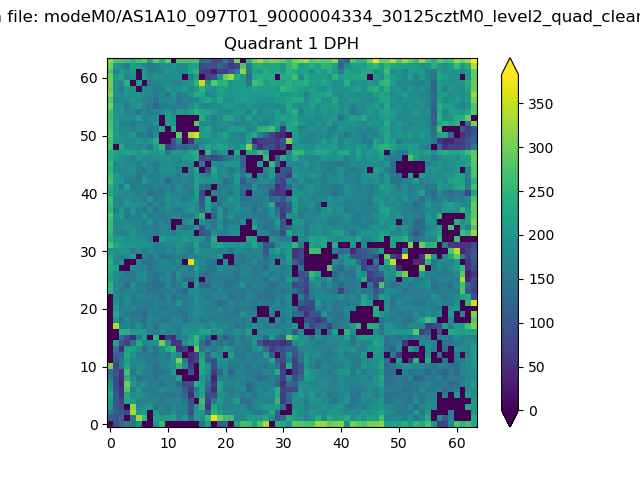 |
Quadrant B |
|---|---|---|---|
| Quadrant D | 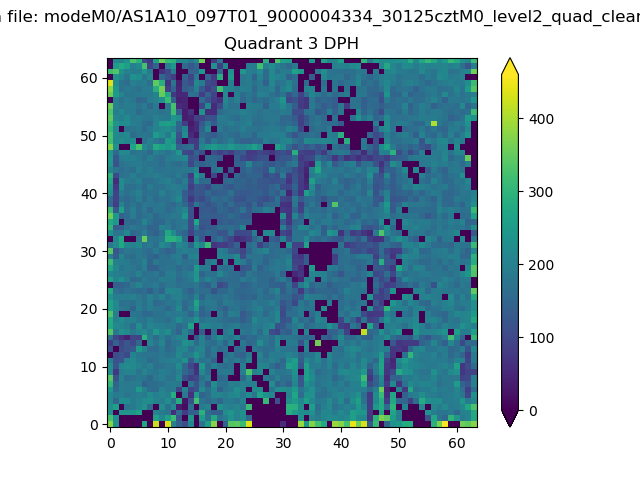 |
 |
Quadrant C |
| Plot type | Count rate plots | Images |
|---|---|---|
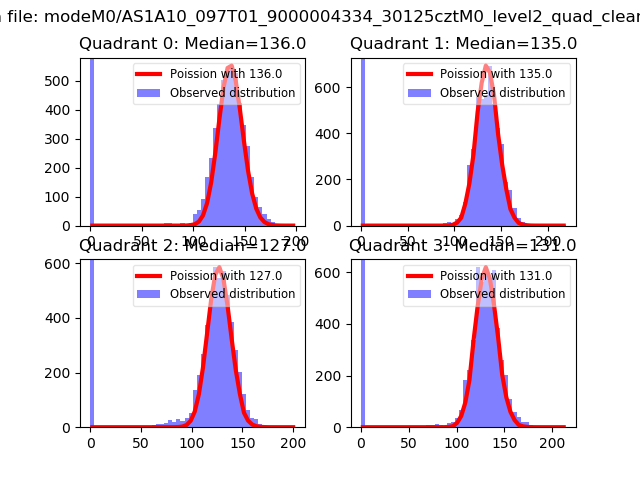
| Comparison with Poisson distribution Blue bars denote a histogram of data divided into 1 sec bins. Red curve is a Poisson curve with rate = median count rate of data. |
 |
 |
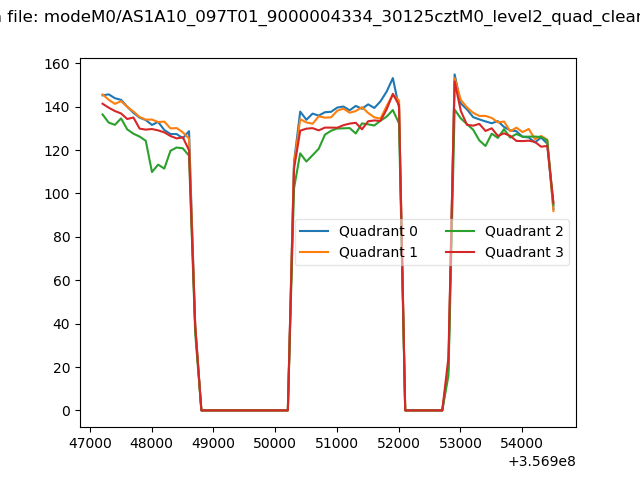
| Quadrant-wise count rates Data is divided into 100 sec bins |
 |
|
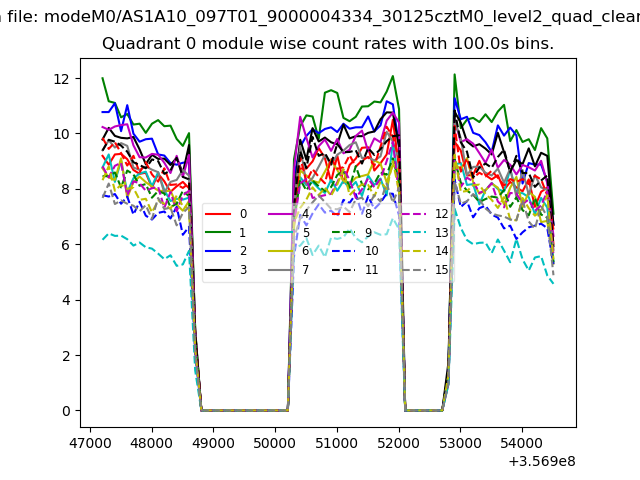
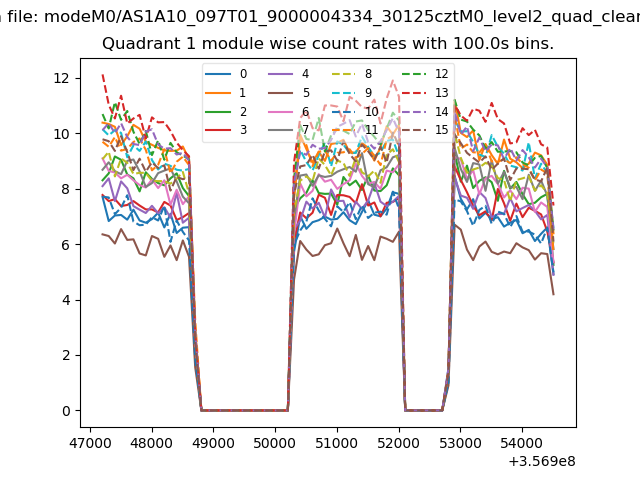
| Module-wise count rates for Quadrant A Data is divided into 100 sec bins |
 |
 |
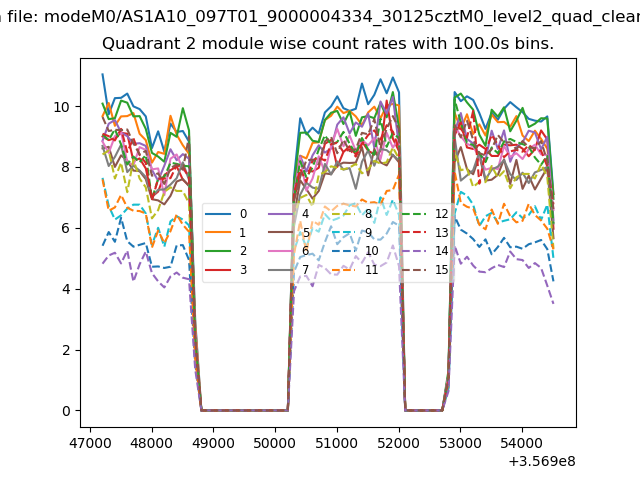
| Module-wise count rates for Quadrant B Data is divided into 100 sec bins |
 |
 |
| Module-wise count rates for Quadrant C Data is divided into 100 sec bins |
 |
 |
| Module-wise count rates for Quadrant D Data is divided into 100 sec bins |
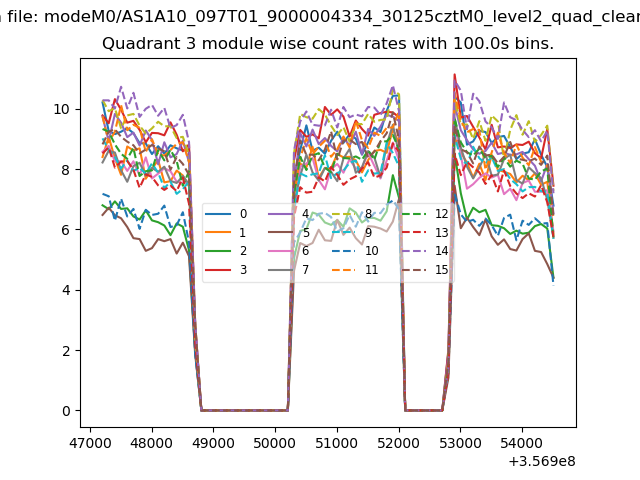 |
 |
| Parameter | Plot |
|---|---|
| CZT HV Monitor | 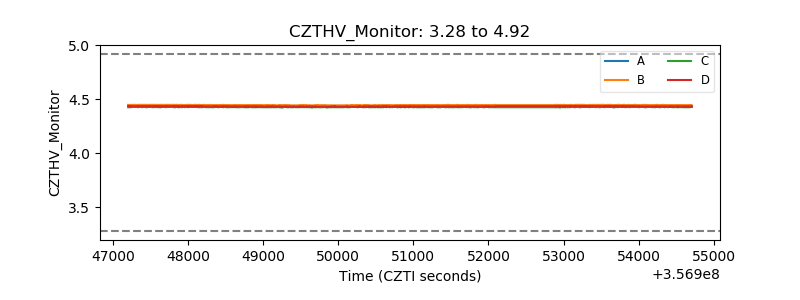 |
| D_VDD |  |
| Temperature 1 | 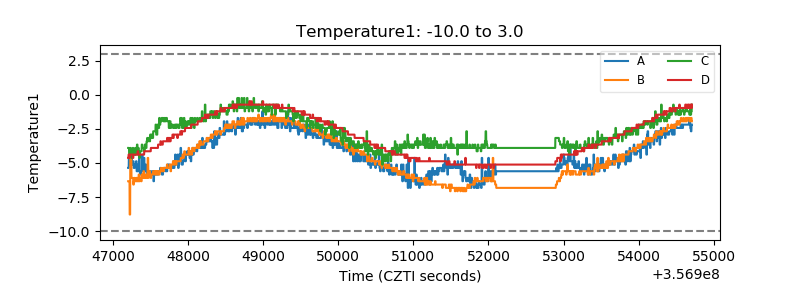 |
| Veto HV Monitor | 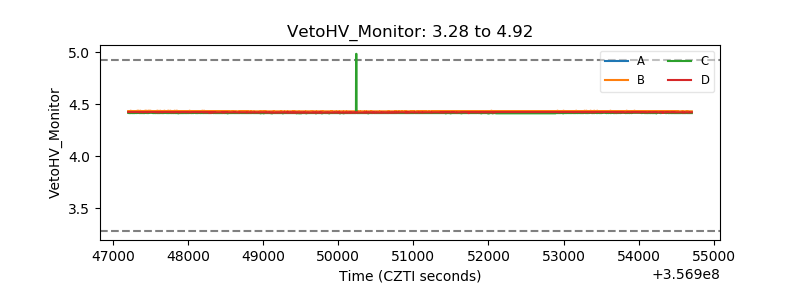 |
| Veto LLD | 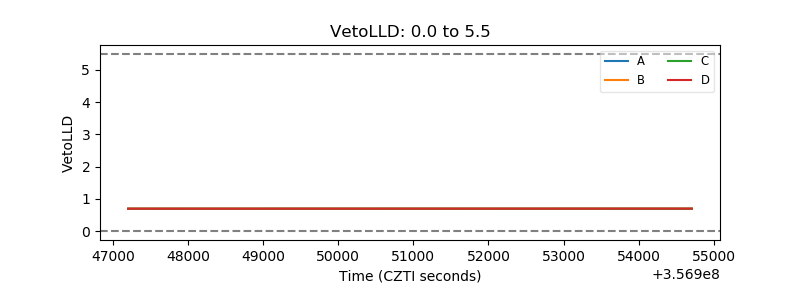 |
| Alpha Counter | 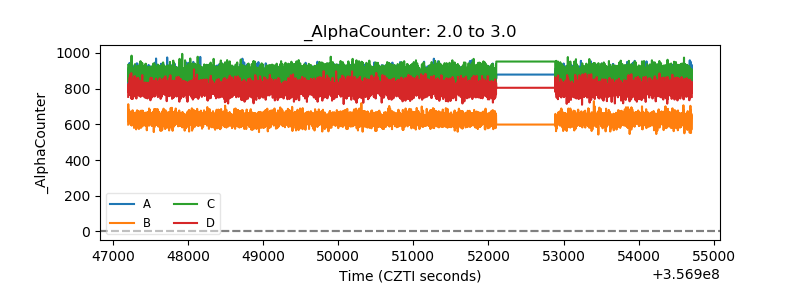 |
| _CPM_Rate | 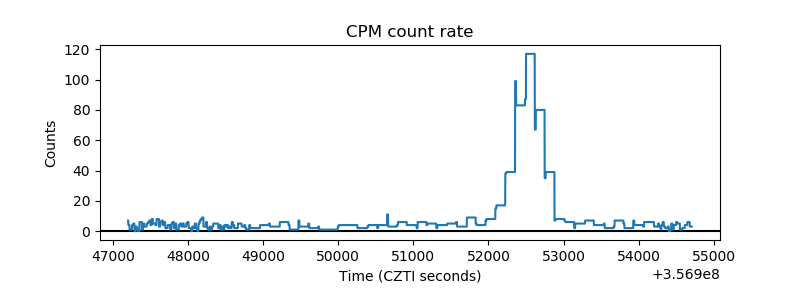 |
| CZT Counter | 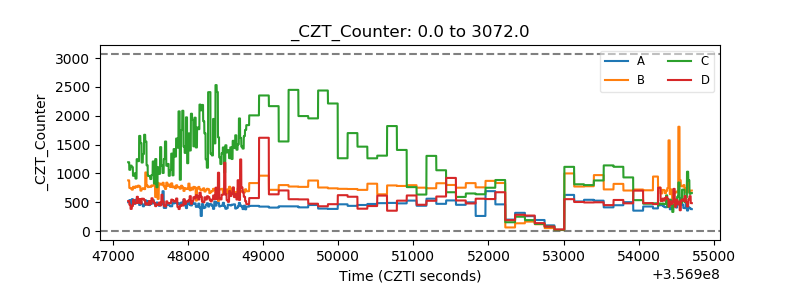 |
| +2.5 Volts monitor |  |
| +5 Volts monitor |  |
| _ROLL_ROT | 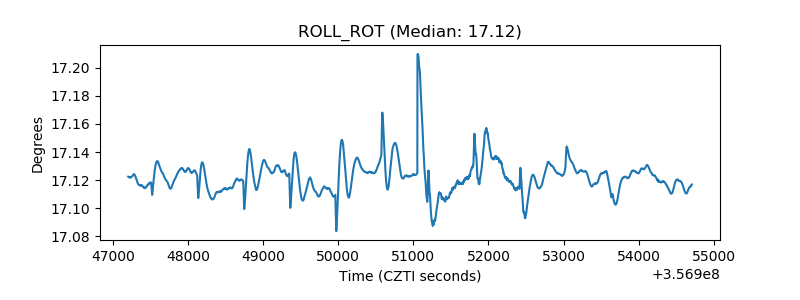 |
| _Roll_DEC | 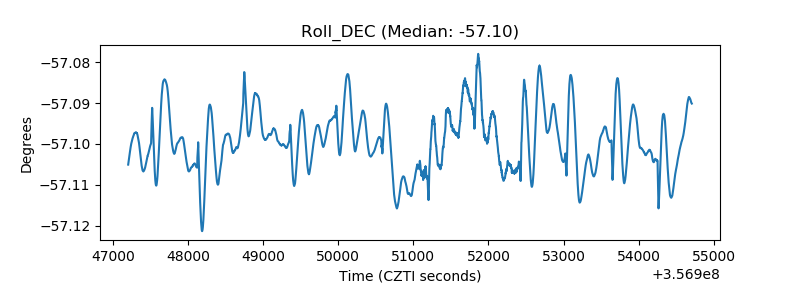 |
| _Roll_RA |  |
| Veto Counter | 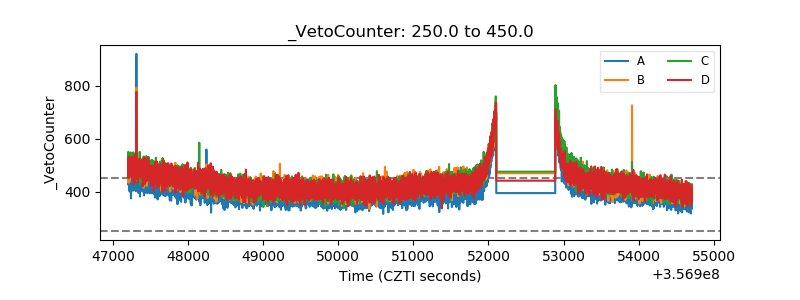 |