| Param | Original file | Final file |
|---|---|---|
| Filename | modeM0/AS1A10_097T01_9000004334_30126cztM0_level2.evt | modeM0/AS1A10_097T01_9000004334_30126cztM0_level2_quad_clean.evt |
| Size (bytes) | 609,402,240 | 97,695,360 |
| Size | 581.2 MB | 93.2 MB |
| Events in quadrant A | 3,295,832 | 636,597 |
| Events in quadrant B | 5,265,126 | 631,241 |
| Events in quadrant C | 5,533,406 | 599,287 |
| Events in quadrant D | 3,901,488 | 617,431 |
| Mode M9 | |||
|---|---|---|---|
| Quadrant | BADHDUFLAG | Total packets | Discarded packets |
| A | 0 | 2 | 0 |
| B | 0 | 2 | 0 |
| C | 0 | 2 | 0 |
| D | 0 | 2 | 0 |
| Mode SS | |||
|---|---|---|---|
| Quadrant | BADHDUFLAG | Total packets | Discarded packets |
| A | 0 | 140 | 0 |
| B | 0 | 140 | 0 |
| C | 0 | 140 | 0 |
| D | 0 | 140 | 0 |
| Mode M0 | |||
|---|---|---|---|
| Quadrant | BADHDUFLAG | Total packets | Discarded packets |
| A | 0 | 14324 | 2 |
| B | 0 | 20790 | 2 |
| C | 0 | 21087 | 2 |
| D | 0 | 15662 | 2 |
| Quadrant | Total seconds | Saturated seconds | Saturation percentage |
|---|---|---|---|
| A | 6790 | 221 | 3.254786% |
| B | 6790 | 308 | 4.536082% |
| C | 6791 | 471 | 6.935650% |
| D | 6791 | 198 | 2.915624% |
Noise dominated data is calculated using 1-second bins in cleaned event files. If a bin has >2000 counts, and if more than 50% of those come from <1% of pixels, then it is considered to be noise-dominated and hence unusable.
| Quadrant | # 1 sec bins | Bins with >0 counts | Bins with >2000 counts | High rate bins dominated by noise | Noise dominated (total time) | Noise dominated (detector-on time) | Marked lightcurve |
|---|---|---|---|---|---|---|---|
| A | 7095 | 6793 | 17 | 17 | 0.24% | 0.25% | 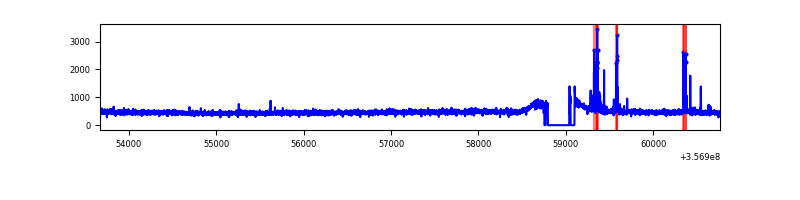 |
| B | 7095 | 6792 | 14 | 14 | 0.20% | 0.21% | 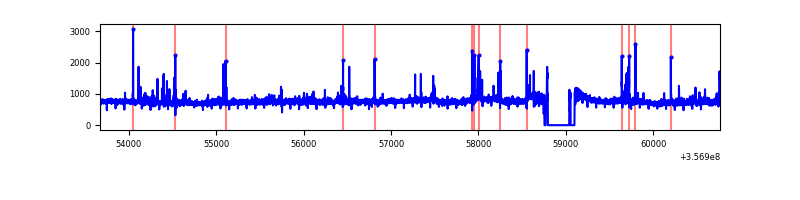 |
| C | 7096 | 6793 | 19 | 19 | 0.27% | 0.28% | 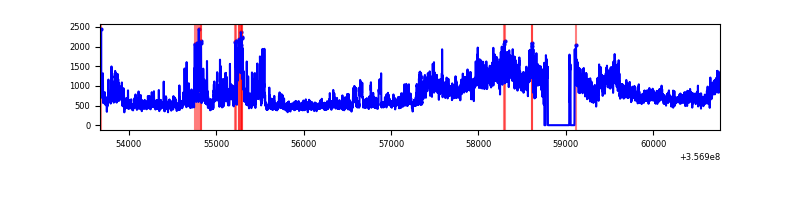 |
| D | 7096 | 6794 | 28 | 28 | 0.39% | 0.41% | 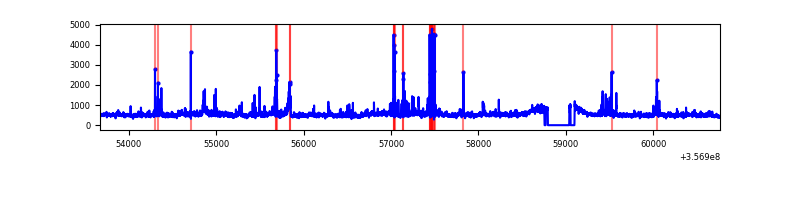 |
Top three noisy pixels from each quadrant. If the there are fewer than three noisy pixels in the level2.evt file, extra rows are filled as -1
| Pixel properties | Quadrant properties | ||||||
|---|---|---|---|---|---|---|---|
| Quadrant | DetID | PixID | Counts | Sigma | Mean | Median | Sigma |
| A | 0 | 13 | 107051 | 640.02 | 824 | 804 | 166.0 |
| A | 13 | 254 | 11435 | 64.04 | 824 | 804 | 166.0 |
| A | 8 | 192 | 10588 | 58.94 | 824 | 804 | 166.0 |
| B | 6 | 159 | 1896649 | 12117.59 | 805 | 782 | 156.5 |
| B | 4 | 171 | 142360 | 904.91 | 805 | 782 | 156.5 |
| B | 0 | 190 | 55506 | 349.77 | 805 | 782 | 156.5 |
| C | 3 | 233 | 2358719 | 12973.33 | 776 | 780 | 181.8 |
| C | 14 | 238 | 123863 | 677.2 | 776 | 780 | 181.8 |
| C | 2 | 114 | 15480 | 80.88 | 776 | 780 | 181.8 |
| D | 13 | 104 | 258166 | 1332.06 | 804 | 785 | 193.2 |
| D | 8 | 195 | 209824 | 1081.87 | 804 | 785 | 193.2 |
| D | 12 | 33 | 137770 | 708.96 | 804 | 785 | 193.2 |
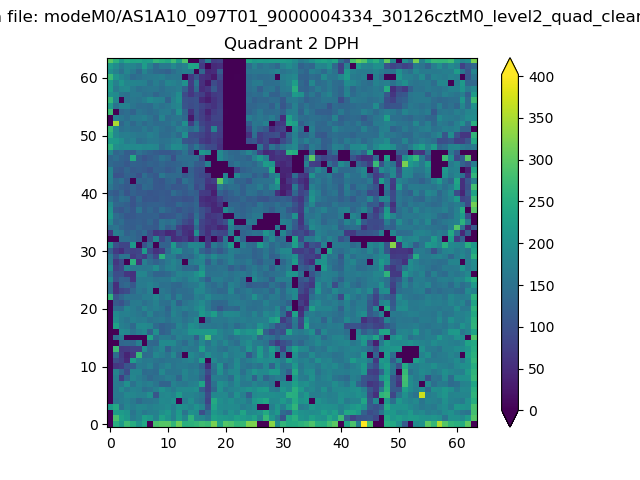
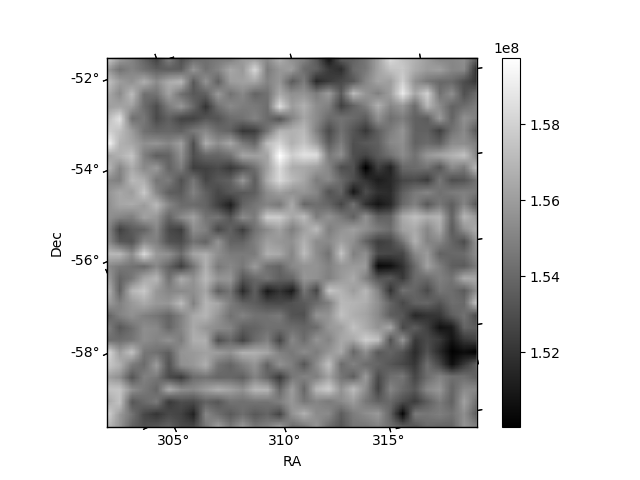
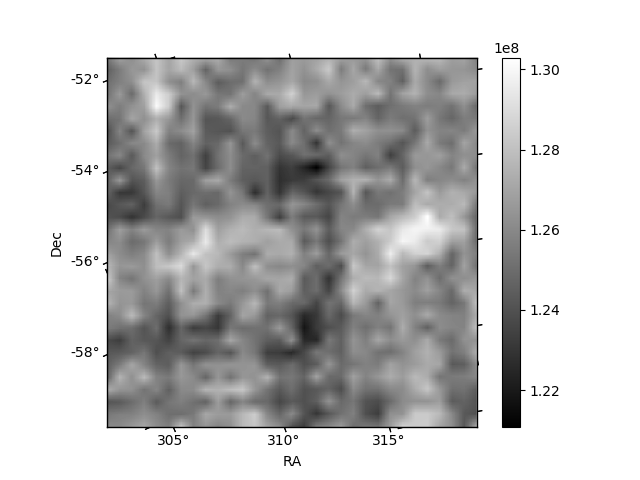
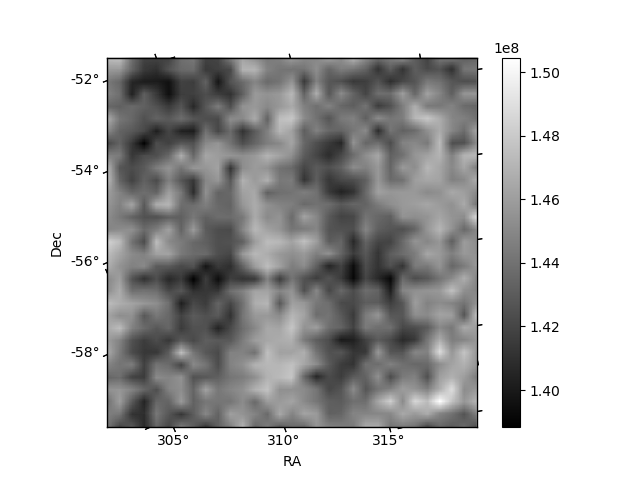
Histogram calculated using DETX and DETY for each event in the final _common_clean file
| Quadrant A | 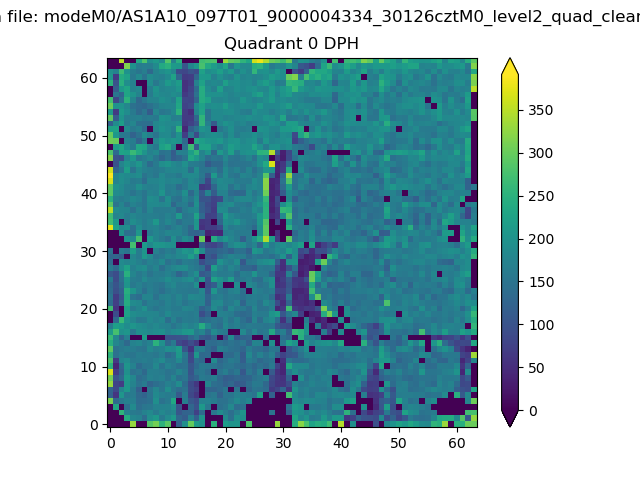 |
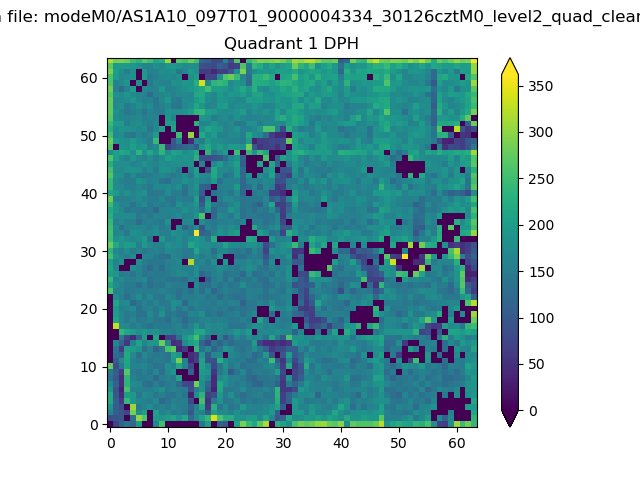 |
Quadrant B |
|---|---|---|---|
| Quadrant D | 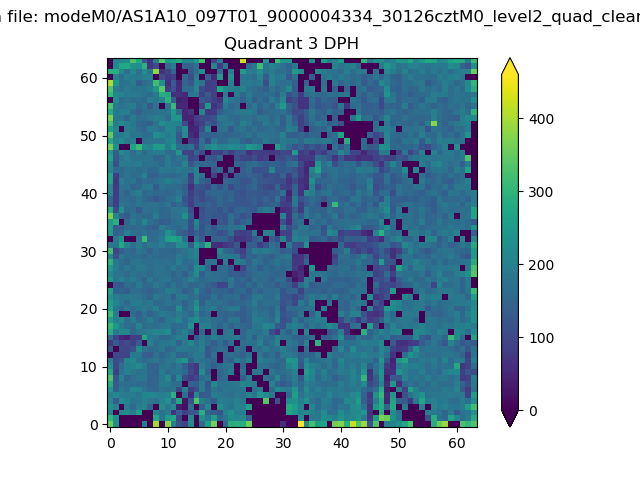 |
 |
Quadrant C |
| Plot type | Count rate plots | Images |
|---|---|---|
| Comparison with Poisson distribution Blue bars denote a histogram of data divided into 1 sec bins. Red curve is a Poisson curve with rate = median count rate of data. |
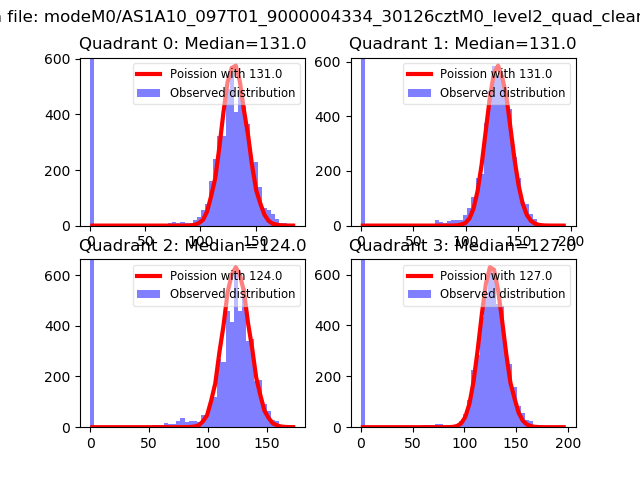 |
 |
| Quadrant-wise count rates Data is divided into 100 sec bins |
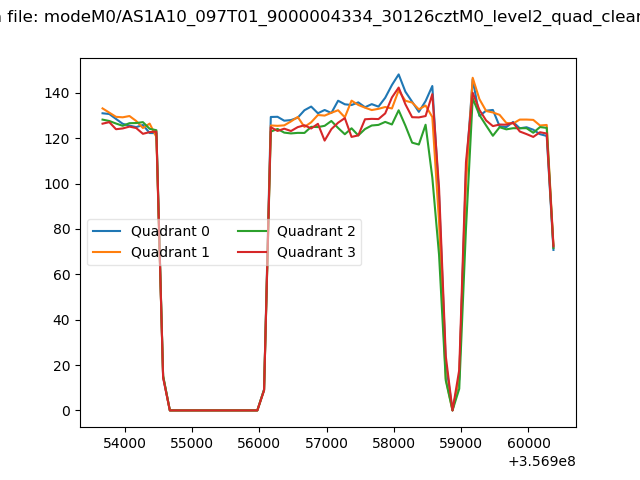 |
|
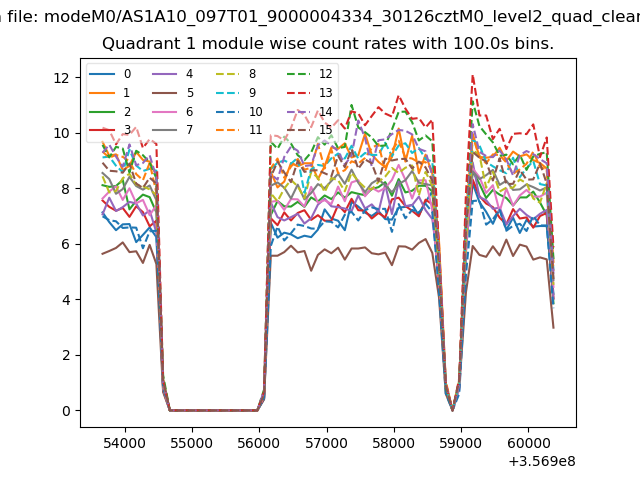
| Module-wise count rates for Quadrant A Data is divided into 100 sec bins |
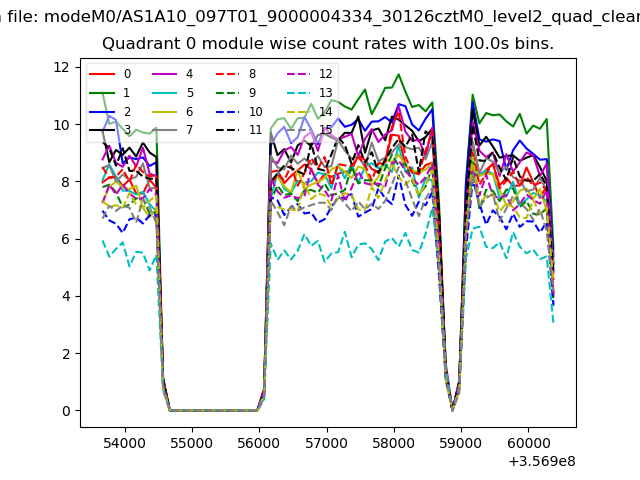 |
 |
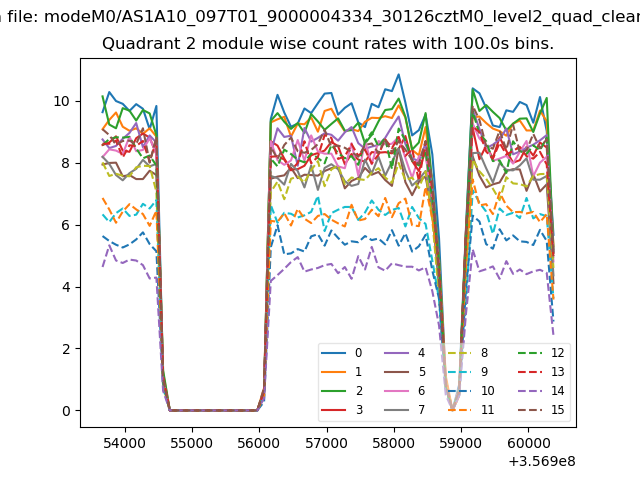
| Module-wise count rates for Quadrant B Data is divided into 100 sec bins |
 |
 |
| Module-wise count rates for Quadrant C Data is divided into 100 sec bins |
 |
 |
| Module-wise count rates for Quadrant D Data is divided into 100 sec bins |
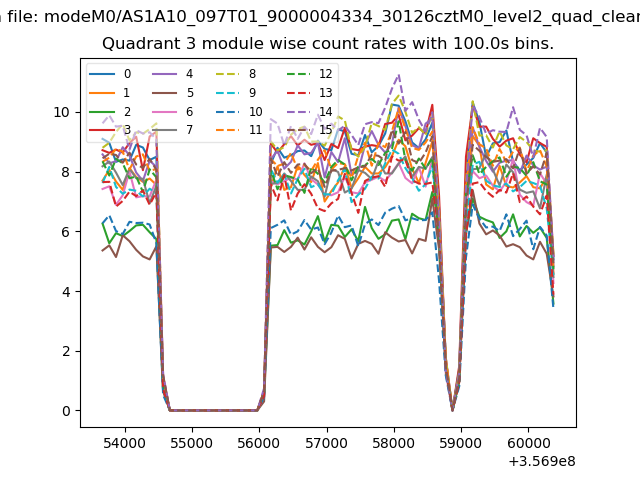 |
 |
| Parameter | Plot |
|---|---|
| CZT HV Monitor | 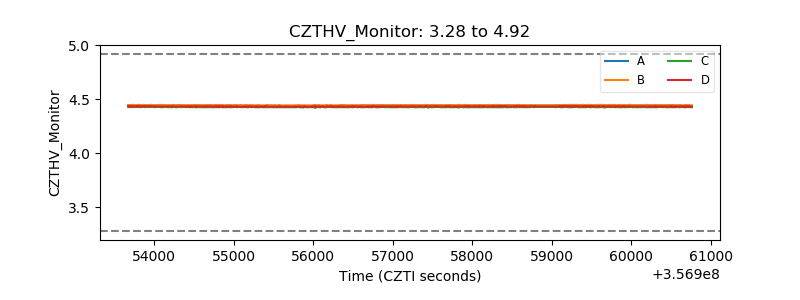 |
| D_VDD | 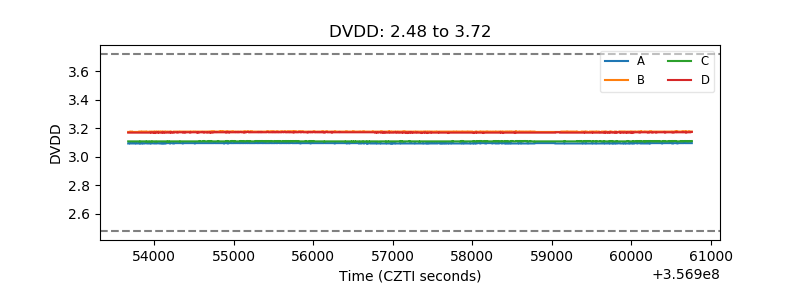 |
| Temperature 1 |  |
| Veto HV Monitor | 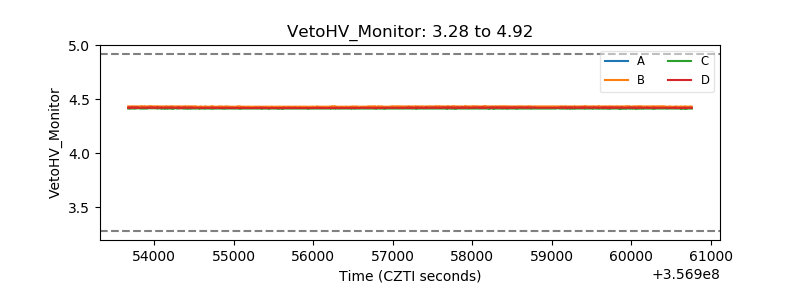 |
| Veto LLD | 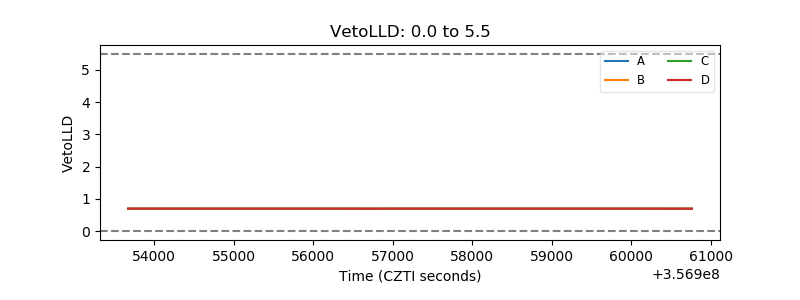 |
| Alpha Counter | 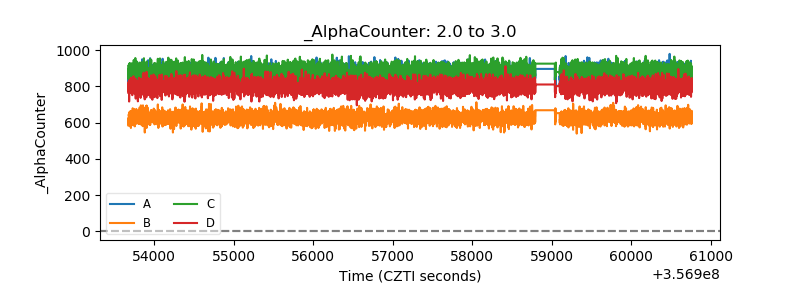 |
| _CPM_Rate | 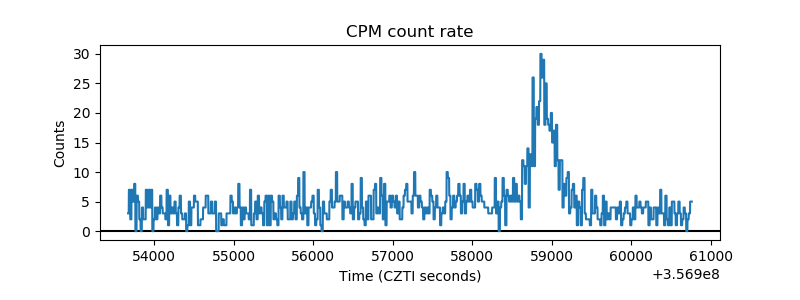 |
| CZT Counter | 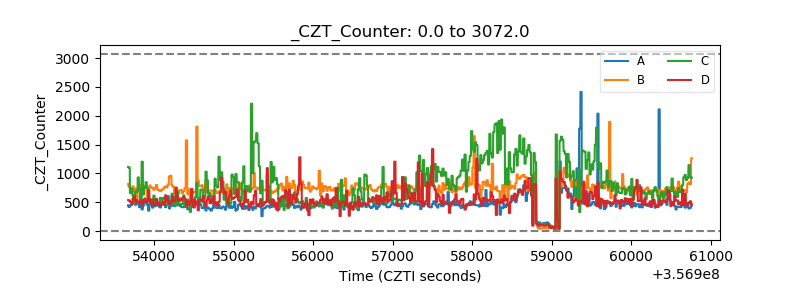 |
| +2.5 Volts monitor |  |
| +5 Volts monitor |  |
| _ROLL_ROT | 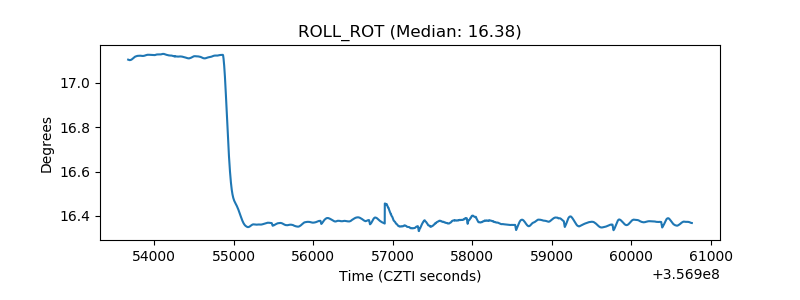 |
| _Roll_DEC |  |
| _Roll_RA | 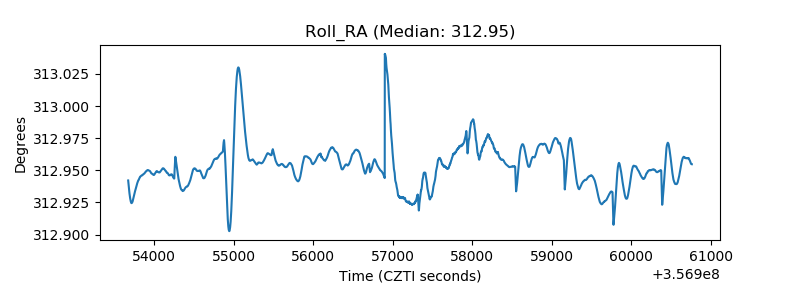 |
| Veto Counter | 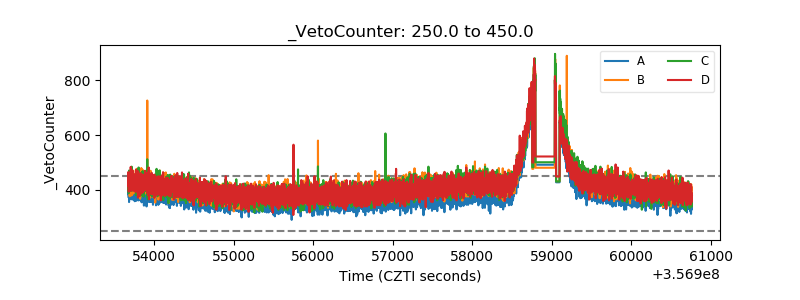 |