| Param | Original file | Final file |
|---|---|---|
| Filename | modeM0/AS1A10_097T01_9000004334_30127cztM0_level2.evt | modeM0/AS1A10_097T01_9000004334_30127cztM0_level2_quad_clean.evt |
| Size (bytes) | 710,709,120 | 105,514,560 |
| Size | 677.8 MB | 100.6 MB |
| Events in quadrant A | 3,918,731 | 681,441 |
| Events in quadrant B | 6,014,833 | 673,909 |
| Events in quadrant C | 6,860,889 | 645,743 |
| Events in quadrant D | 4,213,358 | 662,583 |
| Mode SS | |||
|---|---|---|---|
| Quadrant | BADHDUFLAG | Total packets | Discarded packets |
| A | 0 | 152 | 0 |
| B | 0 | 152 | 0 |
| C | 0 | 152 | 0 |
| D | 0 | 152 | 0 |
| Mode M0 | |||
|---|---|---|---|
| Quadrant | BADHDUFLAG | Total packets | Discarded packets |
| A | 0 | 16685 | 1 |
| B | 0 | 23698 | 1 |
| C | 0 | 25969 | 1 |
| D | 0 | 17256 | 3 |
| Quadrant | Total seconds | Saturated seconds | Saturation percentage |
|---|---|---|---|
| A | 7640 | 320 | 4.188482% |
| B | 7641 | 404 | 5.287266% |
| C | 7641 | 558 | 7.302709% |
| D | 7640 | 224 | 2.931937% |
Noise dominated data is calculated using 1-second bins in cleaned event files. If a bin has >2000 counts, and if more than 50% of those come from <1% of pixels, then it is considered to be noise-dominated and hence unusable.
| Quadrant | # 1 sec bins | Bins with >0 counts | Bins with >2000 counts | High rate bins dominated by noise | Noise dominated (total time) | Noise dominated (detector-on time) | Marked lightcurve |
|---|---|---|---|---|---|---|---|
| A | 7655 | 7641 | 34 | 34 | 0.44% | 0.44% | 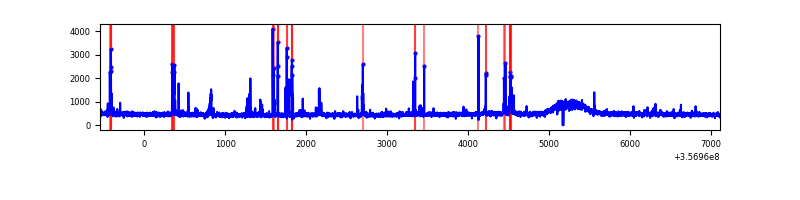 |
| B | 7656 | 7642 | 18 | 18 | 0.24% | 0.24% | 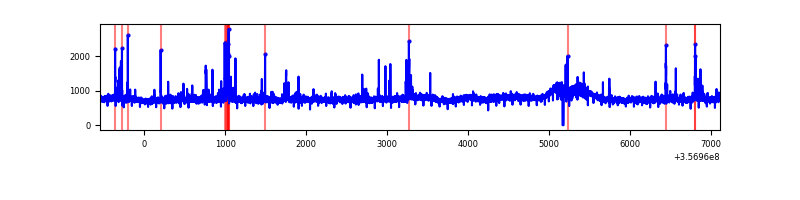 |
| C | 7656 | 7642 | 21 | 21 | 0.27% | 0.27% | 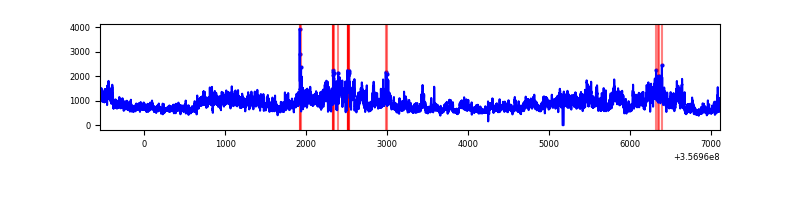 |
| D | 7655 | 7641 | 16 | 16 | 0.21% | 0.21% | 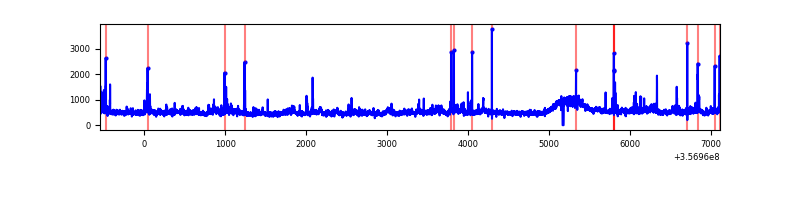 |
Top three noisy pixels from each quadrant. If the there are fewer than three noisy pixels in the level2.evt file, extra rows are filled as -1
| Pixel properties | Quadrant properties | ||||||
|---|---|---|---|---|---|---|---|
| Quadrant | DetID | PixID | Counts | Sigma | Mean | Median | Sigma |
| A | 0 | 13 | 296714 | 1577.32 | 938 | 915 | 187.5 |
| A | 13 | 254 | 12643 | 62.54 | 938 | 915 | 187.5 |
| A | 3 | 137 | 9704 | 46.87 | 938 | 915 | 187.5 |
| B | 6 | 159 | 2163656 | 12167.42 | 915 | 888 | 177.8 |
| B | 4 | 171 | 98955 | 551.71 | 915 | 888 | 177.8 |
| B | 0 | 190 | 83189 | 463.01 | 915 | 888 | 177.8 |
| C | 3 | 233 | 3153060 | 14905.68 | 894 | 900 | 211.5 |
| C | 14 | 238 | 145086 | 681.81 | 894 | 900 | 211.5 |
| C | 10 | 20 | 37169 | 171.51 | 894 | 900 | 211.5 |
| D | 8 | 195 | 282751 | 1258.62 | 921 | 898 | 223.9 |
| D | 12 | 227 | 156638 | 695.46 | 921 | 898 | 223.9 |
| D | 13 | 104 | 99856 | 441.9 | 921 | 898 | 223.9 |
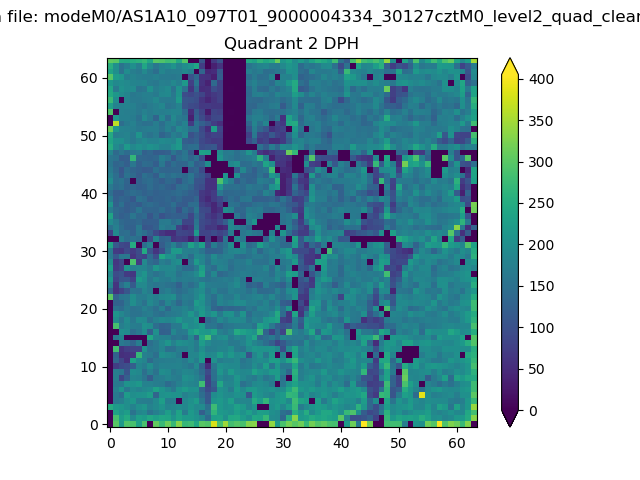
Histogram calculated using DETX and DETY for each event in the final _common_clean file
| Quadrant A | 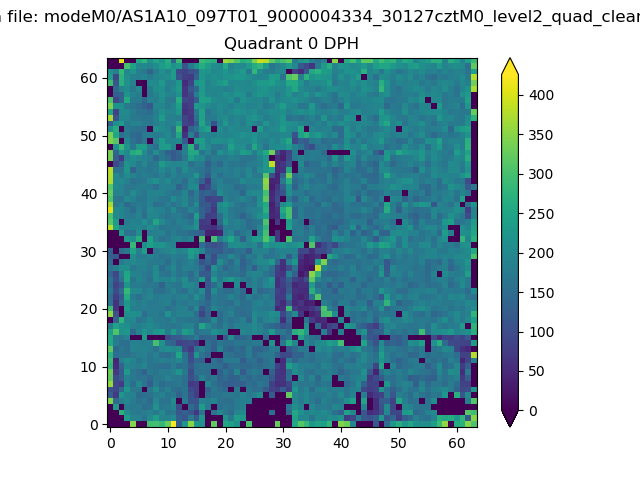 |
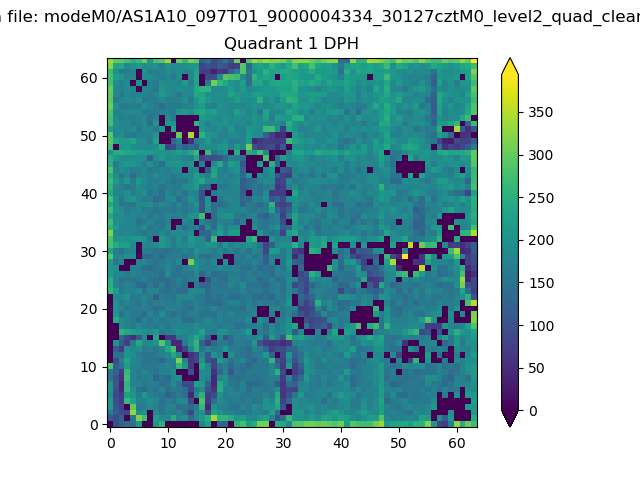 |
Quadrant B |
|---|---|---|---|
| Quadrant D | 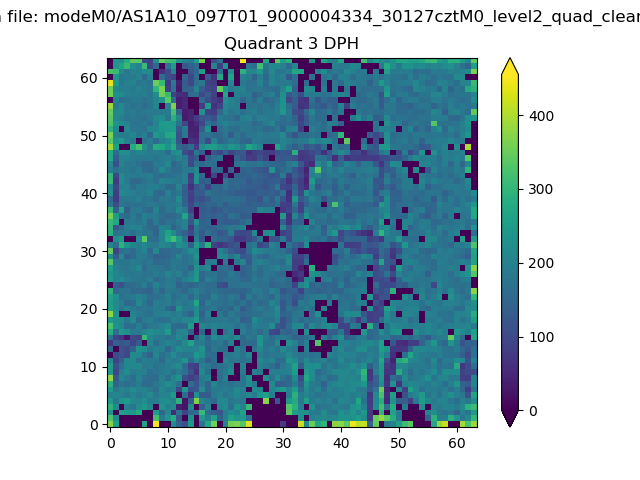 |
 |
Quadrant C |
| Plot type | Count rate plots | Images |
|---|---|---|
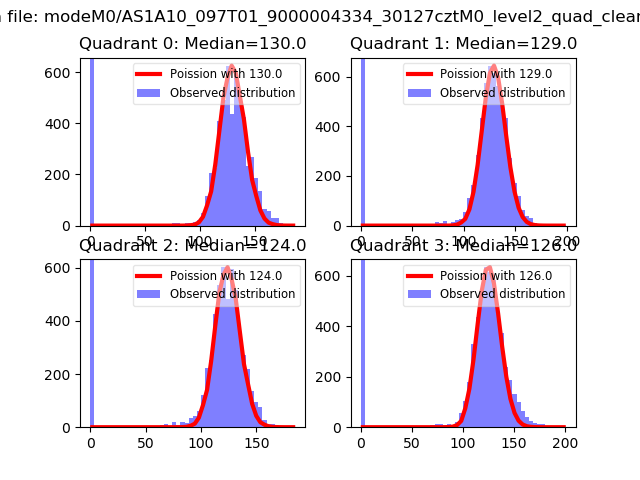
| Comparison with Poisson distribution Blue bars denote a histogram of data divided into 1 sec bins. Red curve is a Poisson curve with rate = median count rate of data. |
 |
 |
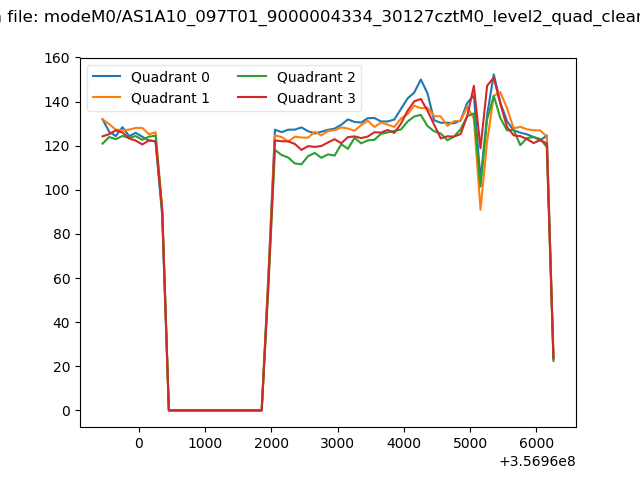
| Quadrant-wise count rates Data is divided into 100 sec bins |
 |
|
| Module-wise count rates for Quadrant A Data is divided into 100 sec bins |
 |
 |
| Module-wise count rates for Quadrant B Data is divided into 100 sec bins |
 |
 |
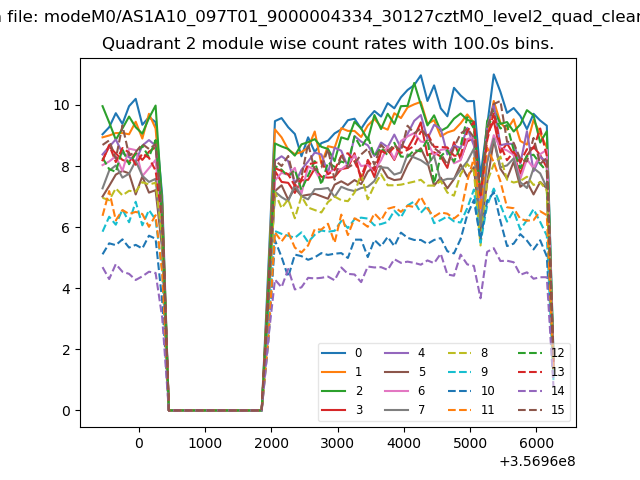
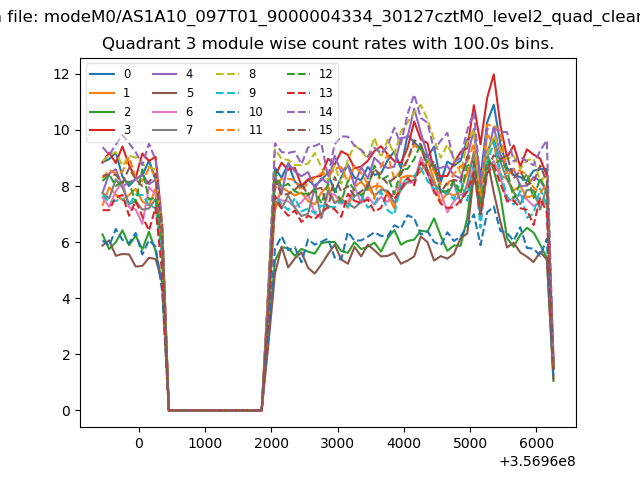
| Module-wise count rates for Quadrant C Data is divided into 100 sec bins |
 |
 |
| Module-wise count rates for Quadrant D Data is divided into 100 sec bins |
 |
 |
| Parameter | Plot |
|---|---|
| CZT HV Monitor | 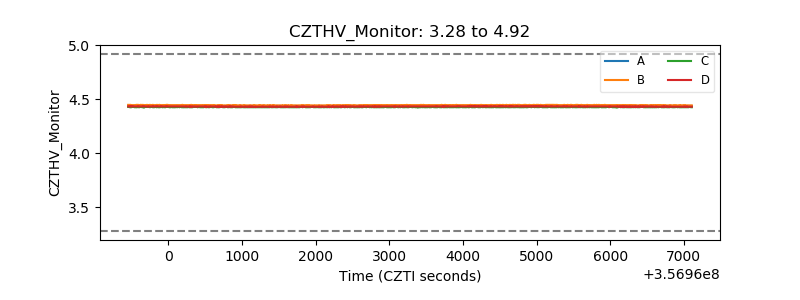 |
| D_VDD | 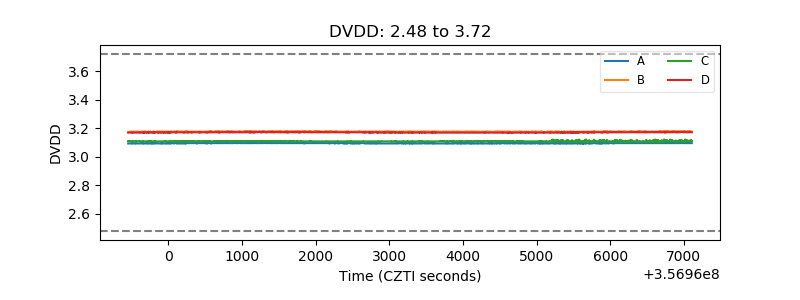 |
| Temperature 1 | 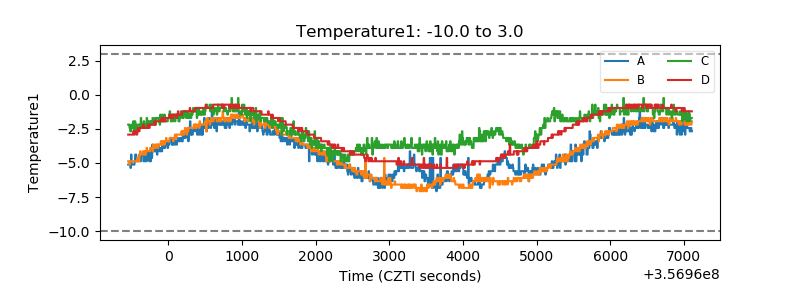 |
| Veto HV Monitor | 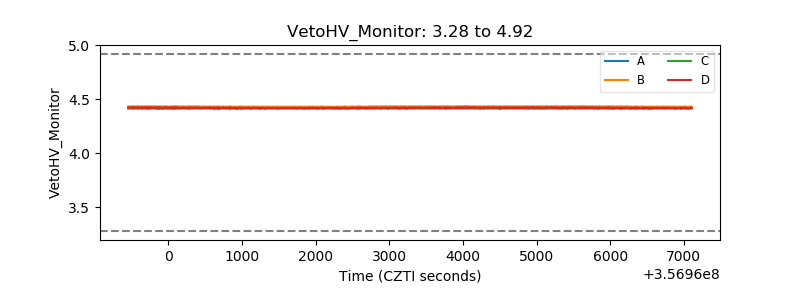 |
| Veto LLD | 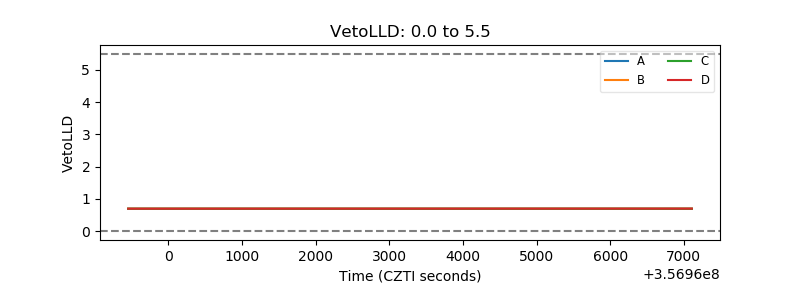 |
| Alpha Counter | 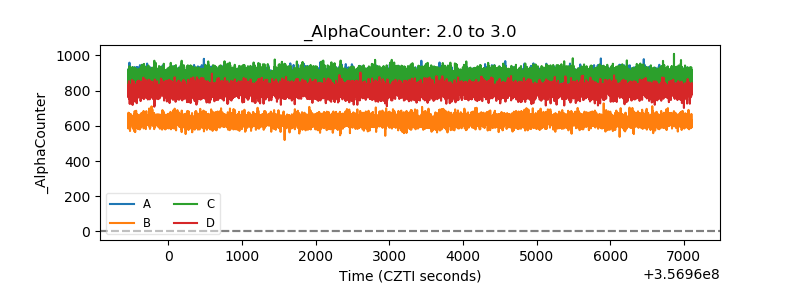 |
| _CPM_Rate | 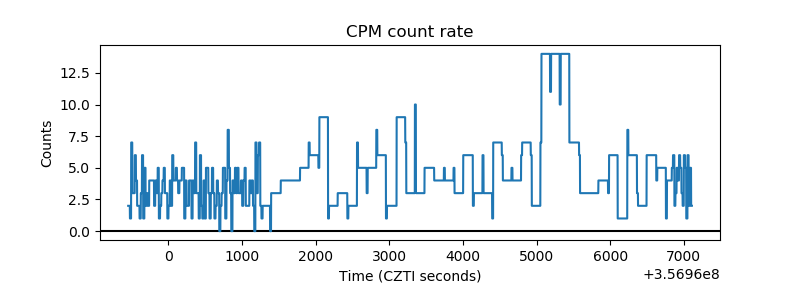 |
| CZT Counter | 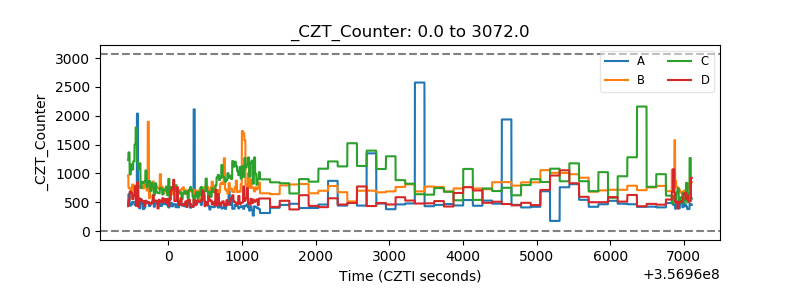 |
| +2.5 Volts monitor | 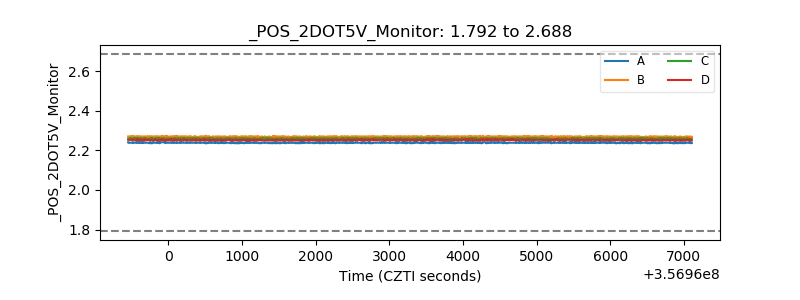 |
| +5 Volts monitor |  |
| _ROLL_ROT | 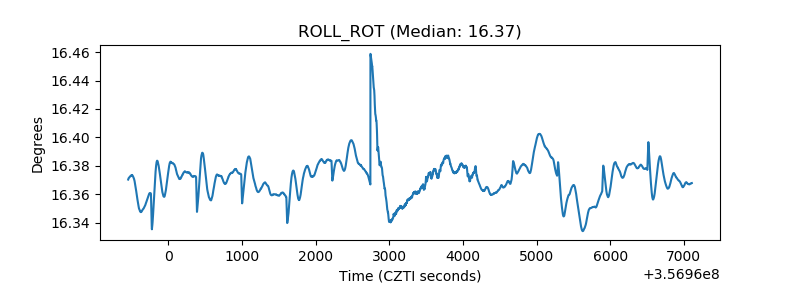 |
| _Roll_DEC |  |
| _Roll_RA | 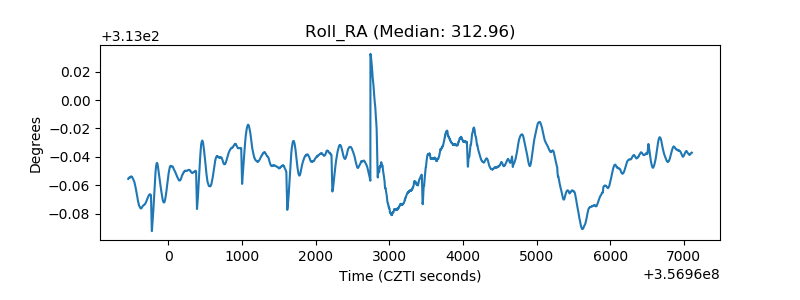 |
| Veto Counter |  |