| Param | Original file | Final file |
|---|---|---|
| Filename | modeM0/AS1A10_097T01_9000004334_30128cztM0_level2.evt | modeM0/AS1A10_097T01_9000004334_30128cztM0_level2_quad_clean.evt |
| Size (bytes) | 652,976,640 | 88,551,360 |
| Size | 622.7 MB | 84.4 MB |
| Events in quadrant A | 3,698,192 | 556,496 |
| Events in quadrant B | 5,478,069 | 556,521 |
| Events in quadrant C | 6,125,976 | 530,493 |
| Events in quadrant D | 3,991,308 | 541,405 |
| Mode M9 | |||
|---|---|---|---|
| Quadrant | BADHDUFLAG | Total packets | Discarded packets |
| A | 0 | 3 | 0 |
| B | 0 | 3 | 0 |
| C | 0 | 3 | 0 |
| D | 0 | 3 | 0 |
| Mode SS | |||
|---|---|---|---|
| Quadrant | BADHDUFLAG | Total packets | Discarded packets |
| A | 0 | 144 | 0 |
| B | 0 | 144 | 0 |
| C | 0 | 144 | 0 |
| D | 0 | 144 | 0 |
| Mode M0 | |||
|---|---|---|---|
| Quadrant | BADHDUFLAG | Total packets | Discarded packets |
| A | 0 | 15703 | 1 |
| B | 0 | 21701 | 1 |
| C | 0 | 23184 | 1 |
| D | 0 | 16347 | 1 |
| Quadrant | Total seconds | Saturated seconds | Saturation percentage |
|---|---|---|---|
| A | 7131 | 171 | 2.397981% |
| B | 7132 | 194 | 2.720135% |
| C | 7132 | 481 | 6.744251% |
| D | 7132 | 79 | 1.107684% |
Noise dominated data is calculated using 1-second bins in cleaned event files. If a bin has >2000 counts, and if more than 50% of those come from <1% of pixels, then it is considered to be noise-dominated and hence unusable.
| Quadrant | # 1 sec bins | Bins with >0 counts | Bins with >2000 counts | High rate bins dominated by noise | Noise dominated (total time) | Noise dominated (detector-on time) | Marked lightcurve |
|---|---|---|---|---|---|---|---|
| A | 7436 | 7132 | 61 | 61 | 0.82% | 0.86% |  |
| B | 7437 | 7133 | 9 | 9 | 0.12% | 0.13% |  |
| C | 7437 | 7133 | 131 | 131 | 1.76% | 1.84% |  |
| D | 7437 | 7133 | 27 | 27 | 0.36% | 0.38% |  |
Top three noisy pixels from each quadrant. If the there are fewer than three noisy pixels in the level2.evt file, extra rows are filled as -1
| Pixel properties | Quadrant properties | ||||||
|---|---|---|---|---|---|---|---|
| Quadrant | DetID | PixID | Counts | Sigma | Mean | Median | Sigma |
| A | 0 | 13 | 392883 | 2282.31 | 854 | 835 | 171.8 |
| A | 13 | 254 | 11879 | 64.29 | 854 | 835 | 171.8 |
| A | 8 | 192 | 10833 | 58.2 | 854 | 835 | 171.8 |
| B | 6 | 159 | 2048295 | 12589.73 | 840 | 816 | 162.6 |
| B | 0 | 190 | 92771 | 565.42 | 840 | 816 | 162.6 |
| B | 15 | 201 | 27158 | 161.97 | 840 | 816 | 162.6 |
| C | 3 | 233 | 2770692 | 14536.45 | 808 | 814 | 190.5 |
| C | 14 | 238 | 143930 | 751.08 | 808 | 814 | 190.5 |
| C | 2 | 114 | 16852 | 84.17 | 808 | 814 | 190.5 |
| D | 8 | 195 | 283210 | 1378.95 | 830 | 809 | 204.8 |
| D | 13 | 104 | 222042 | 1080.27 | 830 | 809 | 204.8 |
| D | 12 | 227 | 208668 | 1014.97 | 830 | 809 | 204.8 |
Histogram calculated using DETX and DETY for each event in the final _common_clean file
| Quadrant A |  |
 |
Quadrant B |
|---|---|---|---|
| Quadrant D |  |
 |
Quadrant C |
| Plot type | Count rate plots | Images |
|---|---|---|
| Comparison with Poisson distribution Blue bars denote a histogram of data divided into 1 sec bins. Red curve is a Poisson curve with rate = median count rate of data. |
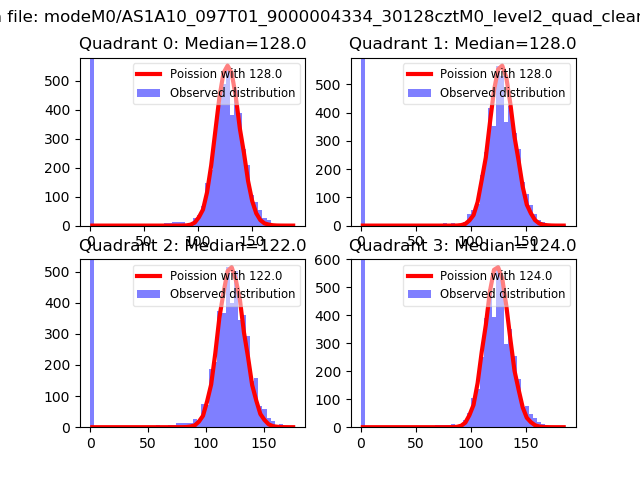 |
 |
| Quadrant-wise count rates Data is divided into 100 sec bins |
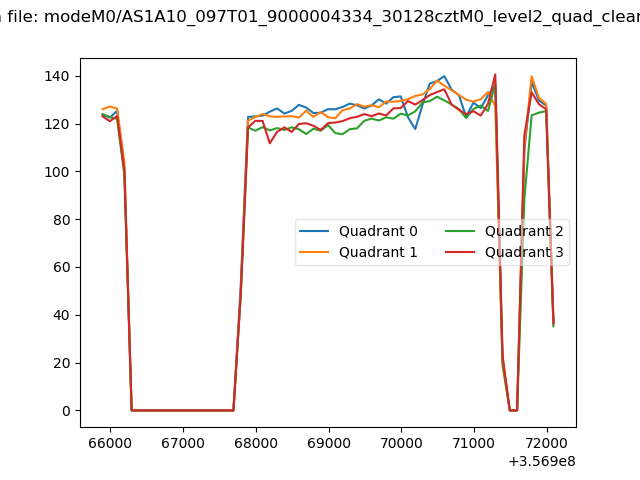 |
|
| Module-wise count rates for Quadrant A Data is divided into 100 sec bins |
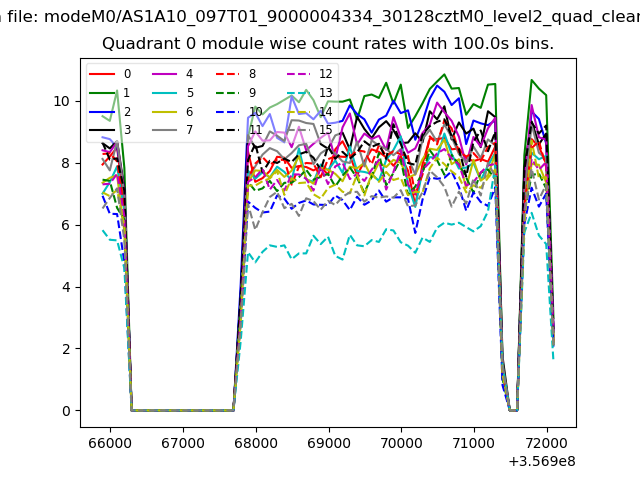 |
 |
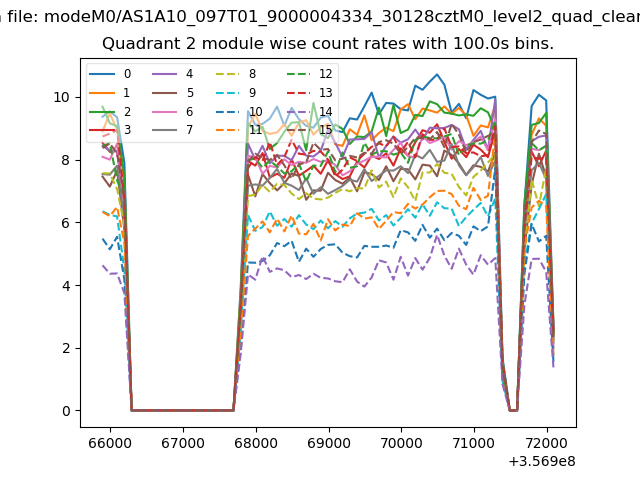
| Module-wise count rates for Quadrant B Data is divided into 100 sec bins |
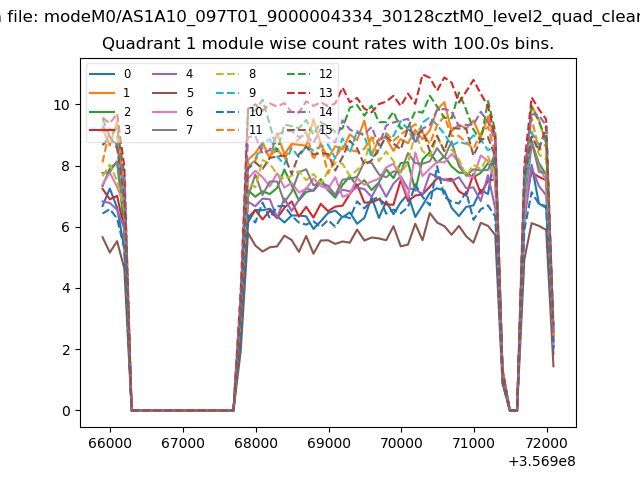 |
 |
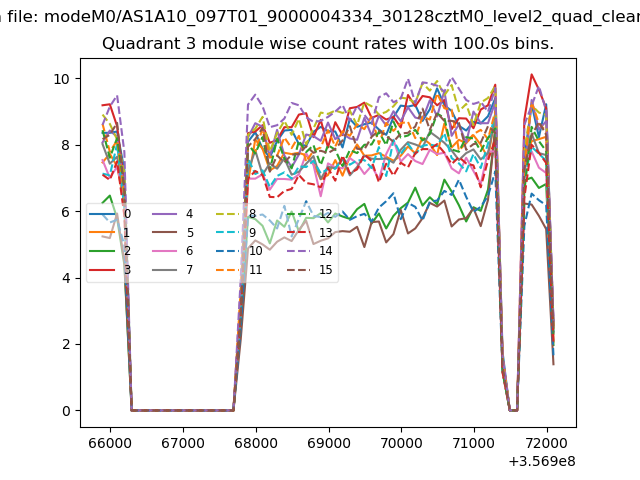
| Module-wise count rates for Quadrant C Data is divided into 100 sec bins |
 |
 |
| Module-wise count rates for Quadrant D Data is divided into 100 sec bins |
 |
 |
| Parameter | Plot |
|---|---|
| CZT HV Monitor | 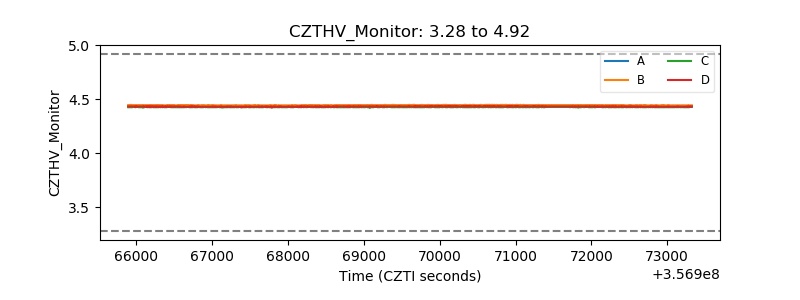 |
| D_VDD |  |
| Temperature 1 |  |
| Veto HV Monitor |  |
| Veto LLD |  |
| Alpha Counter | 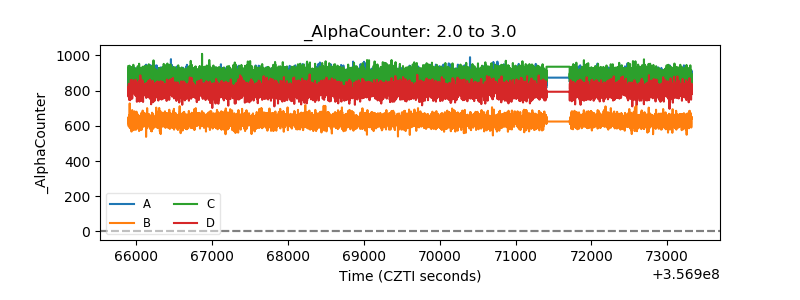 |
| _CPM_Rate | 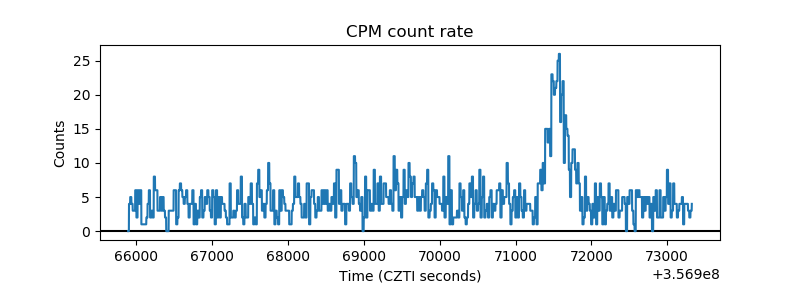 |
| CZT Counter |  |
| +2.5 Volts monitor |  |
| +5 Volts monitor |  |
| _ROLL_ROT | 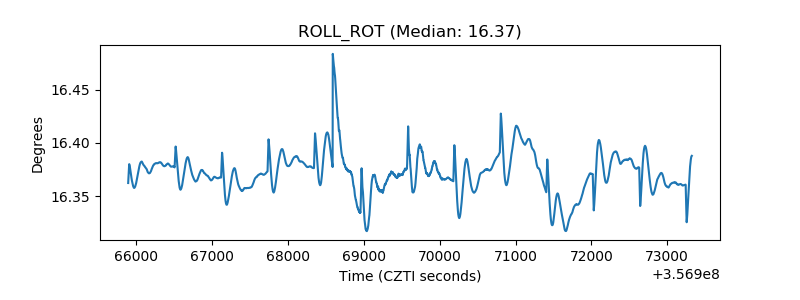 |
| _Roll_DEC | 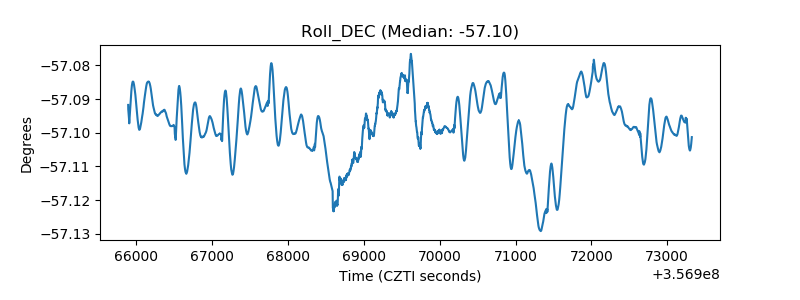 |
| _Roll_RA |  |
| Veto Counter | 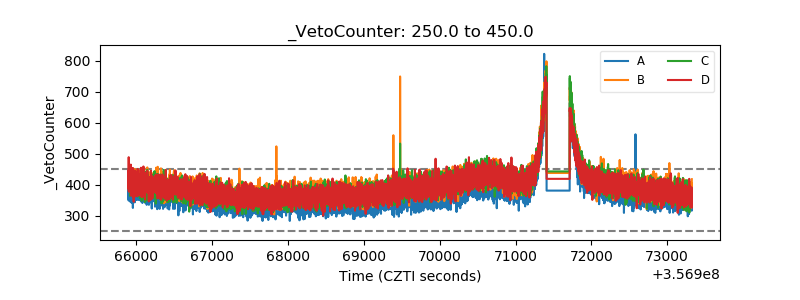 |