| Param | Original file | Final file |
|---|---|---|
| Filename | modeM0/AS1A10_097T01_9000004334_30131cztM0_level2.evt | modeM0/AS1A10_097T01_9000004334_30131cztM0_level2_quad_clean.evt |
| Size (bytes) | 2,019,827,520 | 256,567,680 |
| Size | 1.9 GB | 244.7 MB |
| Events in quadrant A | 9,687,335 | 1,709,879 |
| Events in quadrant B | 13,958,454 | 1,703,129 |
| Events in quadrant C | 27,006,684 | 1,443,068 |
| Events in quadrant D | 9,289,894 | 1,652,931 |
| Mode M9 | |||
|---|---|---|---|
| Quadrant | BADHDUFLAG | Total packets | Discarded packets |
| A | 0 | 21 | 0 |
| B | 0 | 21 | 0 |
| C | 0 | 21 | 0 |
| D | 0 | 21 | 0 |
| Mode SS | |||
|---|---|---|---|
| Quadrant | BADHDUFLAG | Total packets | Discarded packets |
| A | 0 | 370 | 0 |
| B | 0 | 370 | 0 |
| C | 0 | 370 | 0 |
| D | 0 | 370 | 0 |
| Mode M0 | |||
|---|---|---|---|
| Quadrant | BADHDUFLAG | Total packets | Discarded packets |
| A | 0 | 40904 | 3 |
| B | 0 | 55243 | 3 |
| C | 0 | 93104 | 7 |
| D | 0 | 39447 | 3 |
| Quadrant | Total seconds | Saturated seconds | Saturation percentage |
|---|---|---|---|
| A | 18286 | 380 | 2.078093% |
| B | 18287 | 300 | 1.640510% |
| C | 18286 | 6360 | 34.780707% |
| D | 18286 | 143 | 0.782019% |
Noise dominated data is calculated using 1-second bins in cleaned event files. If a bin has >2000 counts, and if more than 50% of those come from <1% of pixels, then it is considered to be noise-dominated and hence unusable.
| Quadrant | # 1 sec bins | Bins with >0 counts | Bins with >2000 counts | High rate bins dominated by noise | Noise dominated (total time) | Noise dominated (detector-on time) | Marked lightcurve |
|---|---|---|---|---|---|---|---|
| A | 20341 | 18289 | 174 | 174 | 0.86% | 0.95% | 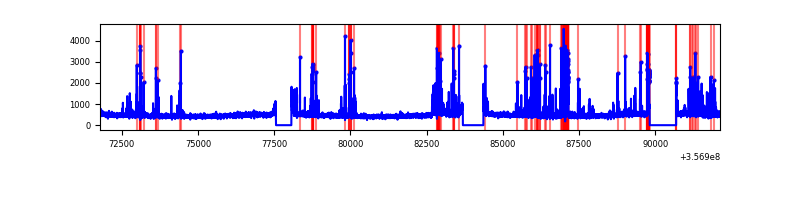 |
| B | 20342 | 18290 | 13 | 13 | 0.06% | 0.07% | 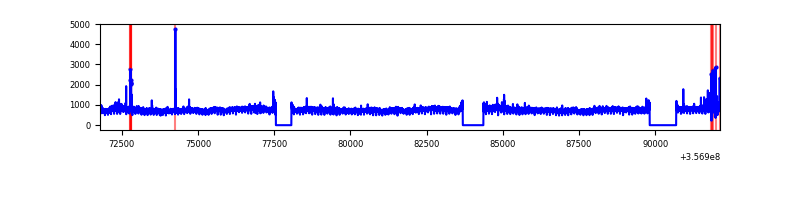 |
| C | 20341 | 18288 | 4219 | 4219 | 20.74% | 23.07% | 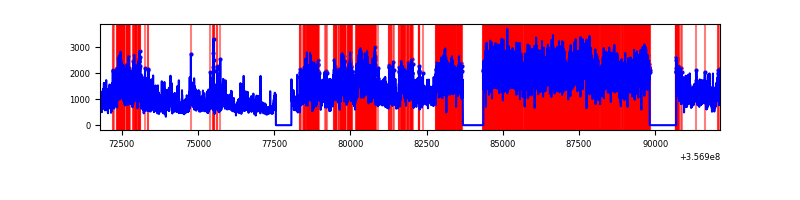 |
| D | 20341 | 18289 | 41 | 41 | 0.20% | 0.22% | 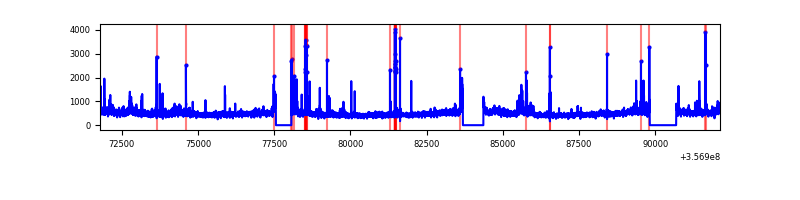 |
Top three noisy pixels from each quadrant. If the there are fewer than three noisy pixels in the level2.evt file, extra rows are filled as -1
| Pixel properties | Quadrant properties | ||||||
|---|---|---|---|---|---|---|---|
| Quadrant | DetID | PixID | Counts | Sigma | Mean | Median | Sigma |
| A | 0 | 13 | 1285321 | 2966.46 | 2170 | 2122 | 432.6 |
| A | 8 | 192 | 34226 | 74.22 | 2170 | 2122 | 432.6 |
| A | 13 | 254 | 31442 | 67.78 | 2170 | 2122 | 432.6 |
| B | 6 | 159 | 5329456 | 13056.89 | 2153 | 2095 | 408.0 |
| B | 0 | 190 | 69097 | 164.22 | 2153 | 2095 | 408.0 |
| B | 12 | 111 | 51495 | 121.08 | 2153 | 2095 | 408.0 |
| C | 3 | 233 | 19140967 | 43055.8 | 1902 | 1907 | 444.5 |
| C | 14 | 238 | 339655 | 759.81 | 1902 | 1907 | 444.5 |
| C | 14 | 254 | 56960 | 123.85 | 1902 | 1907 | 444.5 |
| D | 8 | 195 | 543233 | 1039.53 | 2109 | 2060 | 520.6 |
| D | 13 | 104 | 202719 | 385.44 | 2109 | 2060 | 520.6 |
| D | 12 | 227 | 171534 | 325.54 | 2109 | 2060 | 520.6 |
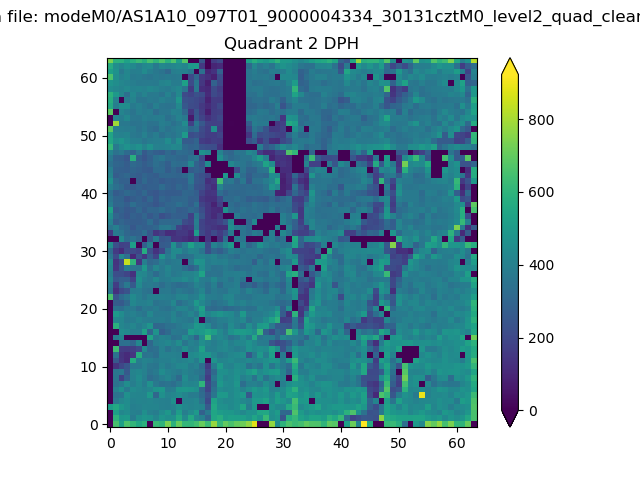
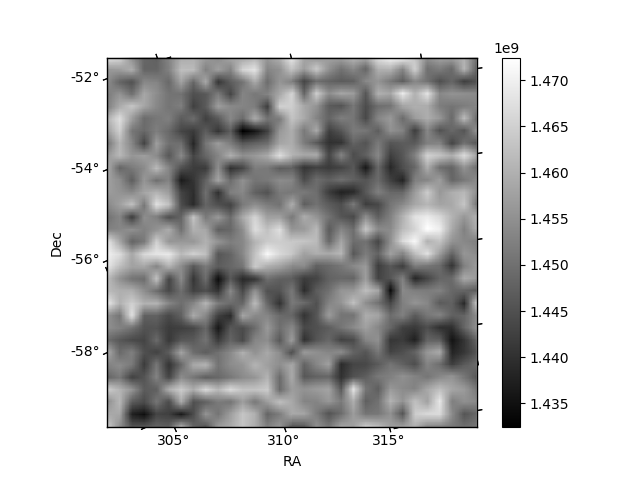
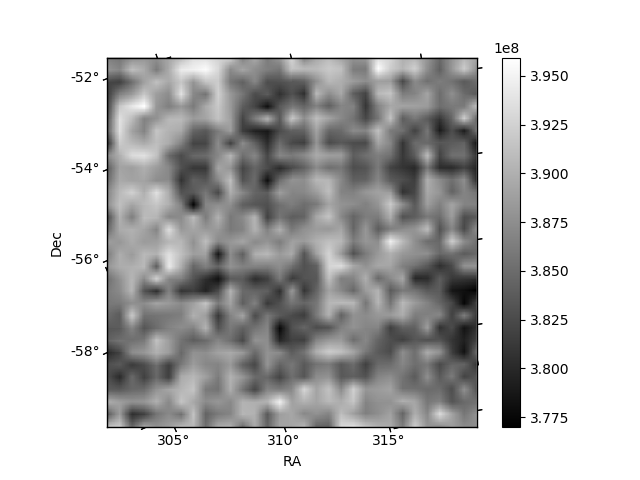
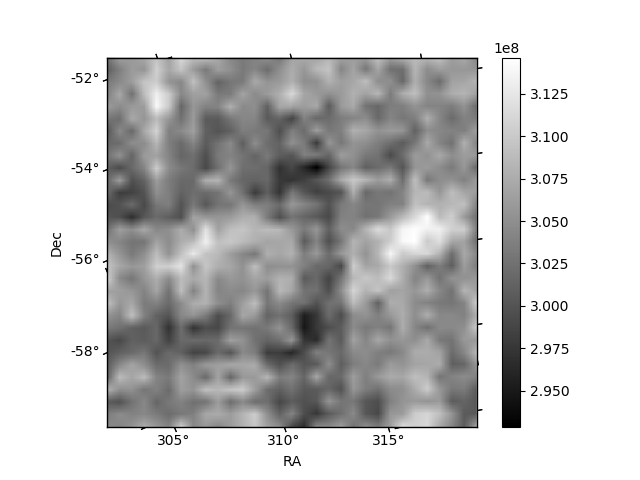
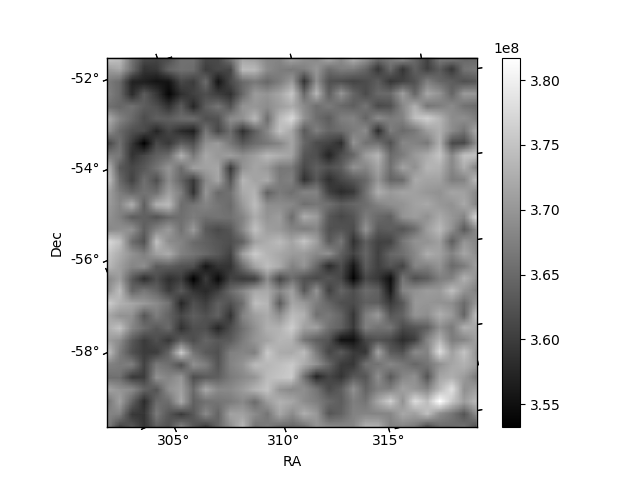
Histogram calculated using DETX and DETY for each event in the final _common_clean file
| Quadrant A | 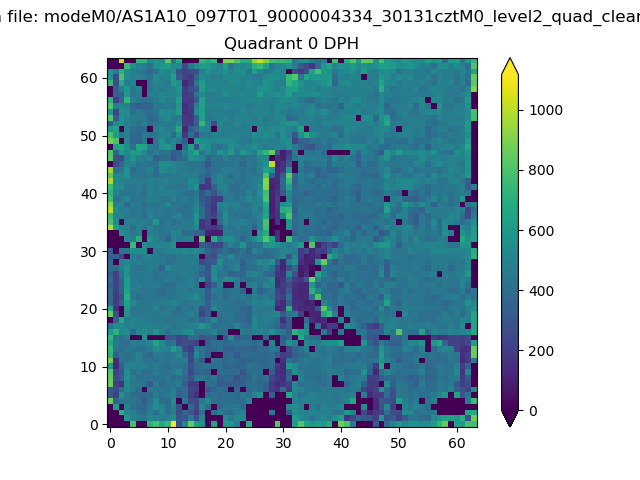 |
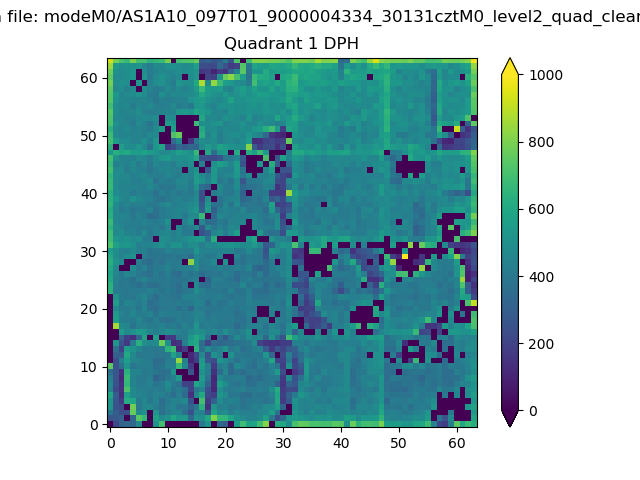 |
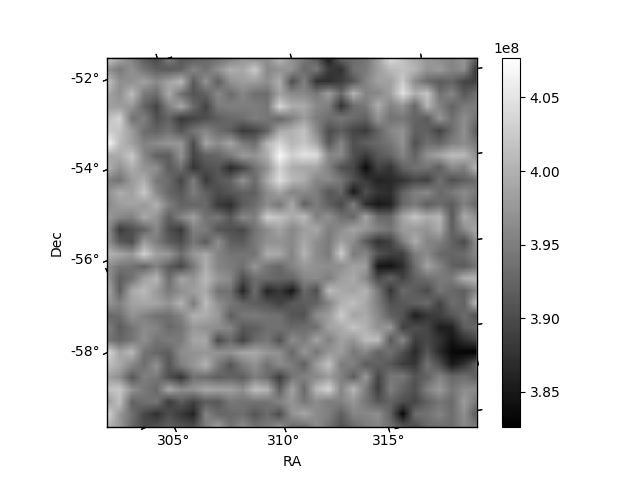
Quadrant B |
|---|---|---|---|
| Quadrant D | 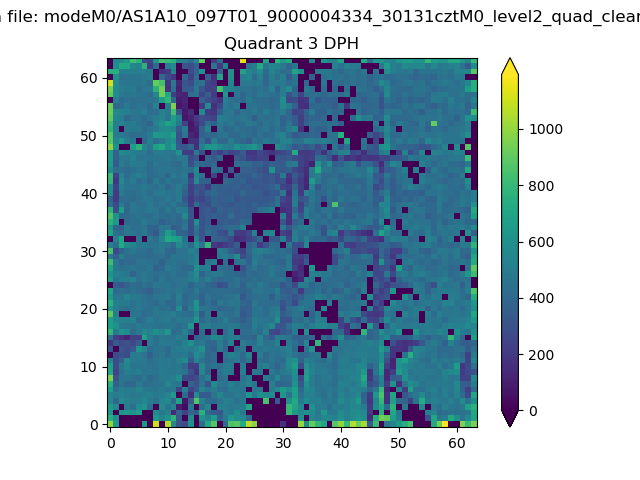 |
 |
Quadrant C |
| Plot type | Count rate plots | Images |
|---|---|---|
| Comparison with Poisson distribution Blue bars denote a histogram of data divided into 1 sec bins. Red curve is a Poisson curve with rate = median count rate of data. |
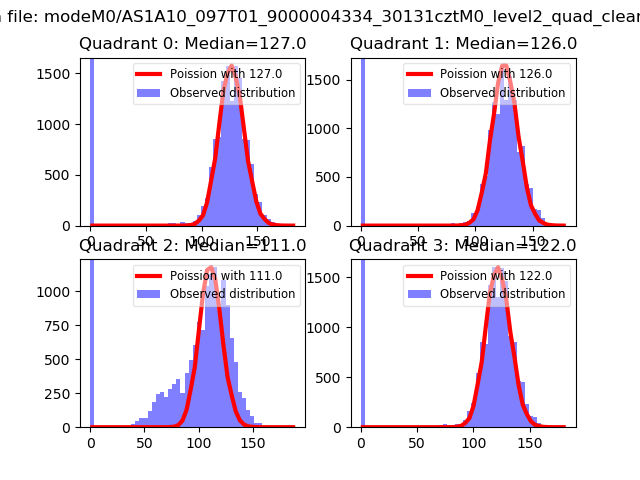 |
 |
| Quadrant-wise count rates Data is divided into 100 sec bins |
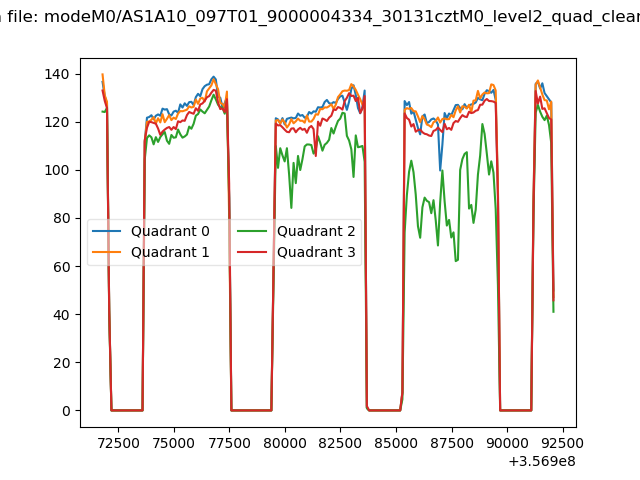 |
|
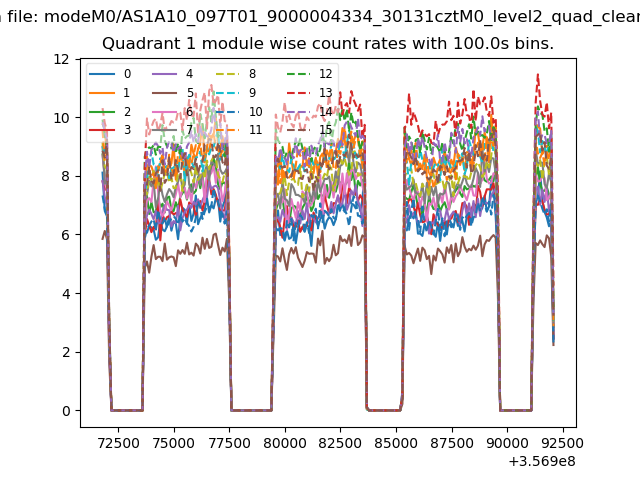
| Module-wise count rates for Quadrant A Data is divided into 100 sec bins |
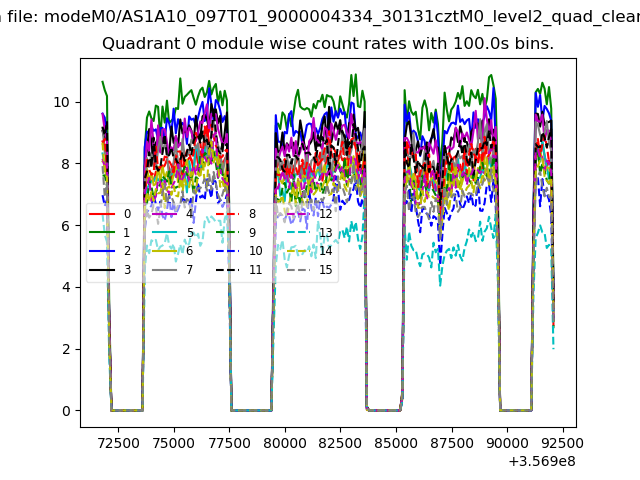 |
 |
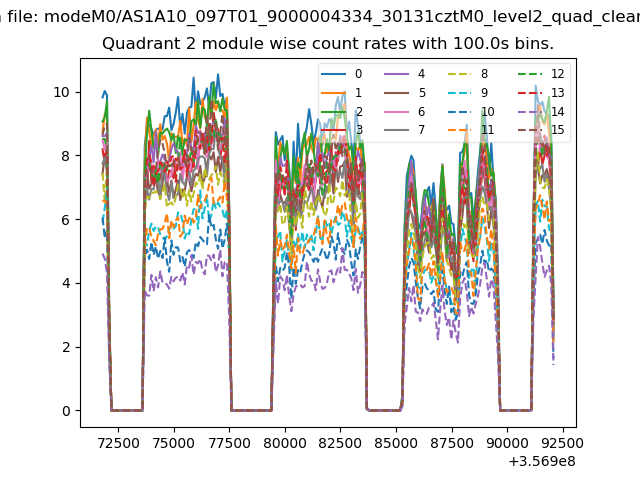
| Module-wise count rates for Quadrant B Data is divided into 100 sec bins |
 |
 |
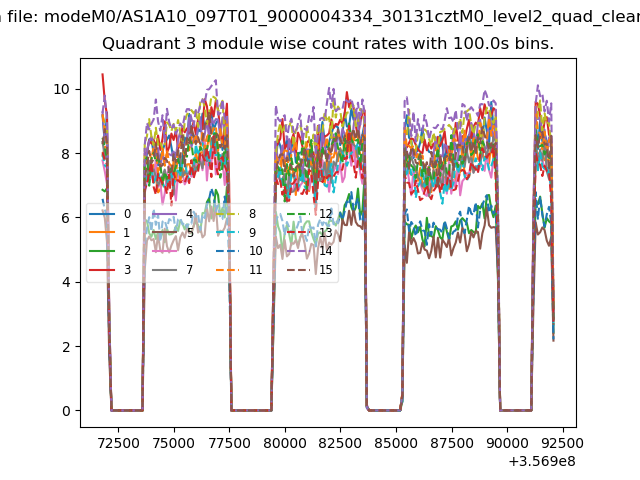
| Module-wise count rates for Quadrant C Data is divided into 100 sec bins |
 |
 |
| Module-wise count rates for Quadrant D Data is divided into 100 sec bins |
 |
 |
| Parameter | Plot |
|---|---|
| CZT HV Monitor | 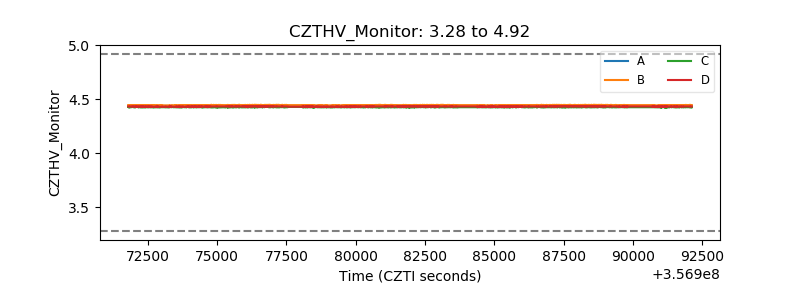 |
| D_VDD | 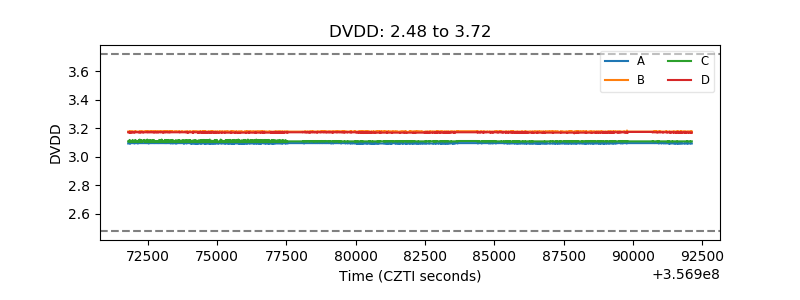 |
| Temperature 1 | 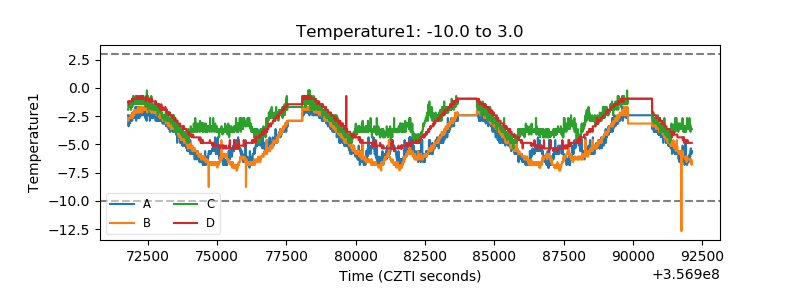 |
| Veto HV Monitor | 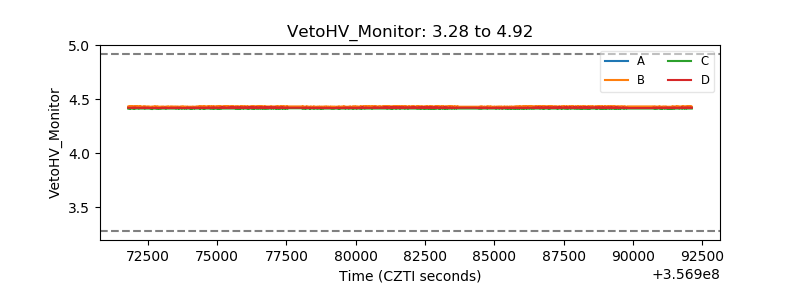 |
| Veto LLD | 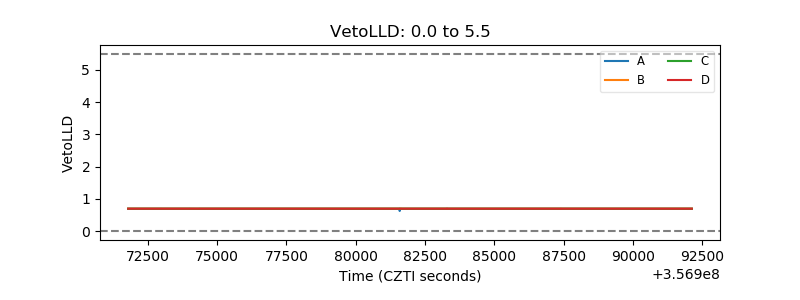 |
| Alpha Counter | 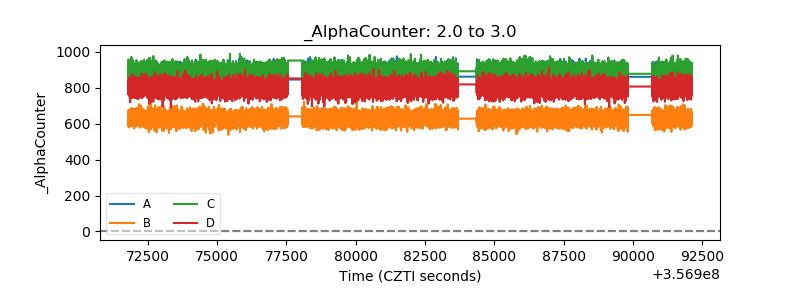 |
| _CPM_Rate | 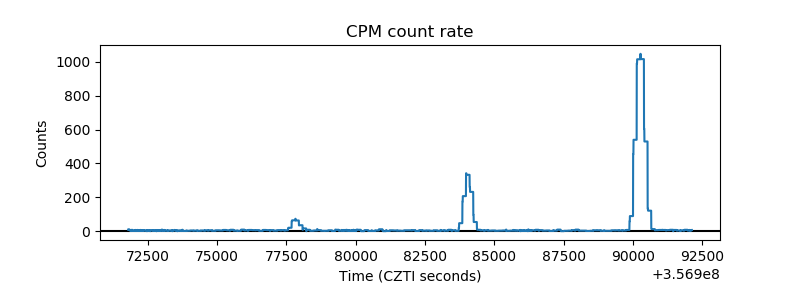 |
| CZT Counter | 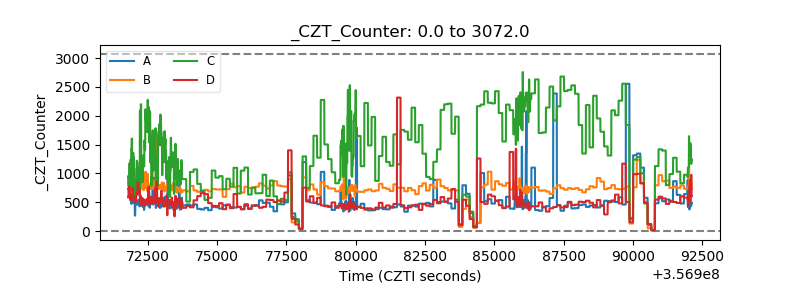 |
| +2.5 Volts monitor |  |
| +5 Volts monitor |  |
| _ROLL_ROT | 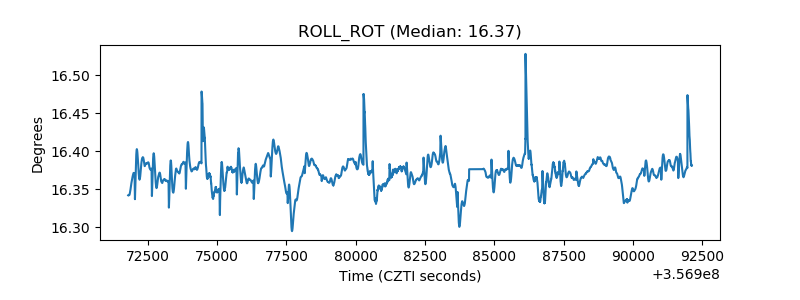 |
| _Roll_DEC | 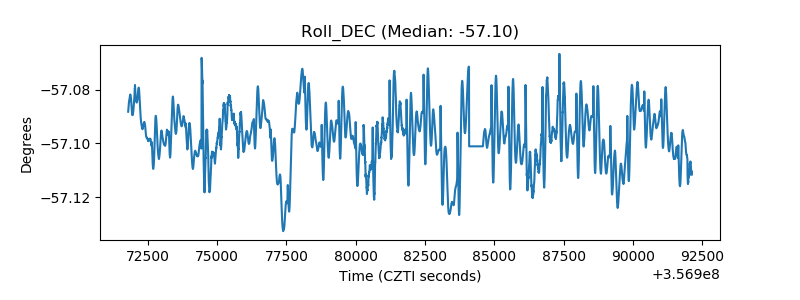 |
| _Roll_RA | 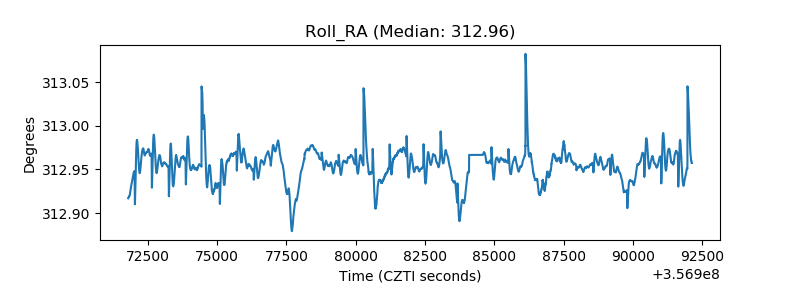 |
| Veto Counter | 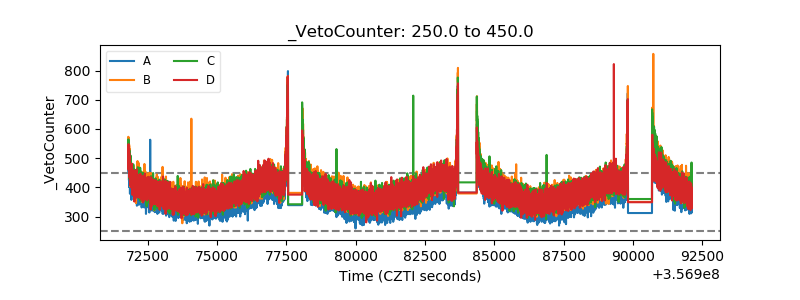 |