| Param | Original file | Final file |
|---|---|---|
| Filename | modeM0/AS1A10_097T01_9000004334_30132cztM0_level2.evt | modeM0/AS1A10_097T01_9000004334_30132cztM0_level2_quad_clean.evt |
| Size (bytes) | 784,146,240 | 105,393,600 |
| Size | 747.8 MB | 100.5 MB |
| Events in quadrant A | 3,471,323 | 722,864 |
| Events in quadrant B | 5,118,153 | 721,448 |
| Events in quadrant C | 11,267,052 | 595,418 |
| Events in quadrant D | 3,447,654 | 692,566 |
| Mode M9 | |||
|---|---|---|---|
| Quadrant | BADHDUFLAG | Total packets | Discarded packets |
| A | 0 | 11 | 0 |
| B | 0 | 12 | 0 |
| C | 0 | 12 | 0 |
| D | 0 | 12 | 0 |
| Mode SS | |||
|---|---|---|---|
| Quadrant | BADHDUFLAG | Total packets | Discarded packets |
| A | 0 | 134 | 0 |
| B | 0 | 134 | 0 |
| C | 0 | 134 | 0 |
| D | 0 | 134 | 0 |
| Mode M0 | |||
|---|---|---|---|
| Quadrant | BADHDUFLAG | Total packets | Discarded packets |
| A | 0 | 14575 | 2 |
| B | 0 | 19942 | 3 |
| C | 0 | 38049 | 2 |
| D | 0 | 14470 | 2 |
| Quadrant | Total seconds | Saturated seconds | Saturation percentage |
|---|---|---|---|
| A | 6577 | 100 | 1.520450% |
| B | 6576 | 95 | 1.444647% |
| C | 6576 | 2858 | 43.461071% |
| D | 6576 | 34 | 0.517032% |
Noise dominated data is calculated using 1-second bins in cleaned event files. If a bin has >2000 counts, and if more than 50% of those come from <1% of pixels, then it is considered to be noise-dominated and hence unusable.
| Quadrant | # 1 sec bins | Bins with >0 counts | Bins with >2000 counts | High rate bins dominated by noise | Noise dominated (total time) | Noise dominated (detector-on time) | Marked lightcurve |
|---|---|---|---|---|---|---|---|
| A | 7582 | 6578 | 40 | 40 | 0.53% | 0.61% |  |
| B | 7581 | 6577 | 6 | 6 | 0.08% | 0.09% |  |
| C | 7581 | 6576 | 1844 | 1844 | 24.32% | 28.04% |  |
| D | 7581 | 6577 | 7 | 7 | 0.09% | 0.11% |  |
Top three noisy pixels from each quadrant. If the there are fewer than three noisy pixels in the level2.evt file, extra rows are filled as -1
| Pixel properties | Quadrant properties | ||||||
|---|---|---|---|---|---|---|---|
| Quadrant | DetID | PixID | Counts | Sigma | Mean | Median | Sigma |
| A | 0 | 13 | 349363 | 2152.87 | 803 | 789 | 161.9 |
| A | 8 | 192 | 23041 | 137.43 | 803 | 789 | 161.9 |
| A | 13 | 254 | 12132 | 70.06 | 803 | 789 | 161.9 |
| B | 6 | 159 | 1925480 | 12540.99 | 796 | 774 | 153.5 |
| B | 3 | 64 | 45283 | 290.01 | 796 | 774 | 153.5 |
| B | 12 | 111 | 18857 | 117.82 | 796 | 774 | 153.5 |
| C | 3 | 233 | 8439567 | 52667.46 | 689 | 692 | 160.2 |
| C | 14 | 238 | 117030 | 726.07 | 689 | 692 | 160.2 |
| C | 14 | 254 | 15286 | 91.08 | 689 | 692 | 160.2 |
| D | 8 | 195 | 218453 | 1140.13 | 772 | 754 | 190.9 |
| D | 12 | 227 | 162282 | 845.95 | 772 | 754 | 190.9 |
| D | 2 | 250 | 40840 | 209.94 | 772 | 754 | 190.9 |
Histogram calculated using DETX and DETY for each event in the final _common_clean file
| Quadrant A |  |
 |
Quadrant B |
|---|---|---|---|
| Quadrant D |  |
 |
Quadrant C |
| Plot type | Count rate plots | Images |
|---|---|---|
| Comparison with Poisson distribution Blue bars denote a histogram of data divided into 1 sec bins. Red curve is a Poisson curve with rate = median count rate of data. |
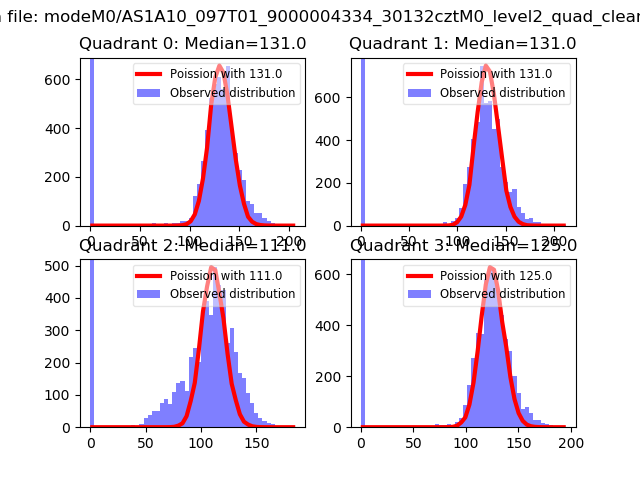 |
 |
| Quadrant-wise count rates Data is divided into 100 sec bins |
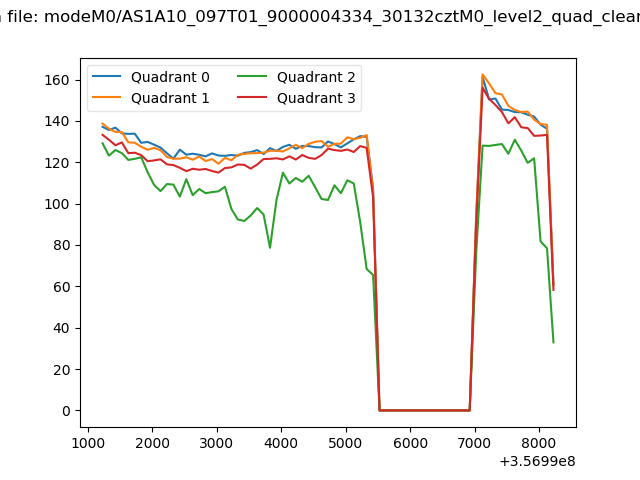 |
|
| Module-wise count rates for Quadrant A Data is divided into 100 sec bins |
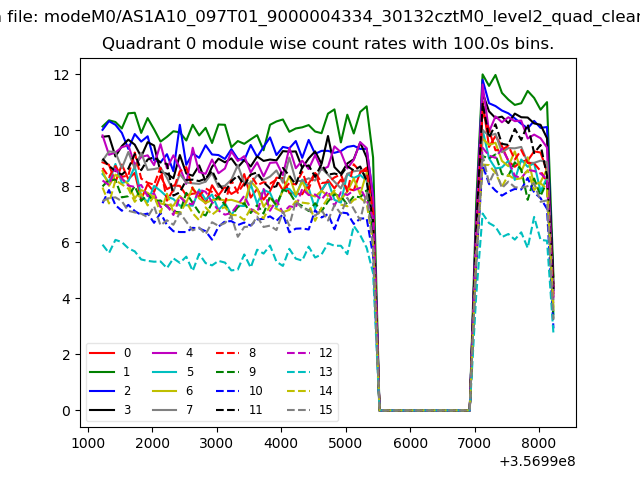 |
 |
| Module-wise count rates for Quadrant B Data is divided into 100 sec bins |
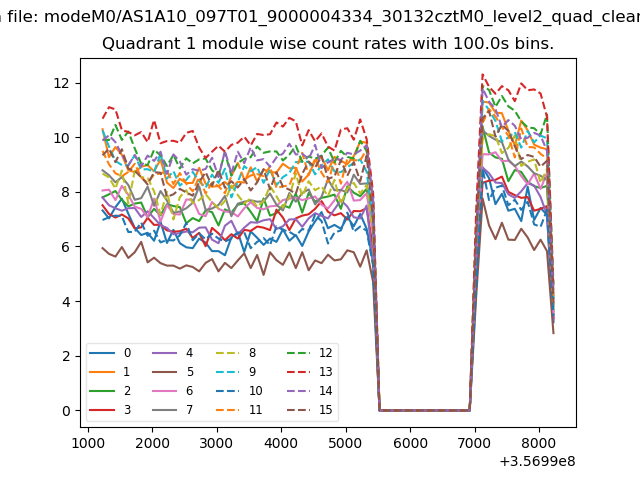 |
 |
| Module-wise count rates for Quadrant C Data is divided into 100 sec bins |
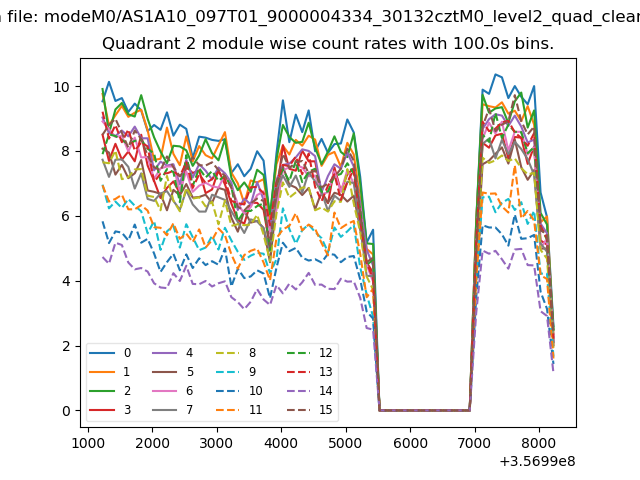 |
 |
| Module-wise count rates for Quadrant D Data is divided into 100 sec bins |
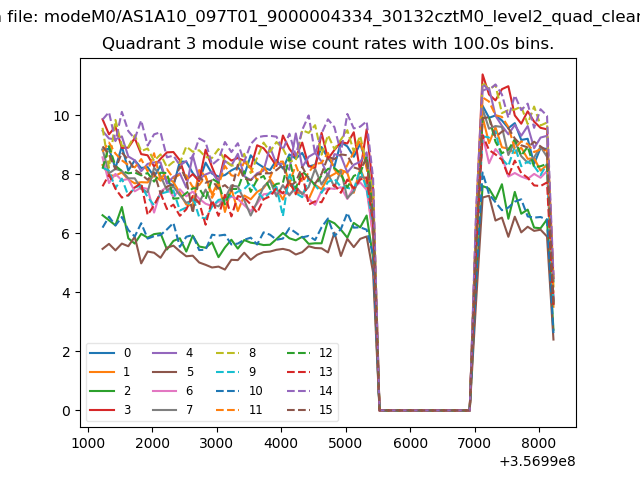 |
 |
| Parameter | Plot |
|---|---|
| CZT HV Monitor | 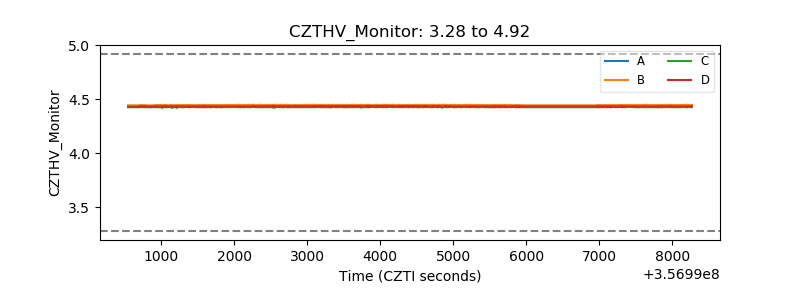 |
| D_VDD |  |
| Temperature 1 |  |
| Veto HV Monitor |  |
| Veto LLD |  |
| Alpha Counter | 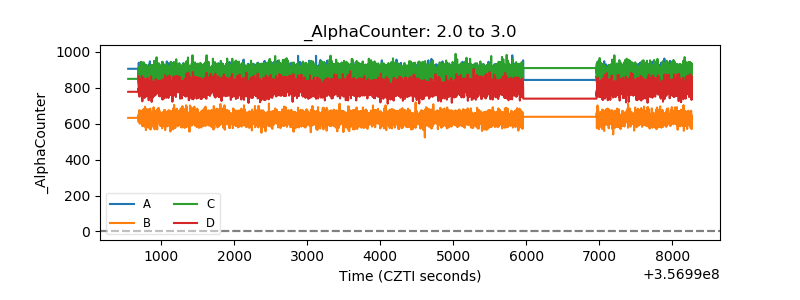 |
| _CPM_Rate | 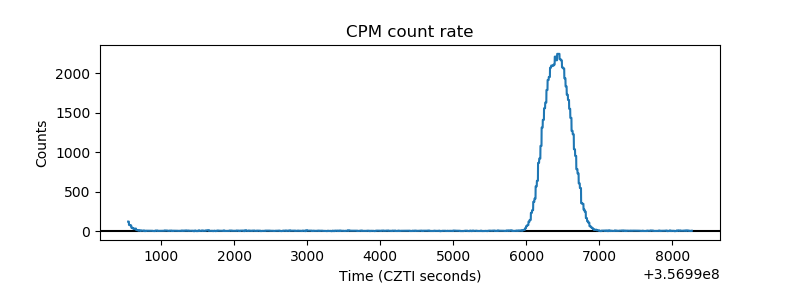 |
| CZT Counter |  |
| +2.5 Volts monitor |  |
| +5 Volts monitor |  |
| _ROLL_ROT | 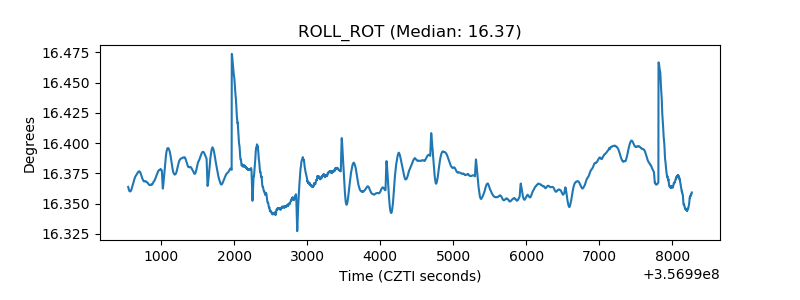 |
| _Roll_DEC | 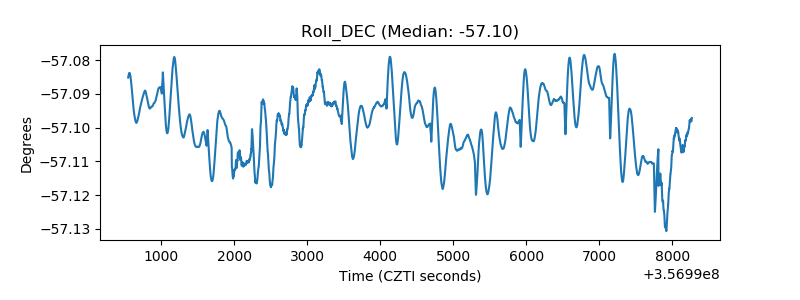 |
| _Roll_RA |  |
| Veto Counter | 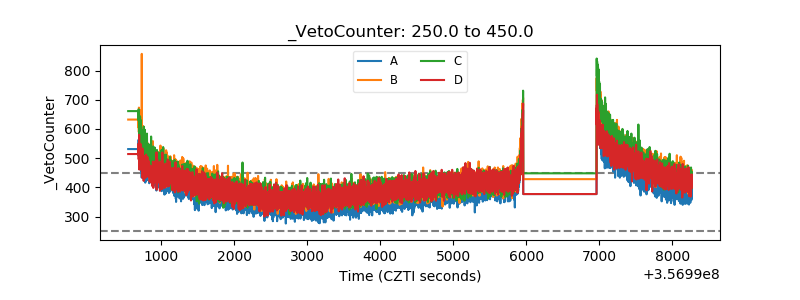 |