| Param | Original file | Final file |
|---|---|---|
| Filename | modeM0/AS1A10_097T01_9000004334_30134cztM0_level2.evt | modeM0/AS1A10_097T01_9000004334_30134cztM0_level2_quad_clean.evt |
| Size (bytes) | 485,236,800 | 72,912,960 |
| Size | 462.8 MB | 69.5 MB |
| Events in quadrant A | 2,065,490 | 512,623 |
| Events in quadrant B | 2,924,295 | 518,671 |
| Events in quadrant C | 7,528,715 | 407,498 |
| Events in quadrant D | 1,915,694 | 496,391 |
| Mode SS | |||
|---|---|---|---|
| Quadrant | BADHDUFLAG | Total packets | Discarded packets |
| A | 0 | 76 | 0 |
| B | 0 | 76 | 0 |
| C | 0 | 76 | 0 |
| D | 0 | 76 | 0 |
| Mode M0 | |||
|---|---|---|---|
| Quadrant | BADHDUFLAG | Total packets | Discarded packets |
| A | 0 | 8674 | 0 |
| B | 0 | 11546 | 0 |
| C | 0 | 25001 | 0 |
| D | 0 | 8144 | 0 |
| Quadrant | Total seconds | Saturated seconds | Saturation percentage |
|---|---|---|---|
| A | 3850 | 46 | 1.194805% |
| B | 3851 | 22 | 0.571280% |
| C | 3851 | 2270 | 58.945728% |
| D | 3851 | 3 | 0.077902% |
Noise dominated data is calculated using 1-second bins in cleaned event files. If a bin has >2000 counts, and if more than 50% of those come from <1% of pixels, then it is considered to be noise-dominated and hence unusable.
| Quadrant | # 1 sec bins | Bins with >0 counts | Bins with >2000 counts | High rate bins dominated by noise | Noise dominated (total time) | Noise dominated (detector-on time) | Marked lightcurve |
|---|---|---|---|---|---|---|---|
| A | 3850 | 3850 | 38 | 38 | 0.99% | 0.99% | 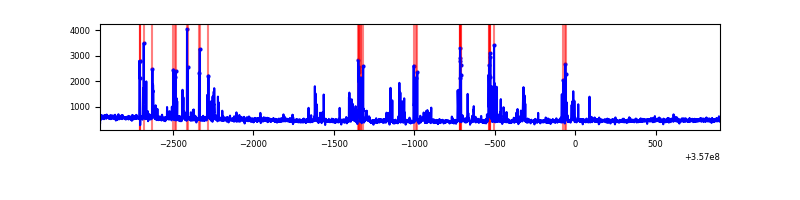 |
| B | 3851 | 3851 | 0 | 0 | 0.00% | 0.00% | 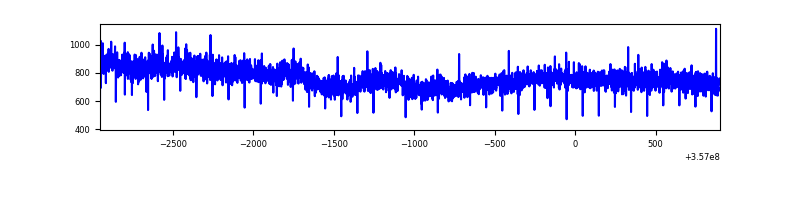 |
| C | 3850 | 3850 | 1760 | 1760 | 45.71% | 45.71% | 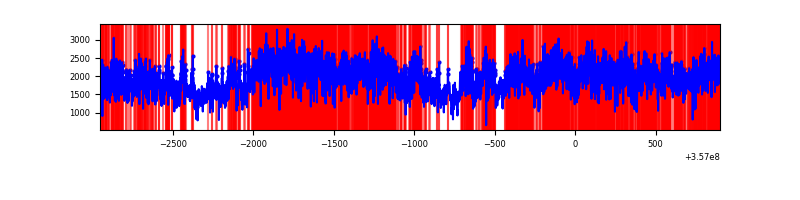 |
| D | 3851 | 3851 | 0 | 0 | 0.00% | 0.00% | 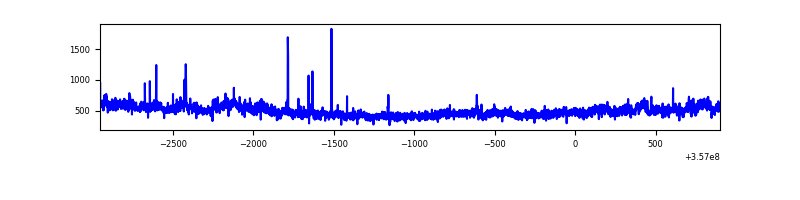 |
Top three noisy pixels from each quadrant. If the there are fewer than three noisy pixels in the level2.evt file, extra rows are filled as -1
| Pixel properties | Quadrant properties | ||||||
|---|---|---|---|---|---|---|---|
| Quadrant | DetID | PixID | Counts | Sigma | Mean | Median | Sigma |
| A | 0 | 13 | 321374 | 3495.92 | 452 | 443 | 91.8 |
| A | 13 | 254 | 7142 | 72.97 | 452 | 443 | 91.8 |
| A | 3 | 137 | 4496 | 44.15 | 452 | 443 | 91.8 |
| B | 6 | 159 | 1148649 | 13144.73 | 453 | 442 | 87.4 |
| B | 12 | 111 | 10394 | 113.93 | 453 | 442 | 87.4 |
| B | 11 | 111 | 9500 | 103.7 | 453 | 442 | 87.4 |
| C | 3 | 233 | 5931488 | 64991.39 | 391 | 394 | 91.3 |
| C | 14 | 238 | 62575 | 681.36 | 391 | 394 | 91.3 |
| C | 2 | 114 | 7595 | 78.91 | 391 | 394 | 91.3 |
| D | 8 | 195 | 137905 | 1302.39 | 443 | 432 | 105.6 |
| D | 12 | 227 | 26059 | 242.78 | 443 | 432 | 105.6 |
| D | 7 | 1 | 25473 | 237.23 | 443 | 432 | 105.6 |
Histogram calculated using DETX and DETY for each event in the final _common_clean file
| Quadrant A | 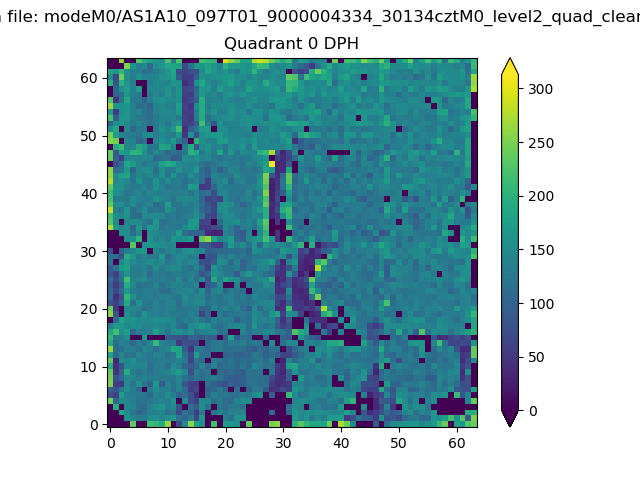 |
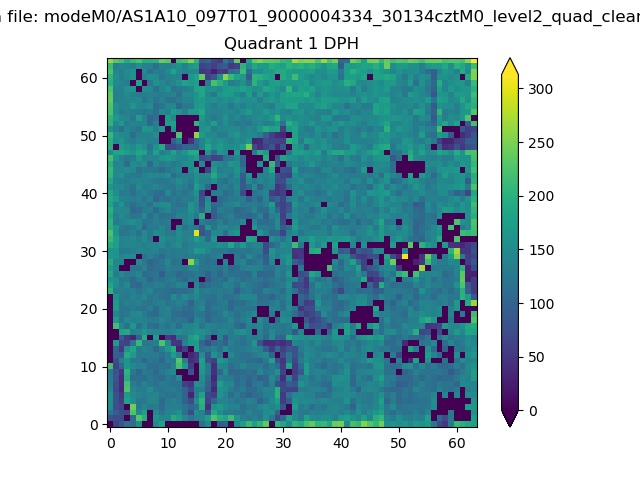 |
Quadrant B |
|---|---|---|---|
| Quadrant D | 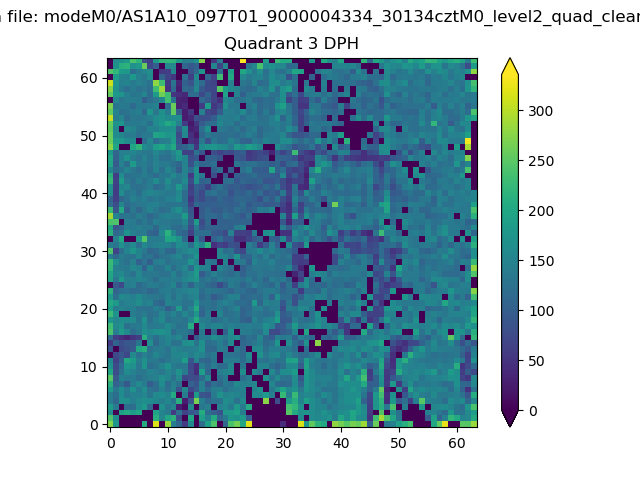 |
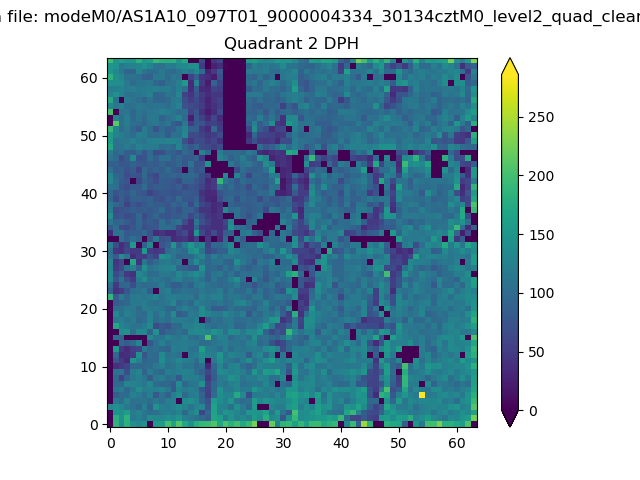 |
Quadrant C |
| Plot type | Count rate plots | Images |
|---|---|---|
| Comparison with Poisson distribution Blue bars denote a histogram of data divided into 1 sec bins. Red curve is a Poisson curve with rate = median count rate of data. |
 |
 |
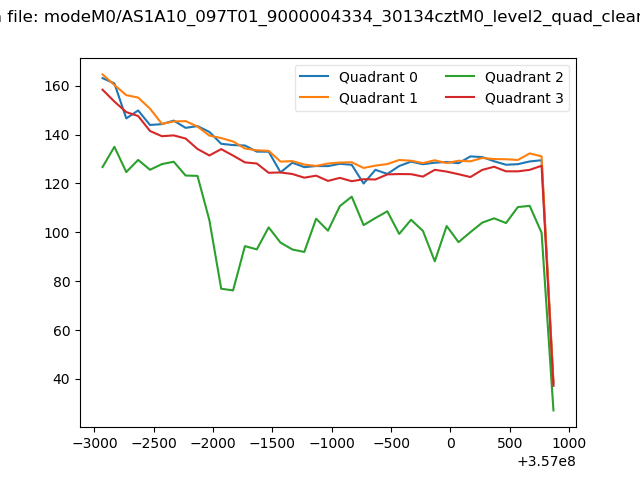
| Quadrant-wise count rates Data is divided into 100 sec bins |
 |
|
| Module-wise count rates for Quadrant A Data is divided into 100 sec bins |
 |
 |
| Module-wise count rates for Quadrant B Data is divided into 100 sec bins |
 |
 |
| Module-wise count rates for Quadrant C Data is divided into 100 sec bins |
 |
 |
| Module-wise count rates for Quadrant D Data is divided into 100 sec bins |
 |
 |
| Parameter | Plot |
|---|---|
| CZT HV Monitor |  |
| D_VDD | 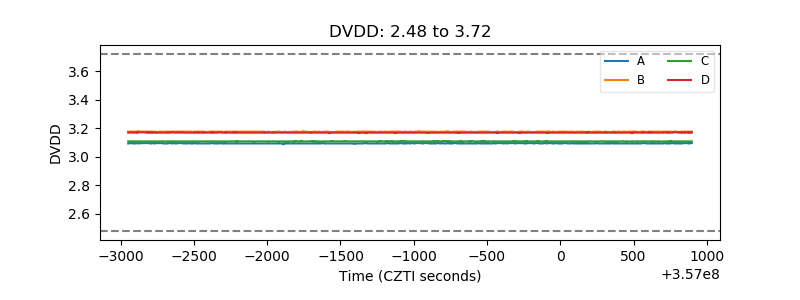 |
| Temperature 1 | 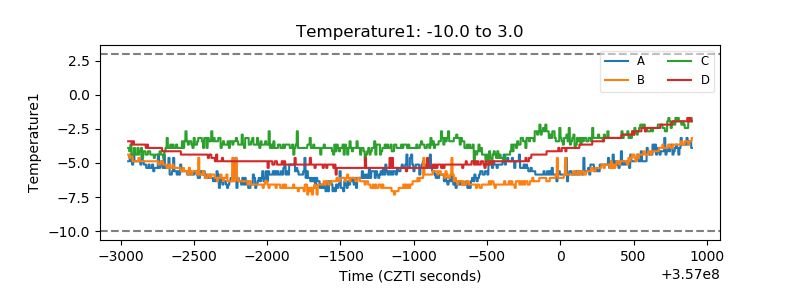 |
| Veto HV Monitor | 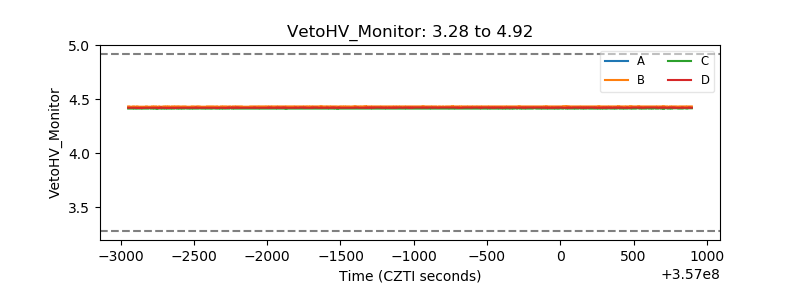 |
| Veto LLD | 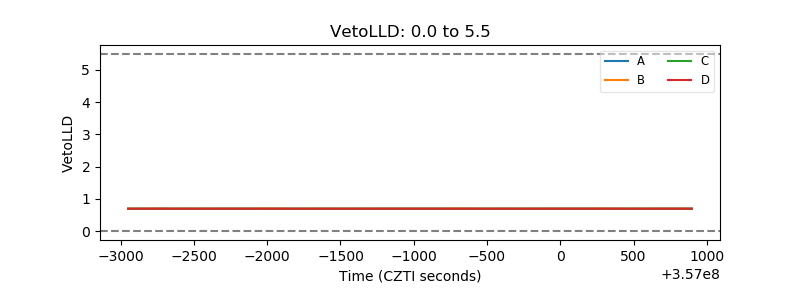 |
| Alpha Counter | 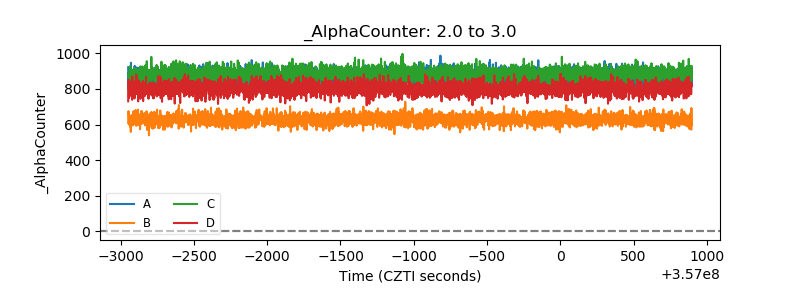 |
| _CPM_Rate | 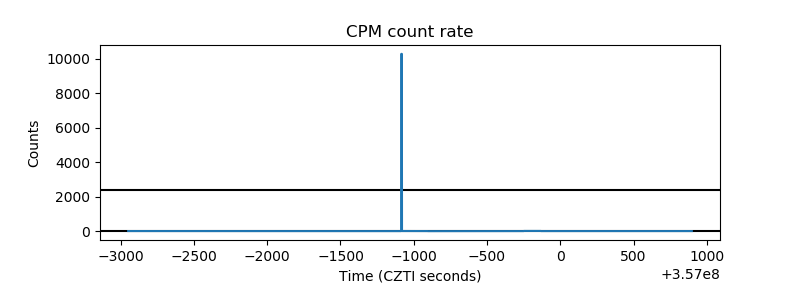 |
| CZT Counter | 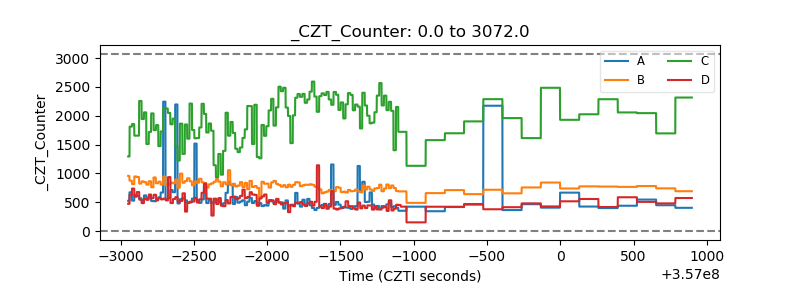 |
| +2.5 Volts monitor | 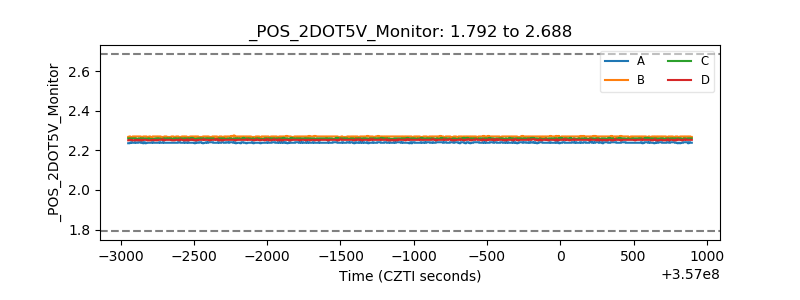 |
| +5 Volts monitor |  |
| _ROLL_ROT | 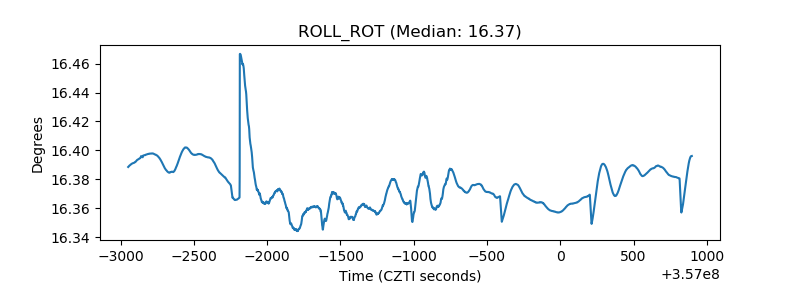 |
| _Roll_DEC | 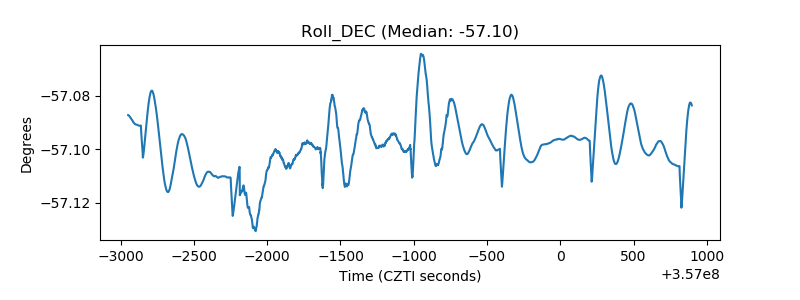 |
| _Roll_RA | 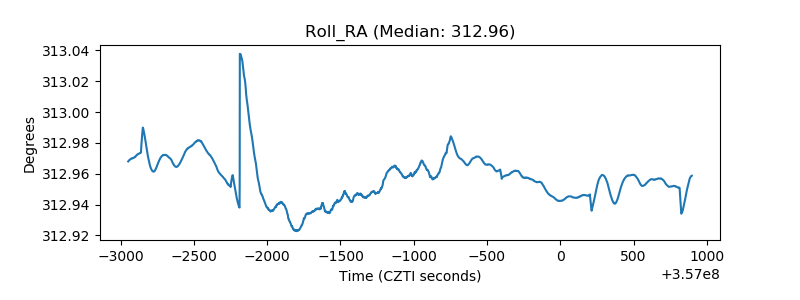 |
| Veto Counter |  |