| Param | Original file | Final file |
|---|---|---|
| Filename | modeM0/AS1A10_097T03_9000004336cztM0_level2.fits | modeM0/AS1A10_097T03_9000004336cztM0_level2_quad_clean.evt |
| Size (bytes) | 1,809,135,360 | 1,466,648,640 |
| Size | 1.7 GB | 1.4 GB |
| Events in quadrant A | 11,409,176 | 8,597,167 |
| Events in quadrant B | 10,717,762 | 8,455,003 |
| Events in quadrant C | 10,123,364 | 7,212,006 |
| Events in quadrant D | 9,966,966 | 7,594,957 |
| Mode M9 | |||
|---|---|---|---|
| Quadrant | BADHDUFLAG | Total packets | Discarded packets |
| A | 0 | 301 | 0 |
| B | 0 | 301 | 0 |
| C | 0 | 301 | 0 |
| D | 0 | 301 | 0 |
| Mode SS | |||
|---|---|---|---|
| Quadrant | BADHDUFLAG | Total packets | Discarded packets |
| A | 0 | 3724 | 0 |
| B | 0 | 3724 | 0 |
| C | 0 | 3724 | 0 |
| D | 0 | 3724 | 0 |
| Mode M0 | |||
|---|---|---|---|
| Quadrant | BADHDUFLAG | Total packets | Discarded packets |
| A | 0 | 394678 | 0 |
| B | 0 | 560404 | 0 |
| C | 0 | 725294 | 0 |
| D | 0 | 430746 | 0 |
| Quadrant | Total seconds | Saturated seconds | Saturation percentage |
|---|---|---|---|
| A | 183281 | 3423 | 1.867624% |
| B | 183280 | 4523 | 2.467809% |
| C | 183280 | 39733 | 21.678852% |
| D | 183281 | 3229 | 1.761776% |
Noise dominated data is calculated using 1-second bins in cleaned event files. If a bin has >2000 counts, and if more than 50% of those come from <1% of pixels, then it is considered to be noise-dominated and hence unusable.
| Quadrant | # 1 sec bins | Bins with >0 counts | Bins with >2000 counts | High rate bins dominated by noise | Noise dominated (total time) | Noise dominated (detector-on time) | Marked lightcurve |
|---|---|---|---|---|---|---|---|
| A | 213122 | 183268 | 0 | 0 | 0.00% | 0.00% |  |
| B | 213122 | 183268 | 0 | 0 | 0.00% | 0.00% |  |
| C | 213122 | 183215 | 0 | 0 | 0.00% | 0.00% |  |
| D | 213122 | 183268 | 0 | 0 | 0.00% | 0.00% |  |
Top three noisy pixels from each quadrant. If the there are fewer than three noisy pixels in the level2.evt file, extra rows are filled as -1
| Pixel properties | Quadrant properties | ||||||
|---|---|---|---|---|---|---|---|
| Quadrant | DetID | PixID | Counts | Sigma | Mean | Median | Sigma |
| A | 0 | 29 | 9519 | 9.47 | 2969 | 2789 | 710.4 |
| A | 7 | 110 | 8947 | 8.67 | 2969 | 2789 | 710.4 |
| A | 9 | 19 | 8446 | 7.96 | 2969 | 2789 | 710.4 |
| B | 2 | 9 | 8595 | 10.65 | 2834 | 2703 | 553.3 |
| B | 5 | 128 | 7237 | 8.19 | 2834 | 2703 | 553.3 |
| B | 3 | 17 | 7143 | 8.02 | 2834 | 2703 | 553.3 |
| C | 12 | 241 | 6998 | 6.65 | 2681 | 2520 | 673.2 |
| C | 3 | 126 | 6869 | 6.46 | 2681 | 2520 | 673.2 |
| C | 3 | 187 | 6804 | 6.36 | 2681 | 2520 | 673.2 |
| D | 15 | 46 | 7704 | 6.84 | 2848 | 2601 | 746.0 |
| D | 10 | 189 | 7131 | 6.07 | 2848 | 2601 | 746.0 |
| D | 3 | 14 | 7036 | 5.94 | 2848 | 2601 | 746.0 |
Histogram calculated using DETX and DETY for each event in the final _common_clean file
| Quadrant A |  |
 |
Quadrant B |
|---|---|---|---|
| Quadrant D | 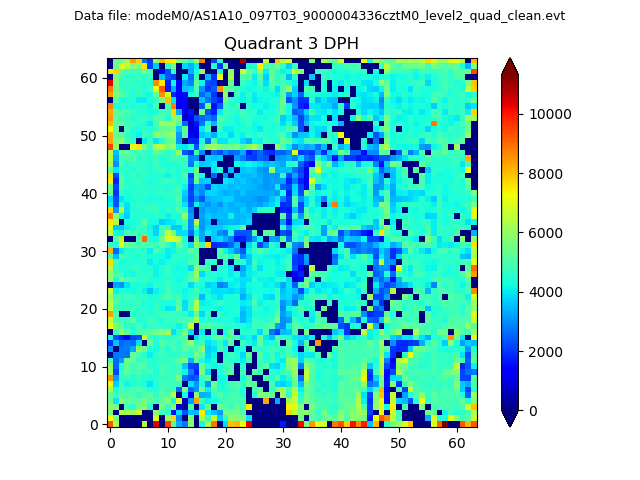 |
 |
Quadrant C |
| Plot type | Count rate plots | Images |
|---|---|---|
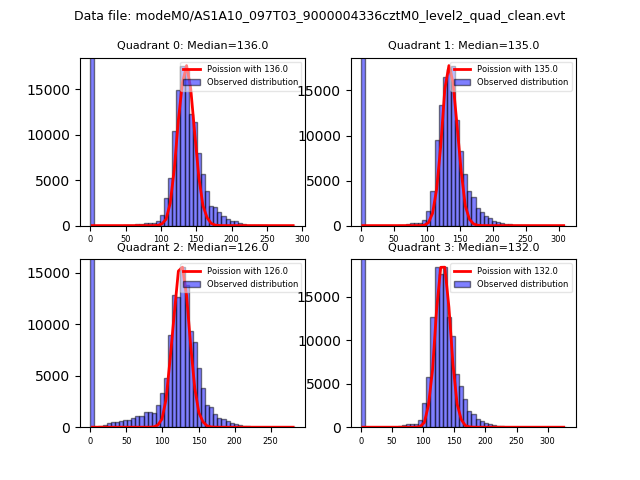
| Comparison with Poisson distribution Blue bars denote a histogram of data divided into 1 sec bins. Red curve is a Poisson curve with rate = median count rate of data. |
 |
 |
| Quadrant-wise count rates Data is divided into 100 sec bins |
 |
|
| Module-wise count rates for Quadrant A Data is divided into 100 sec bins |
 |
 |
| Module-wise count rates for Quadrant B Data is divided into 100 sec bins |
 |
 |
| Module-wise count rates for Quadrant C Data is divided into 100 sec bins |
 |
 |
| Module-wise count rates for Quadrant D Data is divided into 100 sec bins |
 |
 |
| Parameter | Plot |
|---|---|
| CZT HV Monitor |  |
| D_VDD | 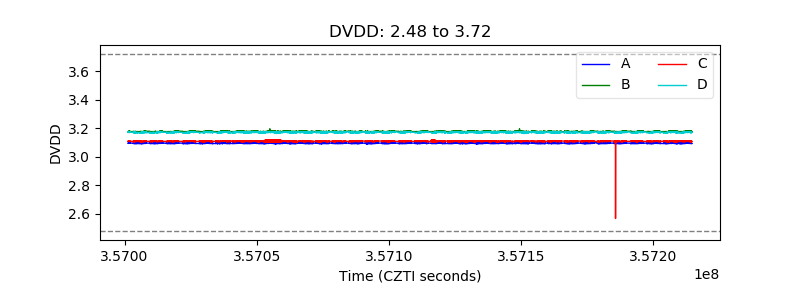 |
| Temperature 1 |  |
| Veto HV Monitor |  |
| Veto LLD |  |
| Alpha Counter |  |
| _CPM_Rate |  |
| CZT Counter |  |
| +2.5 Volts monitor |  |
| +5 Volts monitor |  |
| _ROLL_ROT |  |
| _Roll_DEC |  |
| _Roll_RA | 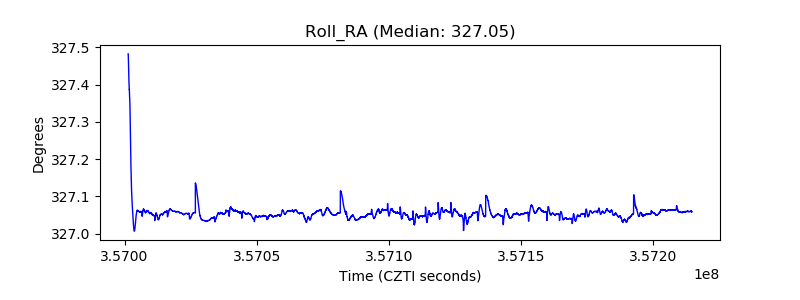 |
| Veto Counter |  |