| Param | Original file | Final file |
|---|---|---|
| Filename | modeM0/AS1A10_097T03_9000004336_30137cztM0_level2.evt | modeM0/AS1A10_097T03_9000004336_30137cztM0_level2_quad_clean.evt |
| Size (bytes) | 580,556,160 | 109,840,320 |
| Size | 553.7 MB | 104.8 MB |
| Events in quadrant A | 3,920,044 | 719,963 |
| Events in quadrant B | 5,107,491 | 733,933 |
| Events in quadrant C | 4,332,017 | 719,206 |
| Events in quadrant D | 3,800,237 | 717,492 |
| Mode M9 | |||
|---|---|---|---|
| Quadrant | BADHDUFLAG | Total packets | Discarded packets |
| A | 0 | 16 | 0 |
| B | 0 | 17 | 0 |
| C | 0 | 17 | 0 |
| D | 0 | 17 | 0 |
| Mode SS | |||
|---|---|---|---|
| Quadrant | BADHDUFLAG | Total packets | Discarded packets |
| A | 0 | 126 | 0 |
| B | 0 | 126 | 0 |
| C | 0 | 126 | 0 |
| D | 0 | 126 | 0 |
| Mode M0 | |||
|---|---|---|---|
| Quadrant | BADHDUFLAG | Total packets | Discarded packets |
| A | 0 | 15558 | 2 |
| B | 0 | 19304 | 2 |
| C | 0 | 17566 | 2 |
| D | 0 | 15334 | 2 |
| Quadrant | Total seconds | Saturated seconds | Saturation percentage |
|---|---|---|---|
| A | 6252 | 139 | 2.223289% |
| B | 6252 | 113 | 1.807422% |
| C | 6252 | 207 | 3.310940% |
| D | 6252 | 48 | 0.767754% |
Noise dominated data is calculated using 1-second bins in cleaned event files. If a bin has >2000 counts, and if more than 50% of those come from <1% of pixels, then it is considered to be noise-dominated and hence unusable.
| Quadrant | # 1 sec bins | Bins with >0 counts | Bins with >2000 counts | High rate bins dominated by noise | Noise dominated (total time) | Noise dominated (detector-on time) | Marked lightcurve |
|---|---|---|---|---|---|---|---|
| A | 7567 | 6253 | 58 | 58 | 0.77% | 0.93% | 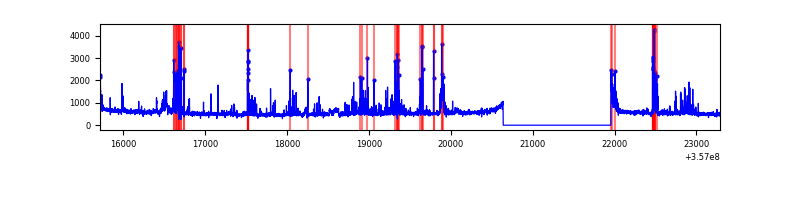 |
| B | 7567 | 6253 | 1 | 1 | 0.01% | 0.02% | 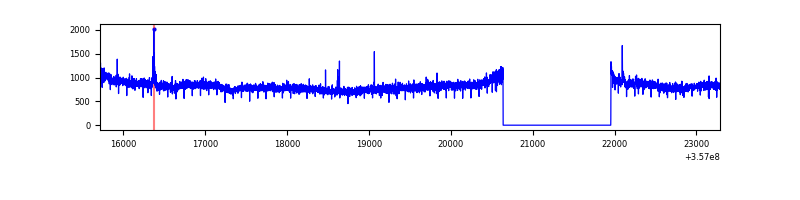 |
| C | 7567 | 6253 | 0 | 0 | 0.00% | 0.00% | 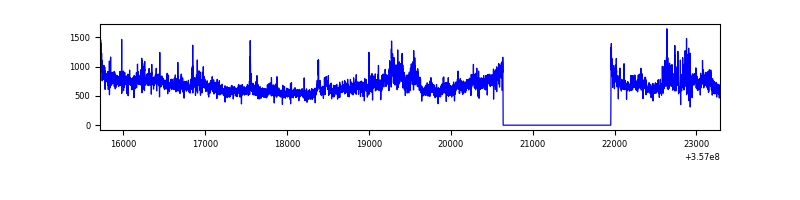 |
| D | 7567 | 6253 | 13 | 13 | 0.17% | 0.21% | 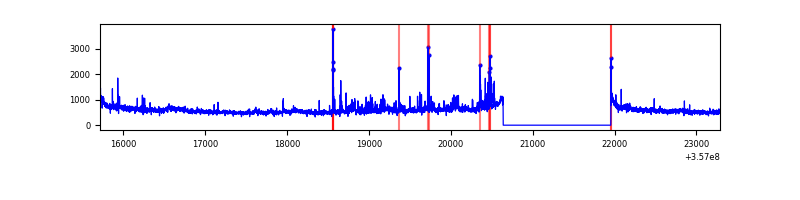 |
Top three noisy pixels from each quadrant. If the there are fewer than three noisy pixels in the level2.evt file, extra rows are filled as -1
| Pixel properties | Quadrant properties | ||||||
|---|---|---|---|---|---|---|---|
| Quadrant | DetID | PixID | Counts | Sigma | Mean | Median | Sigma |
| A | 0 | 13 | 478193 | 2848.87 | 842 | 827 | 167.6 |
| A | 15 | 174 | 175258 | 1040.99 | 842 | 827 | 167.6 |
| A | 8 | 192 | 19107 | 109.09 | 842 | 827 | 167.6 |
| B | 6 | 159 | 1783562 | 11420.73 | 841 | 821 | 156.1 |
| B | 12 | 111 | 18508 | 113.31 | 841 | 821 | 156.1 |
| B | 11 | 111 | 16759 | 102.1 | 841 | 821 | 156.1 |
| C | 3 | 233 | 853389 | 4412.22 | 835 | 843 | 193.2 |
| C | 14 | 238 | 164874 | 848.92 | 835 | 843 | 193.2 |
| C | 14 | 254 | 42228 | 214.18 | 835 | 843 | 193.2 |
| D | 8 | 195 | 209399 | 1045.15 | 842 | 827 | 199.6 |
| D | 1 | 52 | 171616 | 855.82 | 842 | 827 | 199.6 |
| D | 13 | 168 | 88005 | 436.85 | 842 | 827 | 199.6 |
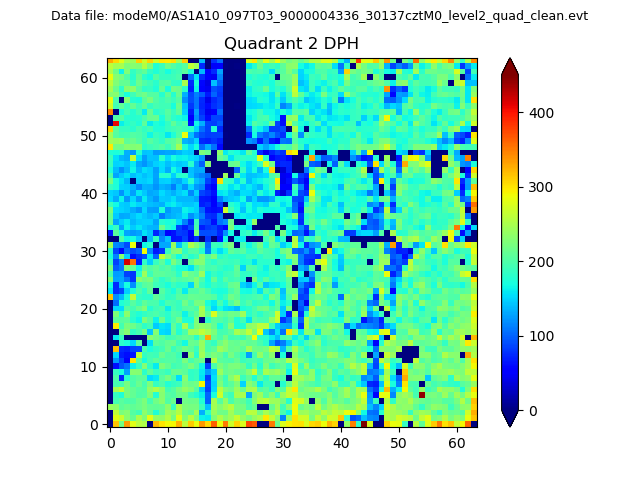
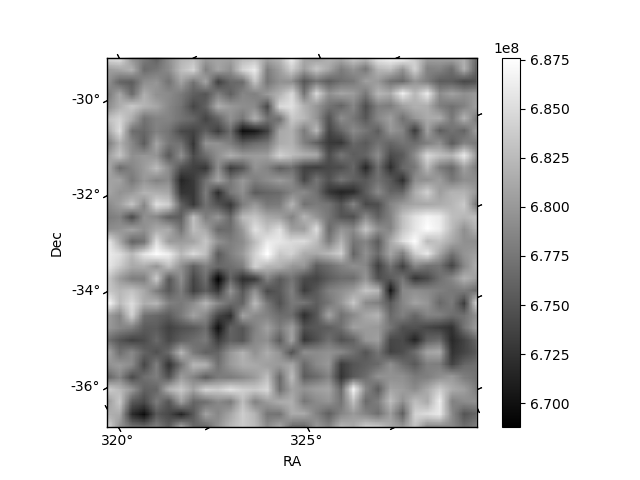
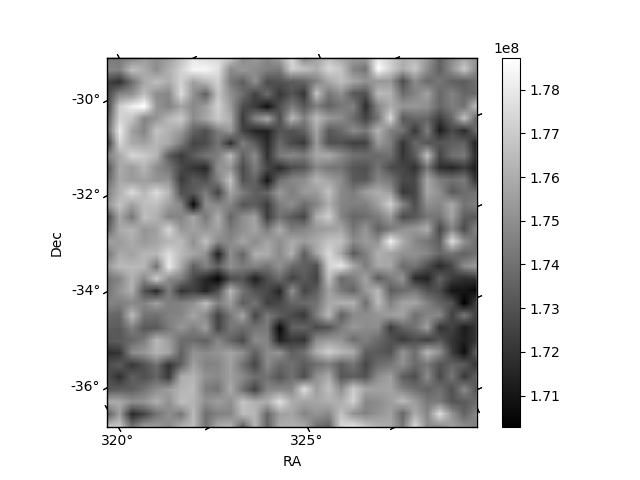
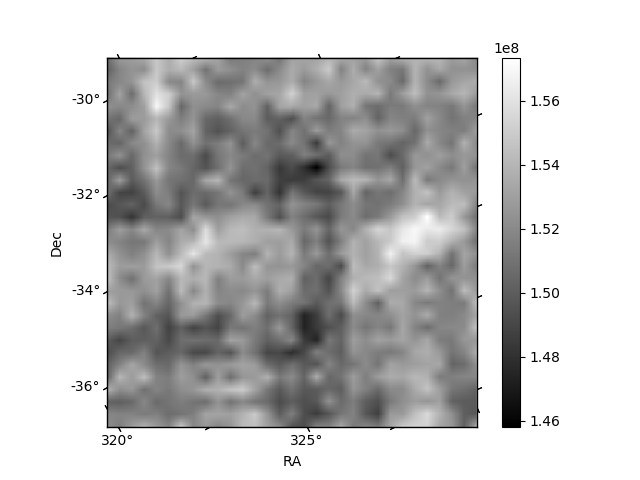
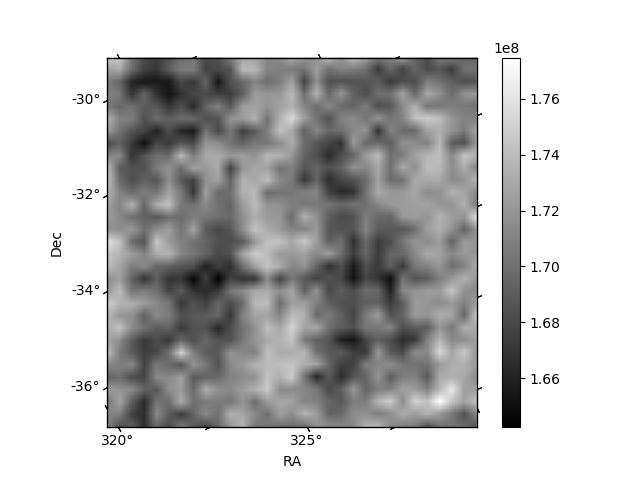
Histogram calculated using DETX and DETY for each event in the final _common_clean file
| Quadrant A | 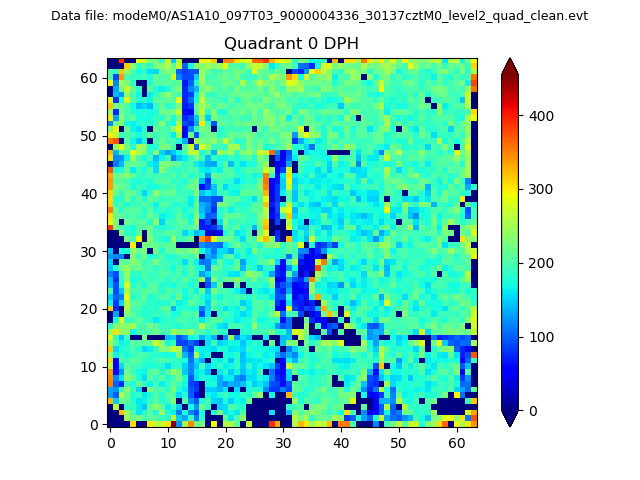 |
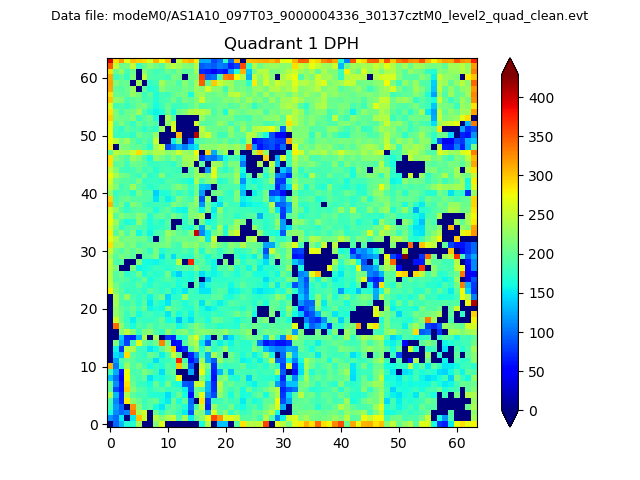 |
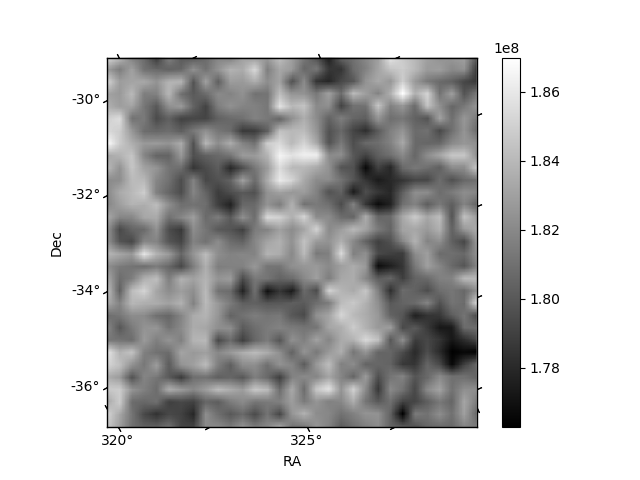
Quadrant B |
|---|---|---|---|
| Quadrant D | 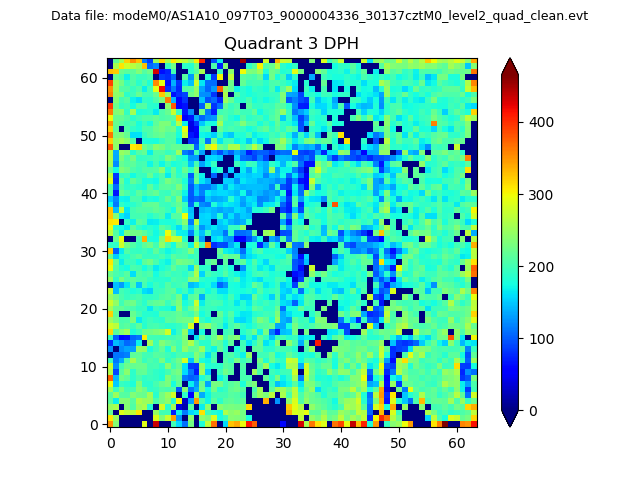 |
 |
Quadrant C |
| Plot type | Count rate plots | Images |
|---|---|---|
| Comparison with Poisson distribution Blue bars denote a histogram of data divided into 1 sec bins. Red curve is a Poisson curve with rate = median count rate of data. |
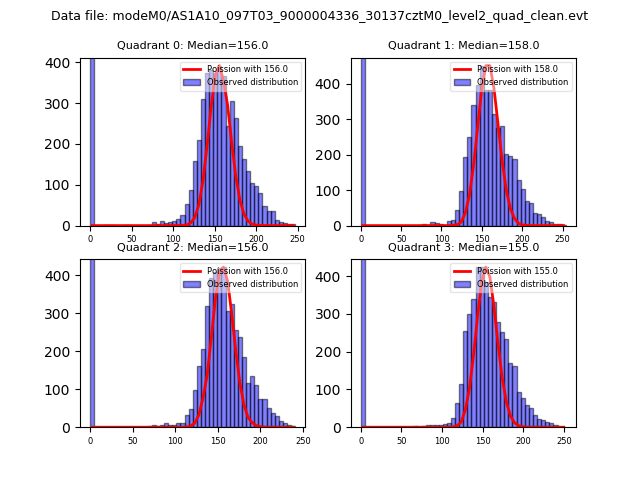 |
 |
| Quadrant-wise count rates Data is divided into 100 sec bins |
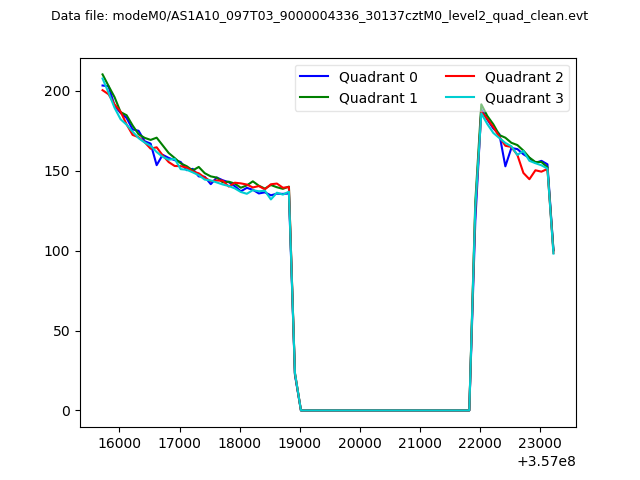 |
|
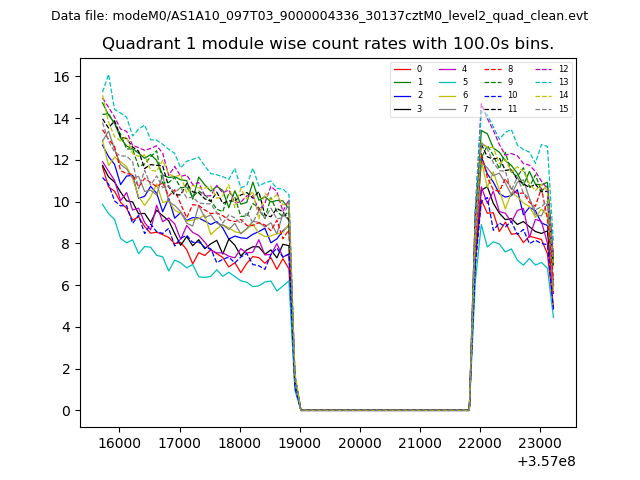
| Module-wise count rates for Quadrant A Data is divided into 100 sec bins |
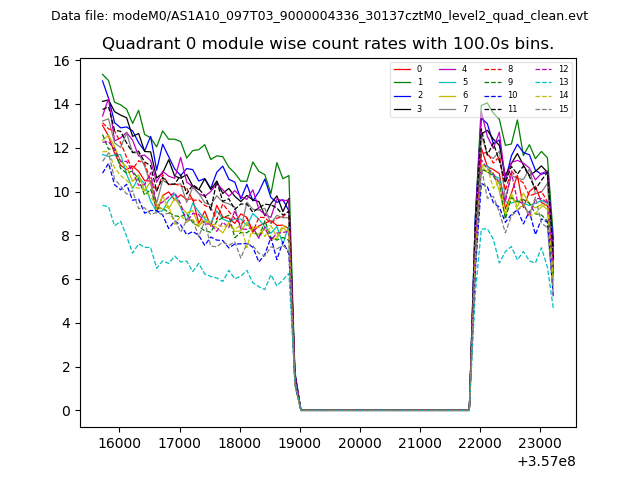 |
 |
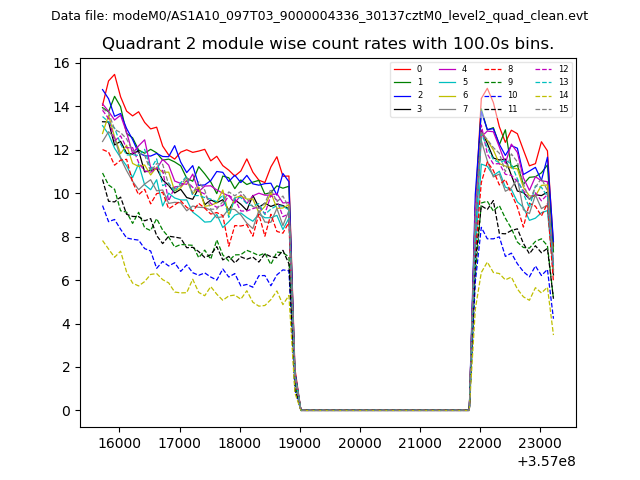
| Module-wise count rates for Quadrant B Data is divided into 100 sec bins |
 |
 |
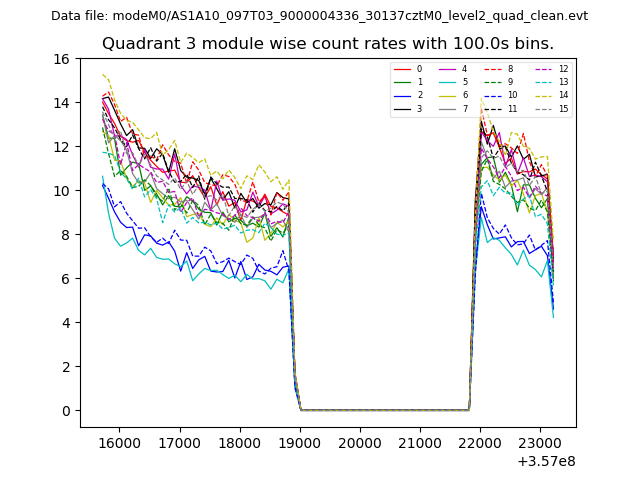
| Module-wise count rates for Quadrant C Data is divided into 100 sec bins |
 |
 |
| Module-wise count rates for Quadrant D Data is divided into 100 sec bins |
 |
 |
| Parameter | Plot |
|---|---|
| CZT HV Monitor | 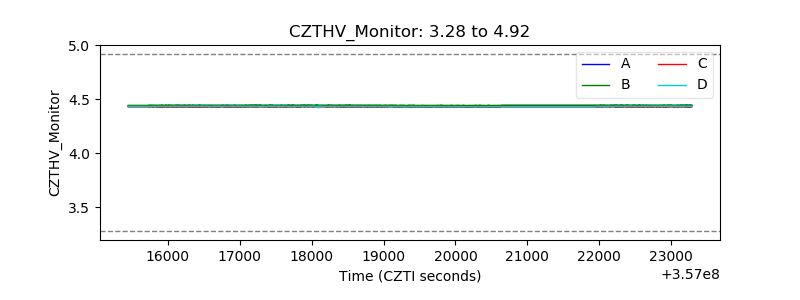 |
| D_VDD | 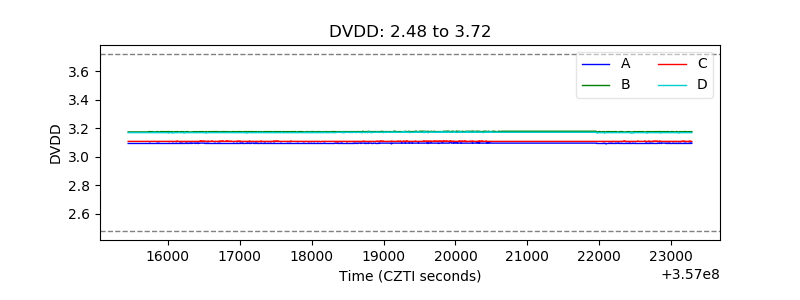 |
| Temperature 1 | 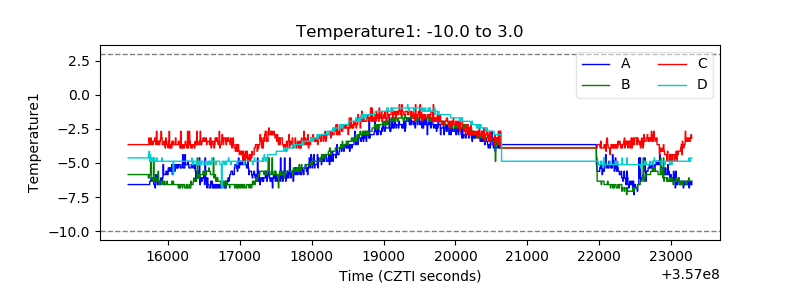 |
| Veto HV Monitor | 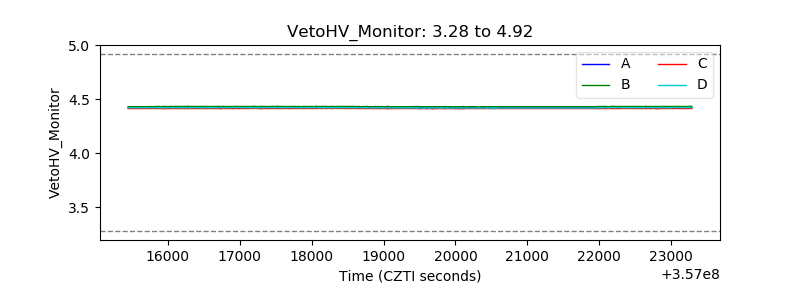 |
| Veto LLD | 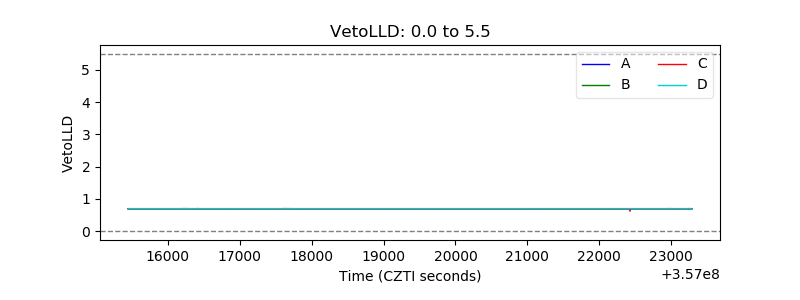 |
| Alpha Counter | 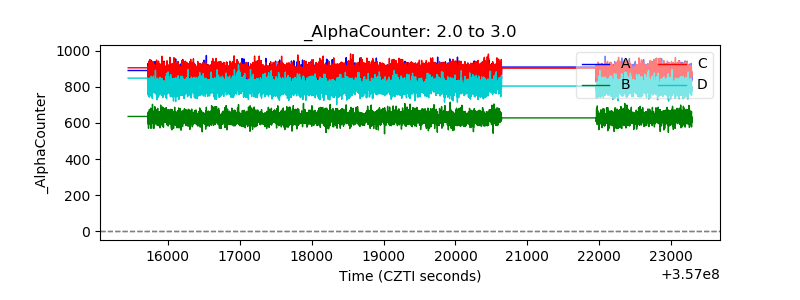 |
| _CPM_Rate | 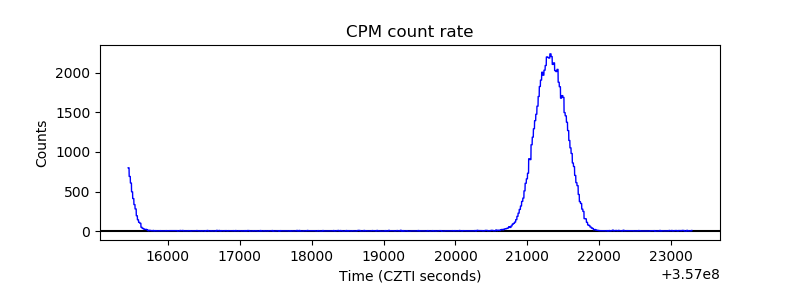 |
| CZT Counter | 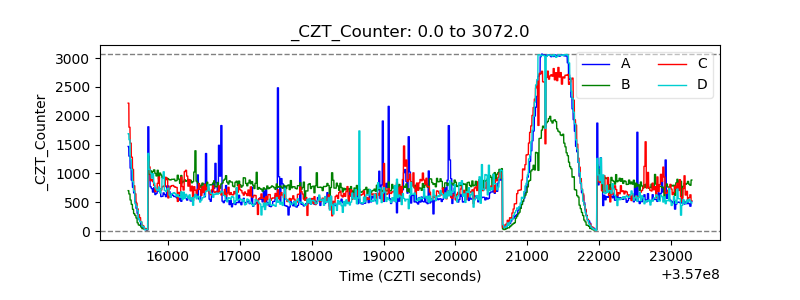 |
| +2.5 Volts monitor |  |
| +5 Volts monitor |  |
| _ROLL_ROT | 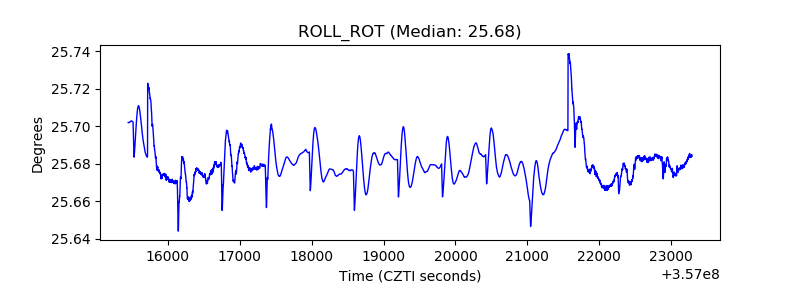 |
| _Roll_DEC | 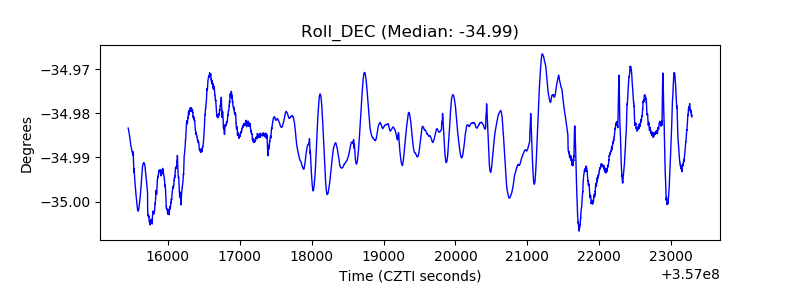 |
| _Roll_RA | 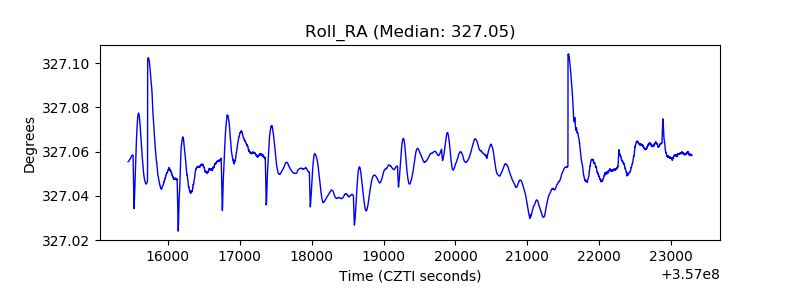 |
| Veto Counter | 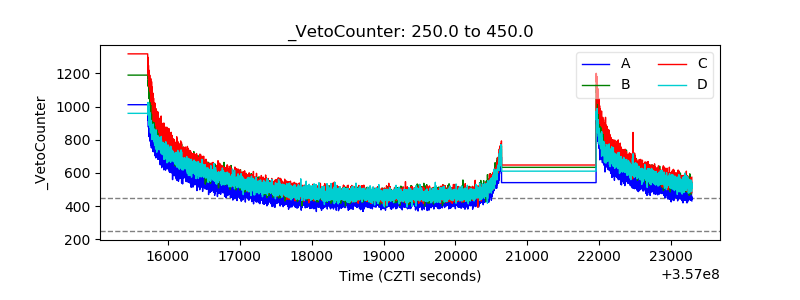 |